
World - Chewing Gum - Market Analysis, Forecast, Size, Trends And Insights
Get instant access to more than 2 million reports, dashboards, and datasets on the IndexBox Platform.
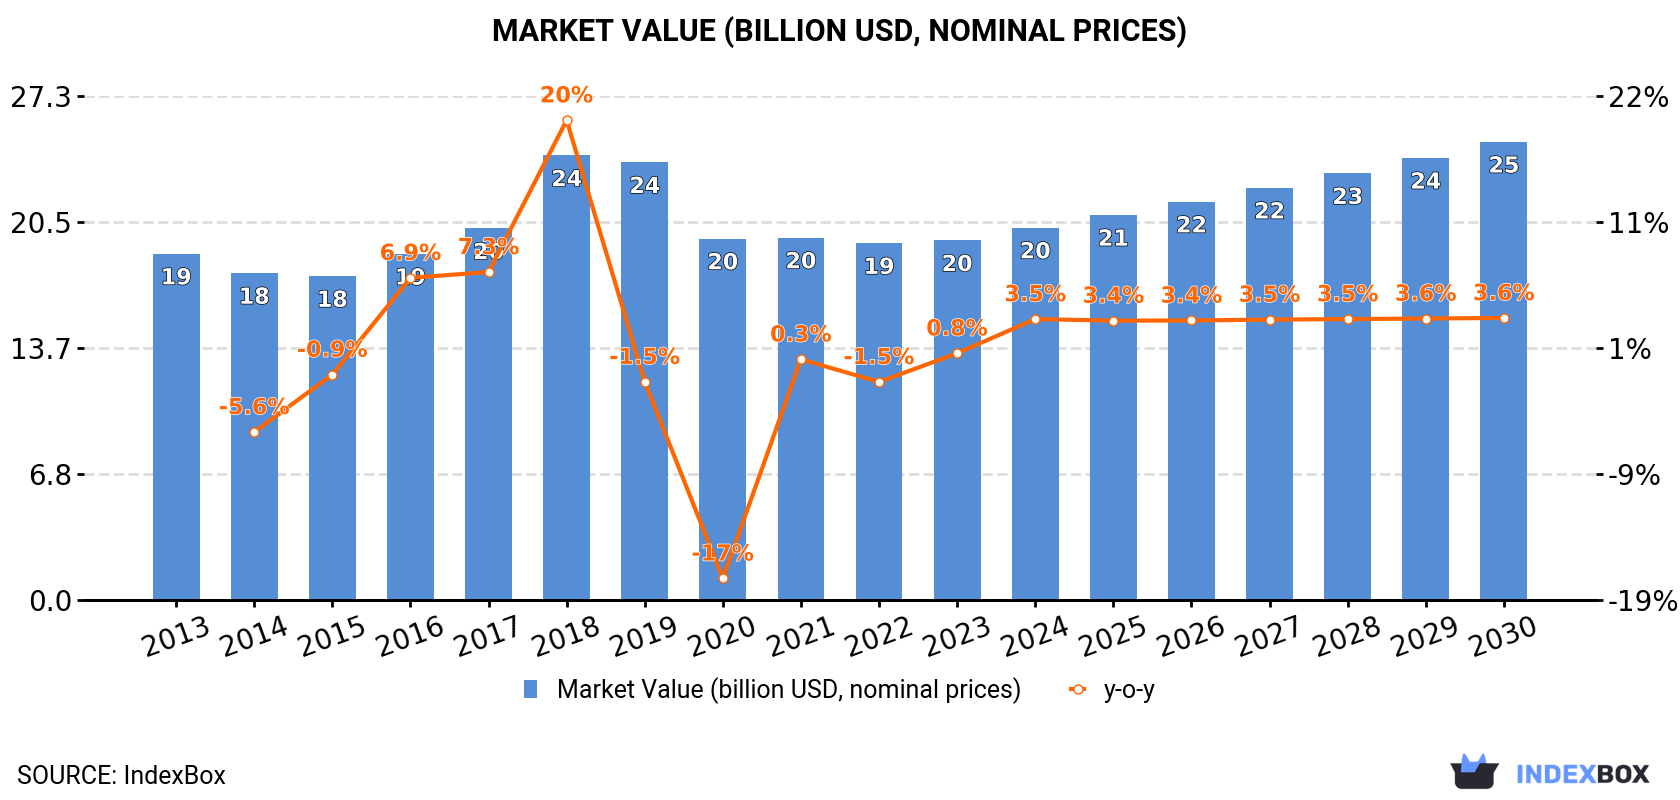
View PricingWorldwide Chewing Gum Market to Reach $24.9B by 2030 with +3.5% CAGR
IndexBox has just published a new report: World - Chewing Gum - Market Analysis, Forecast, Size, Trends And Insights.
The global chewing gum market is forecasted to show growth in both volume and value terms from 2023 to 2030, with an anticipated CAGR of +2.1% and +3.5% respectively. The market experienced stable consumption and production levels in 2023, with the United States, China, and Russia leading in both consumption and production volumes. Import and export trends indicated slight contractions, with fluctuating average prices amongst major importing and exporting countries.
Market Forecast
Market Forecast
Driven by rising demand for chewing gum worldwide, the market is expected to start an upward consumption trend over the next seven-year period. The performance of the market is forecast to increase slightly, with an anticipated CAGR of +2.1% for the period from 2023 to 2030, which is projected to bring the market volume to 4.5M tons by the end of 2030.
In value terms, the market is forecast to increase with an anticipated CAGR of +3.5% for the period from 2023 to 2030, which is projected to bring the market value to $24.9B (in nominal prices) by the end of 2030.
World Consumption of Chewing Gum
Consumption
In 2023, global chewing gum consumption shrank slightly to 3.9M tons, therefore, remained relatively stable against 2022 figures. Overall, consumption recorded a relatively flat trend pattern. The pace of growth appeared the most rapid in 2017 with an increase of 5.7% against the previous year. Global consumption peaked at 4.4M tons in 2018; however, from 2019 to 2023, consumption stood at a somewhat lower figure.
The global chewing gum market revenue was estimated at $19.5B in 2023, remaining stable against the previous year. This figure reflects the total revenues of producers and importers (excluding logistics costs, retail marketing costs, and retailers' margins, which will be included in the final consumer price). Over the period under review, consumption, however, recorded a relatively flat trend pattern. As a result, consumption reached the peak level of $24.1B. From 2019 to 2023, the growth of the global market remained at a lower figure.
Consumption By Country
The countries with the highest volumes of consumption in 2023 were Russia (714K tons), China (637K tons) and the United States (250K tons), together comprising 41% of global consumption.
From 2013 to 2023, the most notable rate of growth in terms of consumption, amongst the main consuming countries, was attained by the United States (with a CAGR of +4.7%), while consumption for the other global leaders experienced more modest paces of growth.
In value terms, Russia ($5.2B) led the market, alone. The second position in the ranking was held by China ($1.6B). It was followed by the United States.
In Russia, the chewing gum market increased at an average annual rate of +4.4% over the period from 2013-2023. In the other countries, the average annual rates were as follows: China (+1.1% per year) and the United States (+5.4% per year).
In 2023, the highest levels of chewing gum per capita consumption was registered in Russia (4,969 kg per 1000 persons), followed by Germany (945 kg per 1000 persons), Japan (743 kg per 1000 persons) and the United States (741 kg per 1000 persons), while the world average per capita consumption of chewing gum was estimated at 492 kg per 1000 persons.
In Russia, chewing gum per capita consumption remained relatively stable over the period from 2013-2023. In the other countries, the average annual rates were as follows: Germany (+1.4% per year) and Japan (+1.4% per year).
World Production of Chewing Gum
Production
In 2023, global chewing gum production shrank to 3.9M tons, almost unchanged from the previous year. Over the period under review, production saw a relatively flat trend pattern. The most prominent rate of growth was recorded in 2017 with an increase of 5.6% against the previous year. Over the period under review, global production attained the peak volume at 4.4M tons in 2018; however, from 2019 to 2023, production failed to regain momentum.
In value terms, chewing gum production reached $20.3B in 2023 estimated in export price. Overall, the total production indicated slight growth from 2013 to 2023: its value increased at an average annual rate of +1.3% over the last decade. The trend pattern, however, indicated some noticeable fluctuations being recorded throughout the analyzed period. Based on 2023 figures, production decreased by -38.7% against 2019 indices. The most prominent rate of growth was recorded in 2018 when the production volume increased by 40% against the previous year. Over the period under review, global production hit record highs at $33.1B in 2019; however, from 2020 to 2023, production failed to regain momentum.
Production By Country
The countries with the highest volumes of production in 2023 were Russia (716K tons), China (673K tons) and India (259K tons), with a combined 42% share of global production. The United States, Indonesia, Nigeria, Pakistan, Brazil, Japan, Mexico, Germany and Bangladesh lagged somewhat behind, together comprising a further 24%.
From 2013 to 2023, the most notable rate of growth in terms of production, amongst the key producing countries, was attained by the United States (with a CAGR of +5.9%), while production for the other global leaders experienced more modest paces of growth.
World Imports of Chewing Gum
Imports
In 2023, approx. 263K tons of chewing gum were imported worldwide; increasing by 7.1% on 2022. In general, imports, however, saw a slight curtailment. The growth pace was the most rapid in 2021 when imports increased by 17%. Global imports peaked at 307K tons in 2013; however, from 2014 to 2023, imports remained at a lower figure.
In value terms, chewing gum imports expanded markedly to $997M in 2023. Overall, imports, however, continue to indicate a relatively flat trend pattern. The pace of growth was the most pronounced in 2021 with an increase of 19% against the previous year. Global imports peaked at $1B in 2014; however, from 2015 to 2023, imports failed to regain momentum.
Imports By Country
In 2023, the United States (33K tons), distantly followed by South Africa (13K tons) were the main importers of chewing gum, together achieving 17% of total imports. The following importers - Democratic Republic of the Congo (12K tons), the Netherlands (7.6K tons), the United Arab Emirates (6.8K tons), Burkina Faso (6.6K tons), Germany (6.2K tons), Afghanistan (6.1K tons), Guatemala (5.7K tons), Ghana (5.3K tons), France (5.2K tons), Iraq (5.1K tons) and Uganda (4.1K tons) - together made up 27% of total imports.
From 2013 to 2023, average annual rates of growth with regard to chewing gum imports into the United States stood at -1.4%. At the same time, Burkina Faso (+39.9%), France (+12.6%), Democratic Republic of the Congo (+11.6%), Ghana (+8.1%), Guatemala (+2.9%) and Uganda (+1.7%) displayed positive paces of growth. Moreover, Burkina Faso emerged as the fastest-growing importer imported in the world, with a CAGR of +39.9% from 2013-2023. The Netherlands experienced a relatively flat trend pattern. By contrast, Germany (-2.4%), South Africa (-2.7%), Afghanistan (-5.0%), the United Arab Emirates (-5.3%) and Iraq (-6.7%) illustrated a downward trend over the same period. While the share of Democratic Republic of the Congo (+3.2 p.p.) and Burkina Faso (+2.4 p.p.) increased significantly, the shares of the other countries remained relatively stable throughout the analyzed period.
In value terms, the United States ($133M) constitutes the largest market for imported chewing gum worldwide, comprising 13% of global imports. The second position in the ranking was held by Germany ($44M), with a 4.4% share of global imports. It was followed by the Netherlands, with a 3.9% share.
In the United States, chewing gum imports increased at an average annual rate of +1.1% over the period from 2013-2023. The remaining importing countries recorded the following average annual rates of imports growth: Germany (-2.2% per year) and the Netherlands (+0.4% per year).
Import Prices By Country
The average chewing gum import price stood at $3,797 per ton in 2023, with an increase of 4.6% against the previous year. Over the last decade, it increased at an average annual rate of +1.3%. The pace of growth was the most pronounced in 2018 an increase of 10%. Global import price peaked in 2023 and is likely to see steady growth in the near future.
There were significant differences in the average prices amongst the major importing countries. In 2023, amid the top importers, the country with the highest price was Germany ($7,063 per ton), while Burkina Faso ($269 per ton) was amongst the lowest.
From 2013 to 2023, the most notable rate of growth in terms of prices was attained by Guatemala (+3.4%), while the other global leaders experienced more modest paces of growth.
World Exports of Chewing Gum
Exports
In 2023, global exports of chewing gum expanded remarkably to 253K tons, growing by 8.3% against the year before. Overall, exports, however, recorded a slight contraction. The pace of growth was the most pronounced in 2021 with an increase of 20% against the previous year. The global exports peaked at 320K tons in 2014; however, from 2015 to 2023, the exports remained at a lower figure.
In value terms, chewing gum exports reached $972M in 2023. In general, exports, however, showed a slight reduction. The pace of growth was the most pronounced in 2021 when exports increased by 18% against the previous year. Over the period under review, the global exports attained the maximum at $1.1B in 2013; however, from 2014 to 2023, the exports failed to regain momentum.
Exports By Country
In 2023, China (39K tons), distantly followed by Canada (21K tons), Turkey (17K tons), the Netherlands (15K tons) and Pakistan (14K tons) were the largest exporters of chewing gum, together generating 42% of total exports. Kenya (11K tons), Mexico (11K tons), India (10K tons), Swaziland (9.7K tons), Saudi Arabia (8.3K tons), the Philippines (7.9K tons), Spain (7.2K tons) and the United States (7.1K tons) followed a long way behind the leaders.
From 2013 to 2023, the most notable rate of growth in terms of shipments, amongst the main exporting countries, was attained by the Netherlands (with a CAGR of +9.9%), while the other global leaders experienced more modest paces of growth.
In value terms, the largest chewing gum supplying countries worldwide were China ($102M), Canada ($75M) and Turkey ($69M), together comprising 25% of global exports. The Netherlands, Spain, Mexico, the United States, Pakistan, the Philippines, Kenya, Saudi Arabia, Swaziland and India lagged somewhat behind, together accounting for a further 36%.
Among the main exporting countries, the Philippines, with a CAGR of +7.3%, saw the highest growth rate of the value of exports, over the period under review, while shipments for the other global leaders experienced more modest paces of growth.
Export Prices By Country
In 2023, the average chewing gum export price amounted to $3,844 per ton, surging by 4.3% against the previous year. Over the period under review, the export price continues to indicate a relatively flat trend pattern. The pace of growth was the most pronounced in 2022 an increase of 4.7% against the previous year. Over the period under review, the average export prices hit record highs in 2023 and is expected to retain growth in years to come.
Prices varied noticeably by country of origin: amid the top suppliers, the country with the highest price was Spain ($6,745 per ton), while India ($1,468 per ton) was amongst the lowest.
From 2013 to 2023, the most notable rate of growth in terms of prices was attained by Canada (+4.3%), while the other global leaders experienced more modest paces of growth.
This report provides an in-depth analysis of the global chewing gum market. Within it, you will discover the latest data on market trends and opportunities by country, consumption, production and price developments, as well as the global trade (imports and exports). The forecast exhibits the market prospects through 2030.
Product coverage:
- Prodcom 10822310 - Chewing gum
Country coverage:
Worldwide - the report contains statistical data for 200 countries and includes detailed profiles of the 50 largest consuming countries:
- USA
- China
- Japan
- Germany
- United Kingdom
- France
- Brazil
- Italy
- Russian Federation
- India
- Canada
- Australia
- Republic of Korea
- Spain
- Mexico
- Indonesia
- Netherlands
- Turkey
- Saudi Arabia
- Switzerland
- Sweden
- Nigeria
- Poland
- Belgium
- Argentina
- Norway
- Austria
- Thailand
- United Arab Emirates
- Colombia
- Denmark
- South Africa
- Malaysia
- Israel
- Singapore
- Egypt
- Philippines
- Finland
- Chile
- Ireland
- Pakistan
- Greece
- Portugal
- Kazakhstan
- Algeria
- Czech Republic
- Qatar
- Peru
- Romania
- Vietnam
+ the largest producing countries
Data coverage:
- Global market volume and value
- Per Capita consumption
- Forecast of the market dynamics in the medium term
- Global production, split by region and country
- Global trade (exports and imports)
- Export and import prices
- Market trends, drivers and restraints
- Key market players and their profiles
Reasons to buy this report:
- Take advantage of the latest data
- Find deeper insights into current market developments
- Discover vital success factors affecting the market
This report is designed for manufacturers, distributors, importers, and wholesalers, as well as for investors, consultants and advisors.
In this report, you can find information that helps you to make informed decisions on the following issues:
- How to diversify your business and benefit from new market opportunities
- How to load your idle production capacity
- How to boost your sales on overseas markets
- How to increase your profit margins
- How to make your supply chain more sustainable
- How to reduce your production and supply chain costs
- How to outsource production to other countries
- How to prepare your business for global expansion
While doing this research, we combine the accumulated expertise of our analysts and the capabilities of artificial intelligence. The AI-based platform, developed by our data scientists, constitutes the key working tool for business analysts, empowering them to discover deep insights and ideas from the marketing data.
-
1. INTRODUCTION
Making Data-Driven Decisions to Grow Your Business
- REPORT DESCRIPTION
- RESEARCH METHODOLOGY AND AI PLATFORM
- DATA-DRIVEN DECISIONS FOR YOUR BUSINESS
- GLOSSARY AND SPECIFIC TERMS
-
2. EXECUTIVE SUMMARY
A Quick Overview of Market Performance
- KEY FINDINGS
- MARKET TRENDS This Chapter is Available Only for the Professional Edition PRO
-
3. MARKET OVERVIEW
Understanding the Current State of The Market and Its Prospects
- MARKET SIZE
- CONSUMPTION BY COUNTRY
- MARKET FORECAST TO 2030
-
4. MOST PROMISING PRODUCT
Finding New Products to Diversify Your Business
This Chapter is Available Only for the Professional Edition PRO- TOP PRODUCTS TO DIVERSIFY YOUR BUSINESS
- BEST-SELLING PRODUCTS
- MOST CONSUMED PRODUCT
- MOST TRADED PRODUCT
- MOST PROFITABLE PRODUCT FOR EXPORT
-
5. MOST PROMISING SUPPLYING COUNTRIES
Choosing the Best Countries to Establish Your Sustainable Supply Chain
This Chapter is Available Only for the Professional Edition PRO- TOP COUNTRIES TO SOURCE YOUR PRODUCT
- TOP PRODUCING COUNTRIES
- TOP EXPORTING COUNTRIES
- LOW-COST EXPORTING COUNTRIES
-
6. MOST PROMISING OVERSEAS MARKETS
Choosing the Best Countries to Boost Your Exports
This Chapter is Available Only for the Professional Edition PRO- TOP OVERSEAS MARKETS FOR EXPORTING YOUR PRODUCT
- TOP CONSUMING MARKETS
- UNSATURATED MARKETS
- TOP IMPORTING MARKETS
- MOST PROFITABLE MARKETS
7. GLOBAL PRODUCTION
The Latest Trends and Insights into The Industry
- PRODUCTION VOLUME AND VALUE
- PRODUCTION BY COUNTRY
8. GLOBAL IMPORTS
The Largest Importers on The Market and How They Succeed
- IMPORTS FROM 2012–2023
- IMPORTS BY COUNTRY
- IMPORT PRICES BY COUNTRY
9. GLOBAL EXPORTS
The Largest Exporters on The Market and How They Succeed
- EXPORTS FROM 2012–2023
- EXPORTS BY COUNTRY
- EXPORT PRICES BY COUNTRY
-
10. PROFILES OF MAJOR PRODUCERS
The Largest Producers on The Market and Their Profiles
This Chapter is Available Only for the Professional Edition PRO -
11. COUNTRY PROFILES
The Largest Markets And Their Profiles
This Chapter is Available Only for the Professional Edition PRO- United States
- China
- Japan
- Germany
- United Kingdom
- France
- Brazil
- Italy
- Russian Federation
- India
- Canada
- Australia
- Republic of Korea
- Spain
- Mexico
- Indonesia
- Netherlands
- Turkey
- Saudi Arabia
- Switzerland
- Sweden
- Nigeria
- Poland
- Belgium
- Argentina
- Norway
- Austria
- Thailand
- United Arab Emirates
- Colombia
- Denmark
- South Africa
- Malaysia
- Israel
- Singapore
- Egypt
- Philippines
- Finland
- Chile
- Ireland
- Pakistan
- Greece
- Portugal
- Kazakhstan
- Algeria
- Czech Republic
- Qatar
- Peru
- Romania
- Vietnam
-
LIST OF TABLES
- Key Findings In 2023
- Market Volume, In Physical Terms, 2012–2023
- Market Value, 2012–2023
- Per Capita Consumption, By Country, 2018–2023
- Production, In Physical Terms, By Country, 2012–2023
- Imports, In Physical Terms, By Country, 2012–2023
- Imports, In Value Terms, By Country, 2012–2023
- Import Prices, By Country Of Destination, 2012–2023
- Exports, In Physical Terms, By Country, 2012–2023
- Exports, In Value Terms, By Country, 2012–2023
- Export Prices, By Country Of Origin, 2012–2023
-
LIST OF FIGURES
- Market Volume, In Physical Terms, 2012–2023
- Market Value, 2012–2023
- Consumption, By Country, 2023
- Market Volume Forecast to 2030
- Market Value Forecast to 2030
- Products: Market Size And Growth, By Type
- Products: Average Per Capita Consumption, By Type
- Products: Exports And Growth, By Type
- Products: Export Prices And Growth, By Type
- Production Volume And Growth
- Exports And Growth
- Export Prices And Growth
- Market Size And Growth
- Per Capita Consumption
- Imports And Growth
- Import Prices
- Production, In Physical Terms, 2012–2023
- Production, In Value Terms, 2012–2023
- Production, By Country, 2023
- Production, In Physical Terms, By Country, 2012–2023
- Imports, In Physical Terms, 2012–2023
- Imports, In Value Terms, 2012–2023
- Imports, In Physical Terms, By Country, 2023
- Imports, In Physical Terms, By Country, 2012–2023
- Imports, In Value Terms, By Country, 2012–2023
- Import Prices, By Country, 2012–2023
- Exports, In Physical Terms, 2012–2023
- Exports, In Value Terms, 2012–2023
- Exports, In Physical Terms, By Country, 2023
- Exports, In Physical Terms, By Country, 2012–2023
- Exports, In Value Terms, By Country, 2012–2023
- Export Prices, 2012–2023


