Average Price of Commercial Printing in China Is $4,036 per Ton
China Commercial Printing Export Price in June 2023
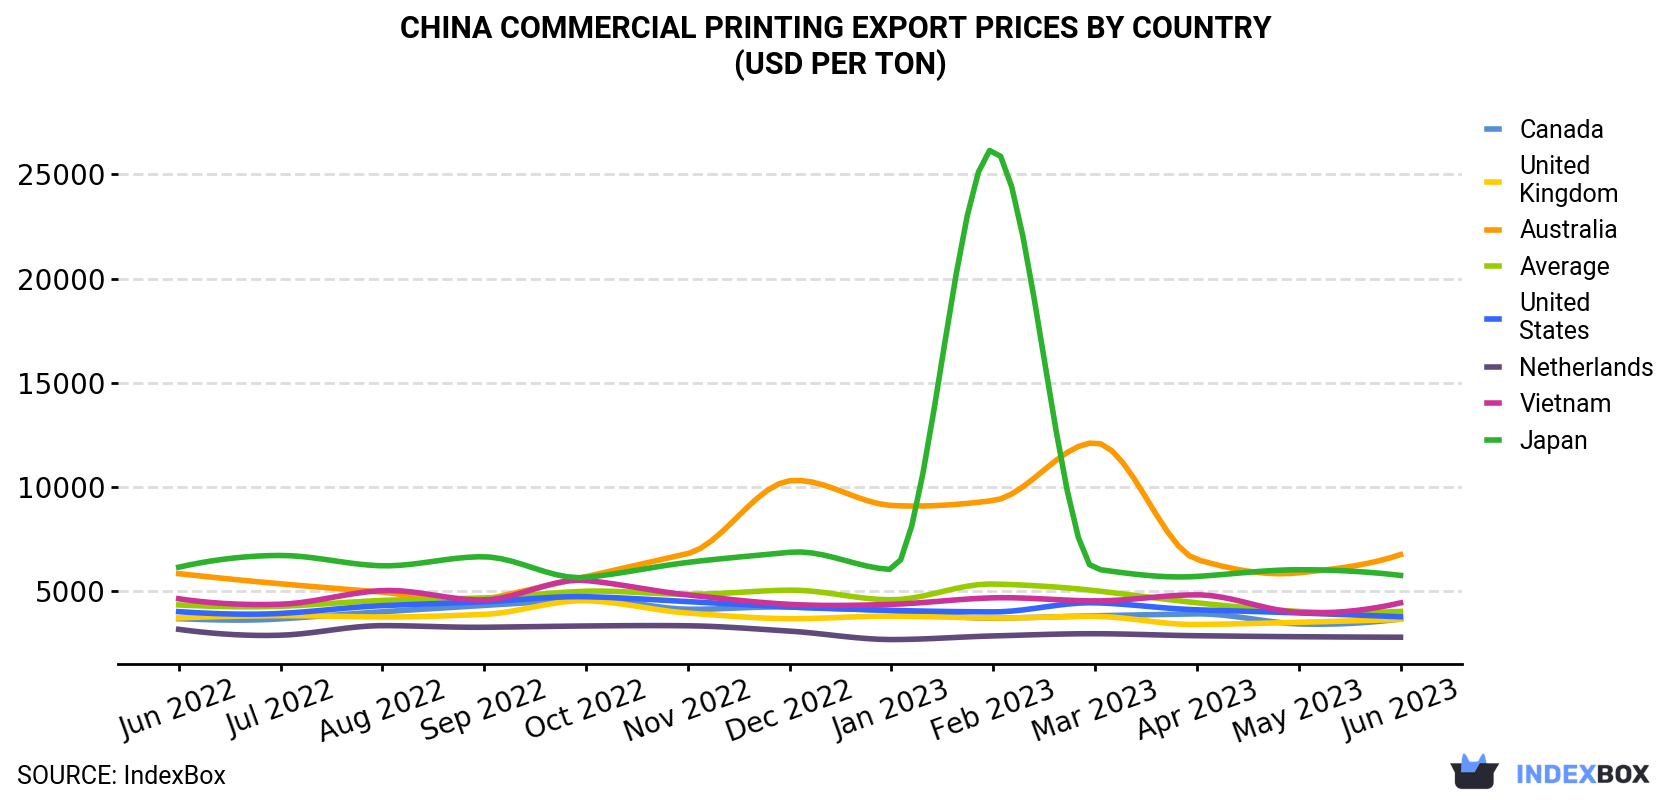
In June 2023, the commercial printing price stood at $4,036 per ton (FOB, China), almost unchanged from the previous month. Over the period under review, the export price, however, recorded a relatively flat trend pattern. The pace of growth appeared the most rapid in February 2023 when the average export price increased by 16% against the previous month. As a result, the export price reached the peak level of $5,351 per ton. From March 2023 to June 2023, the the average export prices remained at a lower figure.
There were significant differences in the average prices for the major export markets. In June 2023, the country with the highest price was Australia ($6,762 per ton), while the average price for exports to the Netherlands ($2,798 per ton) was amongst the lowest.
From June 2022 to June 2023, the most notable rate of growth in terms of prices was recorded for supplies to Australia (+1.2%), while the prices for the other major destinations experienced a decline.
| COUNTRY | Export Price of Commercial Printing in China (USD per ton) | ||||||||||||
|---|---|---|---|---|---|---|---|---|---|---|---|---|---|
| Jun 2022 | Jul 2022 | Aug 2022 | Sep 2022 | Oct 2022 | Nov 2022 | Dec 2022 | Jan 2023 | Feb 2023 | Mar 2023 | Apr 2023 | May 2023 | Jun 2023 | |
| Australia | 5,849 | 5,361 | 4,959 | 4,595 | 5,705 | 6,814 | 10,305 | 9,120 | 9,355 | 12,128 | 6,528 | 5,888 | 6,762 |
| Japan | 6,159 | 6,721 | 6,225 | 6,658 | 5,670 | 6,388 | 6,873 | 6,050 | 26,209 | 6,074 | 5,714 | 6,036 | 5,764 |
| Vietnam | 4,643 | 4,381 | 5,036 | 4,584 | 5,519 | 4,828 | 4,375 | 4,376 | 4,688 | 4,541 | 4,833 | 3,986 | 4,446 |
| United States | 4,025 | 3,940 | 4,313 | 4,499 | 4,742 | 4,507 | 4,250 | 4,089 | 4,014 | 4,450 | 4,113 | 3,963 | 3,779 |
| Canada | 3,688 | 3,678 | 4,020 | 4,324 | 4,602 | 4,141 | 4,246 | 4,061 | 3,711 | 3,825 | 3,918 | 3,437 | 3,670 |
| United Kingdom | 3,725 | 3,831 | 3,770 | 3,895 | 4,551 | 3,957 | 3,688 | 3,809 | 3,722 | 3,798 | 3,407 | 3,513 | 3,649 |
| Netherlands | 3,176 | 2,894 | 3,354 | 3,276 | 3,337 | 3,347 | 3,091 | 2,686 | 2,860 | 2,966 | 2,870 | 2,822 | 2,798 |
| Average | 4,347 | 4,282 | 4,562 | 4,683 | 5,004 | 4,856 | 5,057 | 4,593 | 5,351 | 5,032 | 4,450 | 4,036 | 4,036 |
China Commercial Printing Export Prices by Type
Prices varied noticeably by the product type; the product with the highest price was stamps; stamp-impressed paper; cheque forms; banknotes, stock, share or bond certificates and the like ($134K per ton), while the average price for exports of newspapers, journals and periodicals, appearing at least four times a week ($333 per ton) was amongst the lowest.
From June 2022 to June 2023, the most notable rate of growth in terms of prices was recorded for the following types: vitrifiable transfer (decalcomania) (+10.5%), while the prices for the other products experienced more modest paces of growth.
China Commercial Printing Exports
For the fourth consecutive month, China recorded growth in overseas shipments of commercial printing (except screen and books), which increased by 10% to 166K tons in June 2023. In general, exports continue to indicate a relatively flat trend pattern. The most prominent rate of growth was recorded in March 2023 when exports increased by 97% month-to-month.
In value terms, commercial printing exports expanded sharply to $669M (IndexBox estimates) in June 2023. Overall, exports, however, continue to indicate a relatively flat trend pattern. The most prominent rate of growth was recorded in March 2023 with an increase of 85% against the previous month.
China Commercial Printing Exports by Type
Registers, account books, order books and receipt books (58K tons), books, brochures, leaflets and similar printed matter (38K tons) and self-adhesive printed labels (9.8K tons) were the main products of commercial printing exports from China, together accounting for 64% of total exports. Playing cards, printed or illustrated postcards and printed cards, printed matter of other kinds, calendars and calendar blocks, printed picture, design and photograph n.e.s. , paper binders, folders and file covers, trade advertising materials and commercial catalogues, transfers (decalcomanias), other than vitrifiable, albums for samples, collections, stamps or photographs, blotting pads and book covers, rolls, sheets and dials, printed for self-recording apparatus, in rolls, in rectangular sheets, or cut into dials, printed matter in single sheets, whether or not folded, manifold business forms and interleaved carbon sets, vitrifiable transfers (decalcomanias), stamps; stamp-impressed paper; cheque forms; banknotes, stock, share or bond certificates and the like, newspapers, journals and periodicals appearing less frequently than four times a week, newspapers, journals and periodicals, appearing at least four times a week and music, printed or in manuscript, whether or not bound or illustrated lagged somewhat behind, together comprising a further 36%.
From June 2022 to June 2023, the biggest increases were in music, printed or in manuscript (with a CAGR of +46.0%), while shipments for the other products experienced more modest paces of growth.
In value terms, registers, account books, order books and receipt books ($188M), books, brochures, leaflets and similar printed matter ($111M) and self-adhesive printed labels ($78M) appeared to be the most exported types of commercial printing (except screen and books) from China worldwide, with a combined 56% share of total exports. These products were followed by trade advertising materials and commercial catalogues, printed or illustrated postcards and printed cards, printed matter of other kinds, playing cards, printed picture, design and photograph n.e.s. , calendars and calendar blocks, transfers (decalcomanias), other than vitrifiable, albums for samples, collections, stamps or photographs, stamps; stamp-impressed paper; cheque forms; banknotes, stock, share or bond certificates and the like, paper binders, folders and file covers, blotting pads and book covers, rolls, sheets and dials, printed for self-recording apparatus, in rolls, in rectangular sheets, or cut into dials, vitrifiable transfers (decalcomanias), printed matter in single sheets, whether or not folded, manifold business forms and interleaved carbon sets, newspapers, journals and periodicals appearing less frequently than four times a week, music, printed or in manuscript, whether or not bound or illustrated and newspapers, journals and periodicals, appearing at least four times a week, which together accounted for a further 44%.
Music, printed or in manuscript, with a CAGR of +38.2%, recorded the highest growth rate of the value of exports, among the main product categories over the period under review, while shipments for the other products experienced more modest paces of growth.
China Commercial Printing Exports by Country
The United States (47K tons) was the main destination for commercial printing exports from China, with a 28% share of total exports. Moreover, commercial printing exports to the United States exceeded the volume sent to the second major destination, the UK (11K tons), fourfold. The Netherlands (6.2K tons) ranked third in terms of total exports with a 3.8% share.
From June 2022 to June 2023, the average monthly rate of growth in terms of volume to the United States totaled -1.4%. Exports to the other major destinations recorded the following average monthly rates of exports growth: the UK (-1.6% per month) and the Netherlands (-0.4% per month).
In value terms, the United States ($177M) remains the key foreign market for commercial printing exports from China, comprising 26% of total exports. The second position in the ranking was held by the UK ($40M), with a 6% share of total exports. It was followed by Australia, with a 4.7% share.
From June 2022 to June 2023, the average monthly rate of growth in terms of value to the United States stood at -2.0%. Exports to the other major destinations recorded the following average monthly rates of exports growth: the UK (-1.7% per month) and Australia (-1.0% per month).
-
1. INTRODUCTION
Making Data-Driven Decisions to Grow Your Business
- REPORT DESCRIPTION
- RESEARCH METHODOLOGY AND AI PLATFORM
- DATA-DRIVEN DECISIONS FOR YOUR BUSINESS
- GLOSSARY AND SPECIFIC TERMS
-
2. EXECUTIVE SUMMARY
A Quick Overview of Market Performance
- KEY FINDINGS
- MARKET TRENDS This Chapter is Available Only for the Professional Edition PRO
-
3. MARKET OVERVIEW
Understanding the Current State of The Market and Its Prospects
- MARKET SIZE
- MARKET STRUCTURE
- TRADE BALANCE
- PER CAPITA CONSUMPTION
- MARKET FORECAST TO 2030
-
4. MOST PROMISING PRODUCT
Finding New Products to Diversify Your Business
This Chapter is Available Only for the Professional Edition PRO- TOP PRODUCTS TO DIVERSIFY YOUR BUSINESS
- BEST-SELLING PRODUCTS
- MOST CONSUMED PRODUCT
- MOST TRADED PRODUCT
- MOST PROFITABLE PRODUCT FOR EXPORT
-
5. MOST PROMISING SUPPLYING COUNTRIES
Choosing the Best Countries to Establish Your Sustainable Supply Chain
This Chapter is Available Only for the Professional Edition PRO- TOP COUNTRIES TO SOURCE YOUR PRODUCT
- TOP PRODUCING COUNTRIES
- TOP EXPORTING COUNTRIES
- LOW-COST EXPORTING COUNTRIES
-
6. MOST PROMISING OVERSEAS MARKETS
Choosing the Best Countries to Boost Your Exports
This Chapter is Available Only for the Professional Edition PRO- TOP OVERSEAS MARKETS FOR EXPORTING YOUR PRODUCT
- TOP CONSUMING MARKETS
- UNSATURATED MARKETS
- TOP IMPORTING MARKETS
- MOST PROFITABLE MARKETS
7. PRODUCTION
The Latest Trends and Insights into The Industry
- PRODUCTION VOLUME AND VALUE
8. IMPORTS
The Largest Import Supplying Countries
- IMPORTS FROM 2012–2023
- IMPORTS BY COUNTRY
- IMPORT PRICES BY COUNTRY
9. EXPORTS
The Largest Destinations for Exports
- EXPORTS FROM 2012–2023
- EXPORTS BY COUNTRY
- EXPORT PRICES BY COUNTRY
-
10. PROFILES OF MAJOR PRODUCERS
The Largest Producers on The Market and Their Profiles
This Chapter is Available Only for the Professional Edition PRO -
LIST OF TABLES
- Key Findings In 2023
- Market Volume, In Physical Terms, 2012–2023
- Market Value, 2012–2023
- Per Capita Consumption In 2012-2023
- Imports, In Physical Terms, By Country, 2012–2023
- Imports, In Value Terms, By Country, 2012–2023
- Import Prices, By Country Of Origin, 2012–2023
- Exports, In Physical Terms, By Country, 2012–2023
- Exports, In Value Terms, By Country, 2012–2023
- Export Prices, By Country Of Destination, 2012–2023
-
LIST OF FIGURES
- Market Volume, In Physical Terms, 2012–2023
- Market Value, 2012–2023
- Market Structure – Domestic Supply vs. Imports, In Physical Terms, 2012-2023
- Market Structure – Domestic Supply vs. Imports, In Value Terms, 2012-2023
- Trade Balance, In Physical Terms, 2012-2023
- Trade Balance, In Value Terms, 2012-2023
- Per Capita Consumption, 2012-2023
- Market Volume Forecast to 2030
- Market Value Forecast to 2030
- Products: Market Size And Growth, By Type
- Products: Average Per Capita Consumption, By Type
- Products: Exports And Growth, By Type
- Products: Export Prices And Growth, By Type
- Production Volume And Growth
- Exports And Growth
- Export Prices And Growth
- Market Size And Growth
- Per Capita Consumption
- Imports And Growth
- Import Prices
- Production, In Physical Terms, 2012–2023
- Production, In Value Terms, 2012–2023
- Imports, In Physical Terms, 2012–2023
- Imports, In Value Terms, 2012–2023
- Imports, In Physical Terms, By Country, 2023
- Imports, In Physical Terms, By Country, 2012–2023
- Imports, In Value Terms, By Country, 2012–2023
- Import Prices, By Country Of Origin, 2012–2023
- Exports, In Physical Terms, 2012–2023
- Exports, In Value Terms, 2012–2023
- Exports, In Physical Terms, By Country, 2023
- Exports, In Physical Terms, By Country, 2012–2023
- Exports, In Value Terms, By Country, 2012–2023
- Export Prices, By Country Of Destination, 2012–2023


