Germany - Tractors - Market Analysis, Forecast, Size, Trends and Insights
Get instant access to more than 2 million reports, dashboards, and datasets on the IndexBox Platform.
View PricingAverage Price for German Tractors Drops by 5% to $71,888 per Unit
Germany Tractor Export Price in May 2023
In May 2023, the tractor price amounted to $71,888 per unit (FOB, Germany), reducing by -4.6% against the previous month. Over the last twelve months, it increased at an average monthly rate of +1.3%. The most prominent rate of growth was recorded in April 2023 an increase of 17% m-o-m. As a result, the export price reached the peak level of $75.4M per thousand units, and then contracted slightly in the following month.
There were significant differences in the average prices for the major external markets. In May 2023, the country with the highest price was France ($86,585 per unit), while the average price for exports to Poland ($30,177 per unit) was amongst the lowest.
From May 2022 to May 2023, the most notable rate of growth in terms of prices was recorded for supplies to Spain (+2.8%), while the prices for the other major destinations experienced more modest paces of growth.
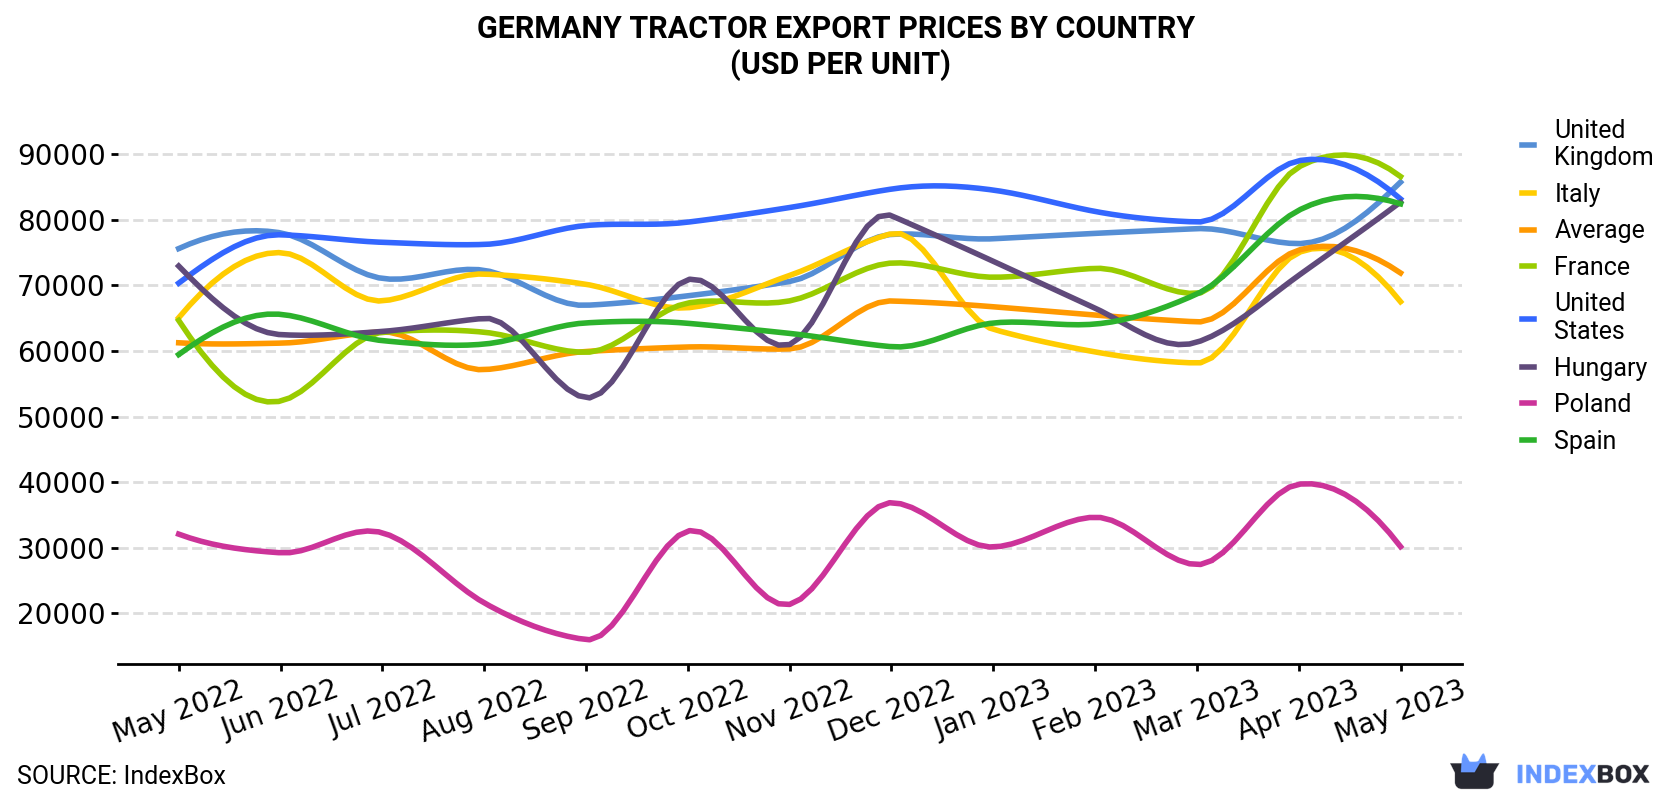
| COUNTRY | Export Price of Tractor in Germany (USD per unit) | ||||||||||||
|---|---|---|---|---|---|---|---|---|---|---|---|---|---|
| May 2022 | Jun 2022 | Jul 2022 | Aug 2022 | Sep 2022 | Oct 2022 | Nov 2022 | Dec 2022 | Jan 2023 | Feb 2023 | Mar 2023 | Apr 2023 | May 2023 | |
| France | 64,653 | 52,352 | 62,832 | 62,853 | 59,794 | 67,300 | 67,629 | 73,397 | 71,236 | 72,588 | 68,765 | 88,039 | 86,585 |
| United Kingdom | 75,598 | 78,000 | 71,049 | 72,293 | 66,958 | 68,405 | 70,588 | 77,765 | 77,101 | 77,919 | 78,638 | 76,360 | 85,730 |
| United States | 70,332 | 77,703 | 76,561 | 76,236 | 79,117 | 79,633 | 81,860 | 84,670 | 84,517 | 81,263 | 79,659 | 88,991 | 83,171 |
| Hungary | 72,943 | 62,486 | 62,975 | 64,971 | 52,854 | 70,876 | 60,972 | 80,615 | 73,664 | 66,520 | 61,324 | 71,512 | 82,692 |
| Spain | 59,452 | 65,581 | 61,574 | 61,046 | 64,275 | 64,213 | 62,674 | 60,648 | 64,260 | 64,097 | 68,681 | 81,438 | 82,421 |
| Italy | 65,057 | 74,988 | 67,629 | 71,720 | 70,156 | 66,580 | 71,509 | 77,880 | 63,297 | 59,854 | 58,157 | 75,003 | 67,507 |
| Poland | 32,080 | 29,233 | 32,290 | 21,604 | 15,992 | 32,558 | 21,366 | 36,877 | 30,114 | 34,660 | 27,426 | 39,685 | 30,177 |
| Average | 61,243 | 61,190 | 62,903 | 57,144 | 59,920 | 60,602 | 60,311 | 67,616 | 66,732 | 65,473 | 64,429 | 75,377 | 71,888 |
Germany Tractor Exports
In May 2023, the amount of tractors exported from Germany shrank rapidly to 10K units, waning by -18.9% against April 2023 figures. In general, exports saw a relatively flat trend pattern. The growth pace was the most rapid in October 2022 with an increase of 81% against the previous month. As a result, the exports reached the peak of 14K units. From November 2022 to May 2023, the growth of the exports remained at a lower figure.
In value terms, tractor exports declined markedly to $753M (IndexBox estimates) in May 2023. Over the period under review, exports, however, saw a relatively flat trend pattern. The growth pace was the most rapid in October 2022 with an increase of 83% m-o-m. Over the period under review, the exports hit record highs at 973M units in April 2023, and then declined remarkably in the following month.
Germany Tractor Exports by Type
Agricultural and forestry tractors (10K units) was the largest type of tractor exported from Germany, accounting for a 95% share of total exports. It was followed by crawler tractors (300 units), with a 2.9% share of total exports.
From May 2022 to May 2023, the average monthly rate of growth in terms of the volume of export of agricultural and forestry tractors stood at -1.1%. With regard to the other exported products, the following average monthly rates of growth were recorded: crawler tractors (+1.9% per month) and pedestrian-controlled tractors (+23.8% per month).
In value terms, agricultural and forestry tractors ($739M) remains the largest type of tractor exported from Germany, comprising 98% of total exports. The second position in the ranking was held by crawler tractors ($14M), with a 1.8% share of total exports.
From May 2022 to May 2023, the average monthly growth rate of the export volume of agricultural and forestry tractors was relatively modest. With regard to the other exported products, the following average monthly rates of growth were recorded: crawler tractors (+0.8% per month) and pedestrian-controlled tractors (+18.3% per month).
Germany Tractor Exports by Country
The United States (2.1K units), France (1.4K units) and Poland (1.2K units) were the main destinations of tractor exports from Germany, with a combined 45% share of total exports. These countries were followed by the UK, Turkey, Italy, Spain, Austria, the Netherlands, Australia, Hungary, Lithuania and Norway, which together accounted for a further 32%.
From May 2022 to May 2023, the most notable rate of growth in terms of shipments, amongst the main countries of destination, was attained by Turkey (with a CAGR of +12.7%), while the other leaders experienced more modest paces of growth.
In value terms, the largest markets for tractor exported from Germany were the United States ($177M), France ($122M) and the UK ($50M), with a combined 46% share of total exports. These countries were followed by Poland, Italy, Spain, Turkey, the Netherlands, Austria, Hungary, Australia, Lithuania and Norway, which together accounted for a further 31%.
Turkey, with a CAGR of +13.1%, recorded the highest growth rate of the value of exports, among the main countries of destination over the period under review, while shipments for the other leaders experienced more modest paces of growth.
This report provides an in-depth analysis of the tractor market in Germany. Within it, you will discover the latest data on market trends and opportunities by country, consumption, production and price developments, as well as the global trade (imports and exports). The forecast exhibits the market prospects through 2030.
Product coverage:
- Prodcom 28301000 - Pedestrian-controlled tractors
- Prodcom 28302100 - New agricultural and forestry tractors, wheeled, of an engine power . .37 kW
- Prodcom 28302200 - New agricultural and forestry tractors, wheeled, of an engine power > .37 kW but . .59 kW (excluding pedestrian-controlled tractors)
- Prodcom 28302330 - New agricultural and forestry tractors, wheeled, of an engine power > .59 kW but . .75 kW (excluding pedestrian-controlled tractors)
- Prodcom 28302350 - New agricultural and forestry tractors, wheeled, of an engine power > .75 kW but . .90 kW (excluding pedestrian-controlled tractors)
- Prodcom 28302370 - New agricultural and forestry tractors, wheeled, of an engine power > .90 kW (excluding pedestrian-controlled tractors)
- Prodcom 28302390 - New tractors excluding agricultural/forestry tractors, wheeled, p edestrian-controlled tractors - road tractors for semi-trailers, t rack-laying tractors -tractors used on railway platforms
- Prodcom 28925000 - (Crawler tractors) Track-laying tractors
- Prodcom 29104300 - Road tractors for semi-trailers
Country coverage:
- Germany
Data coverage:
- Market volume and value
- Per Capita consumption
- Forecast of the market dynamics in the medium term
- Trade (exports and imports) in Germany
- Export and import prices
- Market trends, drivers and restraints
- Key market players and their profiles
Reasons to buy this report:
- Take advantage of the latest data
- Find deeper insights into current market developments
- Discover vital success factors affecting the market
This report is designed for manufacturers, distributors, importers, and wholesalers, as well as for investors, consultants and advisors.
In this report, you can find information that helps you to make informed decisions on the following issues:
- How to diversify your business and benefit from new market opportunities
- How to load your idle production capacity
- How to boost your sales on overseas markets
- How to increase your profit margins
- How to make your supply chain more sustainable
- How to reduce your production and supply chain costs
- How to outsource production to other countries
- How to prepare your business for global expansion
While doing this research, we combine the accumulated expertise of our analysts and the capabilities of artificial intelligence. The AI-based platform, developed by our data scientists, constitutes the key working tool for business analysts, empowering them to discover deep insights and ideas from the marketing data.
-
1. INTRODUCTION
Making Data-Driven Decisions to Grow Your Business
- REPORT DESCRIPTION
- RESEARCH METHODOLOGY AND AI PLATFORM
- DATA-DRIVEN DECISIONS FOR YOUR BUSINESS
- GLOSSARY AND SPECIFIC TERMS
-
2. EXECUTIVE SUMMARY
A Quick Overview of Market Performance
- KEY FINDINGS
- MARKET TRENDS This Chapter is Available Only for the Professional Edition PRO
-
3. MARKET OVERVIEW
Understanding the Current State of The Market and Its Prospects
- MARKET SIZE
- MARKET STRUCTURE
- TRADE BALANCE
- PER CAPITA CONSUMPTION
- MARKET FORECAST TO 2030
-
4. MOST PROMISING PRODUCT
Finding New Products to Diversify Your Business
This Chapter is Available Only for the Professional Edition PRO- TOP PRODUCTS TO DIVERSIFY YOUR BUSINESS
- BEST-SELLING PRODUCTS
- MOST CONSUMED PRODUCT
- MOST TRADED PRODUCT
- MOST PROFITABLE PRODUCT FOR EXPORT
-
5. MOST PROMISING SUPPLYING COUNTRIES
Choosing the Best Countries to Establish Your Sustainable Supply Chain
This Chapter is Available Only for the Professional Edition PRO- TOP COUNTRIES TO SOURCE YOUR PRODUCT
- TOP PRODUCING COUNTRIES
- TOP EXPORTING COUNTRIES
- LOW-COST EXPORTING COUNTRIES
-
6. MOST PROMISING OVERSEAS MARKETS
Choosing the Best Countries to Boost Your Exports
This Chapter is Available Only for the Professional Edition PRO- TOP OVERSEAS MARKETS FOR EXPORTING YOUR PRODUCT
- TOP CONSUMING MARKETS
- UNSATURATED MARKETS
- TOP IMPORTING MARKETS
- MOST PROFITABLE MARKETS
7. PRODUCTION
The Latest Trends and Insights into The Industry
- PRODUCTION VOLUME AND VALUE
8. IMPORTS
The Largest Import Supplying Countries
- IMPORTS FROM 2012–2023
- IMPORTS BY COUNTRY
- IMPORT PRICES BY COUNTRY
9. EXPORTS
The Largest Destinations for Exports
- EXPORTS FROM 2012–2023
- EXPORTS BY COUNTRY
- EXPORT PRICES BY COUNTRY
-
10. PROFILES OF MAJOR PRODUCERS
The Largest Producers on The Market and Their Profiles
This Chapter is Available Only for the Professional Edition PRO -
LIST OF TABLES
- Key Findings In 2023
- Market Volume, In Physical Terms, 2012–2023
- Market Value, 2012–2023
- Per Capita Consumption In 2012-2023
- Imports, In Physical Terms, By Country, 2012–2023
- Imports, In Value Terms, By Country, 2012–2023
- Import Prices, By Country Of Origin, 2012–2023
- Exports, In Physical Terms, By Country, 2012–2023
- Exports, In Value Terms, By Country, 2012–2023
- Export Prices, By Country Of Destination, 2012–2023
-
LIST OF FIGURES
- Market Volume, In Physical Terms, 2012–2023
- Market Value, 2012–2023
- Market Structure – Domestic Supply vs. Imports, In Physical Terms, 2012-2023
- Market Structure – Domestic Supply vs. Imports, In Value Terms, 2012-2023
- Trade Balance, In Physical Terms, 2012-2023
- Trade Balance, In Value Terms, 2012-2023
- Per Capita Consumption, 2012-2023
- Market Volume Forecast to 2030
- Market Value Forecast to 2030
- Products: Market Size And Growth, By Type
- Products: Average Per Capita Consumption, By Type
- Products: Exports And Growth, By Type
- Products: Export Prices And Growth, By Type
- Production Volume And Growth
- Exports And Growth
- Export Prices And Growth
- Market Size And Growth
- Per Capita Consumption
- Imports And Growth
- Import Prices
- Production, In Physical Terms, 2012–2023
- Production, In Value Terms, 2012–2023
- Imports, In Physical Terms, 2012–2023
- Imports, In Value Terms, 2012–2023
- Imports, In Physical Terms, By Country, 2023
- Imports, In Physical Terms, By Country, 2012–2023
- Imports, In Value Terms, By Country, 2012–2023
- Import Prices, By Country Of Origin, 2012–2023
- Exports, In Physical Terms, 2012–2023
- Exports, In Value Terms, 2012–2023
- Exports, In Physical Terms, By Country, 2023
- Exports, In Physical Terms, By Country, 2012–2023
- Exports, In Value Terms, By Country, 2012–2023
- Export Prices, By Country Of Destination, 2012–2023


