
Hong Kong SAR, China - Veneer Sheets And Sheets For Plywood And Other Wood Sawn Lengthwise - Market Analysis, Forecast, Size, Trends and Insights
Get instant access to more than 2 million reports, dashboards, and datasets on the IndexBox Platform.
View PricingRecord-breaking Surge in Price of Veneer Sheets in Hong Kong, Reaching $11.1 per Square Meter After Steady Growth for Four Consecutive Months.
Hong Kong Veneer Sheet Import Price in May 2023
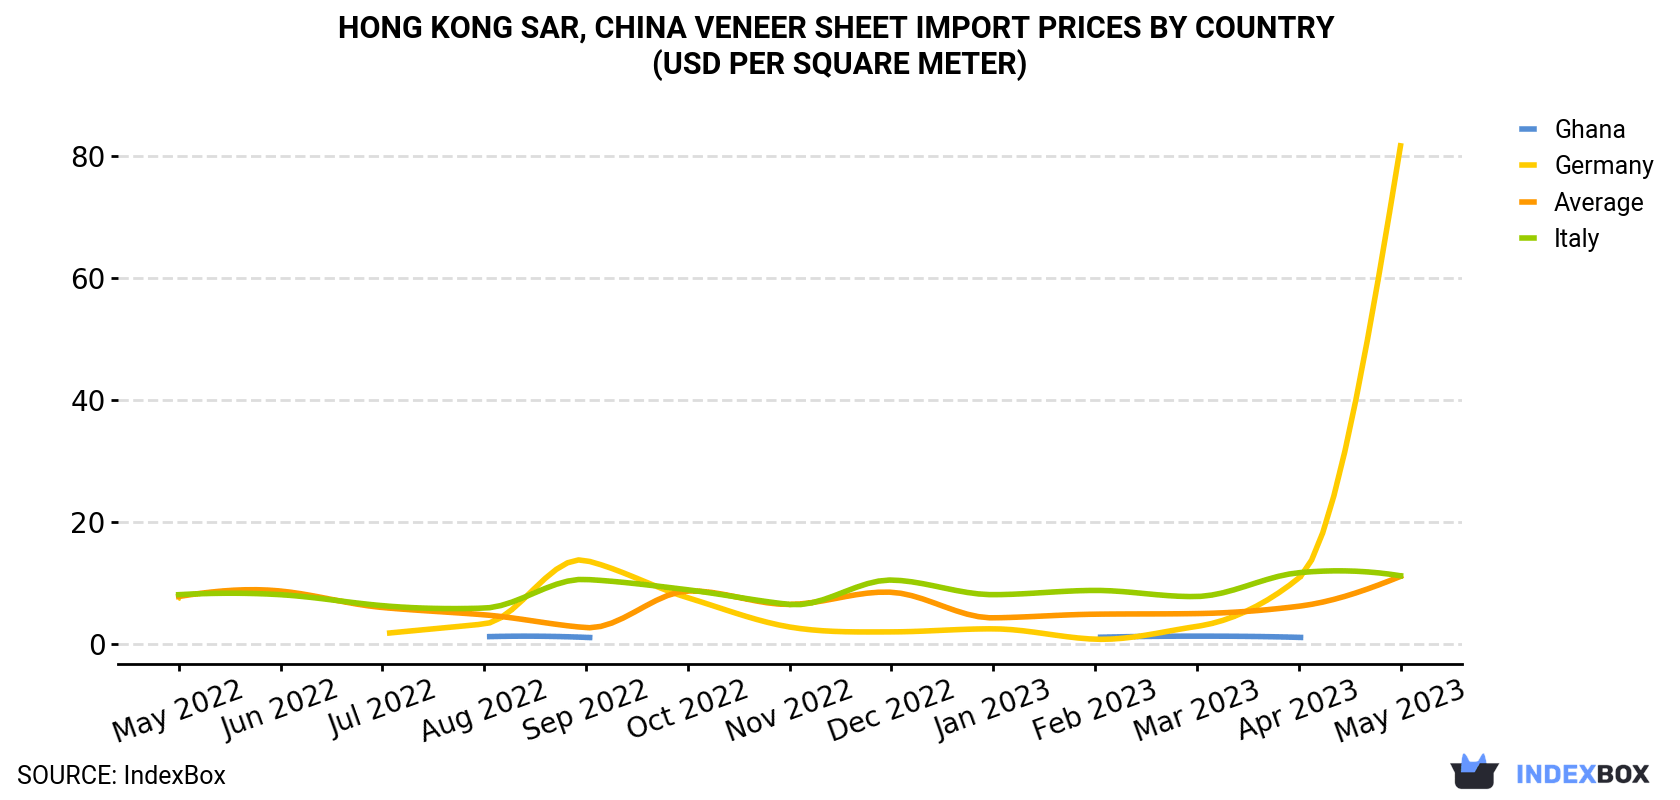
In May 2023, the veneer sheet price stood at $11.1 per square meter (CIF, Hong Kong), rising by 78% against the previous month. Overall, the import price posted a moderate increase. The pace of growth was the most pronounced in October 2022 when the average import price increased by 224% month-to-month. The import price peaked in May 2023.
There were significant differences in the average prices amongst the major supplying countries. In May 2023, the country with the highest price was Germany ($81.7 per square meter), while the price for Italy amounted to $11.2 per square meter.
From May 2022 to May 2023, the most notable rate of growth in terms of prices was attained by Germany (+22.2%), while the prices for the other major suppliers experienced mixed trend patterns.
| COUNTRY | Import Price of Veneer Sheet in Hong Kong (USD per square meter) | ||||||||||||
|---|---|---|---|---|---|---|---|---|---|---|---|---|---|
| May 2022 | Jun 2022 | Jul 2022 | Aug 2022 | Sep 2022 | Oct 2022 | Nov 2022 | Dec 2022 | Jan 2023 | Feb 2023 | Mar 2023 | Apr 2023 | May 2023 | |
| Germany | 7.4 | N/A | 1.7 | 3.3 | 13.7 | 7.6 | 2.8 | 2.0 | 2.5 | 0.8 | 2.9 | 10.8 | 81.7 |
| Italy | 8.1 | 8.1 | 6.3 | 5.9 | 10.6 | 8.9 | 6.5 | 10.5 | 8.1 | 8.8 | 7.8 | 11.7 | 11.2 |
| Ghana | N/A | N/A | N/A | 1.2 | 1.1 | N/A | N/A | N/A | N/A | 1.1 | 1.3 | 1.1 | N/A |
| Average | 7.8 | 8.7 | 6.0 | 4.8 | 2.7 | 8.7 | 6.5 | 8.5 | 4.3 | 4.9 | 5.0 | 6.2 | 11.1 |
Hong Kong Veneer Sheet Imports
In May 2023, approximately 34K square meters of veneer sheets and sheets for plywood and other wood sawn lengthwise were imported into Hong Kong; shrinking by -48.9% compared with the previous month. Overall, imports saw a slight decrease. The most prominent rate of growth was recorded in November 2022 with an increase of 331% m-o-m. As a result, imports reached the peak of 107K square meters. From December 2022 to May 2023, the growth of imports failed to regain momentum.
In value terms, veneer sheet imports dropped to $374K (IndexBox estimates) in May 2023. In general, imports, however, posted modest growth. The pace of growth appeared the most rapid in February 2023 with an increase of 341% against the previous month. Over the period under review, imports reached the peak figure at 694K square meters in November 2022; however, from December 2022 to May 2023, imports failed to regain momentum.
Hong Kong Veneer Sheet Imports by Country
In May 2023, Italy (31K square meters) was the main veneer sheet supplier to Hong Kong, accounting for a 92% share of total imports. Moreover, veneer sheet imports from Italy exceeded the figures recorded by the second-largest supplier, China (2.1K square meters), more than tenfold. The United Arab Emirates (668 square meters) ranked third in terms of total imports with a 2% share.
From May 2022 to May 2023, the average monthly rate of growth in terms of volume from Italy was relatively modest. The remaining supplying countries recorded the following average monthly rates of imports growth: China (-2.4% per month) and the United Arab Emirates (0.0% per month).
In value terms, Italy ($347K) constituted the largest supplier of veneer sheet to Hong Kong, comprising 93% of total imports. The second position in the ranking was held by China ($21K), with a 5.5% share of total imports. It was followed by the United Arab Emirates, with a 1.4% share.
From May 2022 to May 2023, the average monthly rate of growth in terms of value from Italy amounted to +3.5%. The remaining supplying countries recorded the following average monthly rates of imports growth: China (+8.1% per month) and the United Arab Emirates (0.0% per month).
This report provides an in-depth analysis of the veneer sheet market in Hong Kong SAR, China. Within it, you will discover the latest data on market trends and opportunities by country, consumption, production and price developments, as well as the global trade (imports and exports). The forecast exhibits the market prospects through 2030.
Product coverage:
- Prodcom 16212113 - Veneer sheets, sheets for plywood and other wood sawn lengthwise, sliced/peeled, thickness . 6 mm and end-jointed, p laned/sanded/small boards for the manufacture of pencils
- Prodcom 16212118 - Coniferous and tropical wood veneer sheets and sheets for plywood, sawn lengthwise, sliced or peeled, of a thickness . 6 mm excluding end-jointed, planed or sanded
Country coverage:
- Hong Kong SAR
Data coverage:
- Market volume and value
- Per Capita consumption
- Forecast of the market dynamics in the medium term
- Trade (exports and imports) in Hong Kong SAR, China
- Export and import prices
- Market trends, drivers and restraints
- Key market players and their profiles
Reasons to buy this report:
- Take advantage of the latest data
- Find deeper insights into current market developments
- Discover vital success factors affecting the market
This report is designed for manufacturers, distributors, importers, and wholesalers, as well as for investors, consultants and advisors.
In this report, you can find information that helps you to make informed decisions on the following issues:
- How to diversify your business and benefit from new market opportunities
- How to load your idle production capacity
- How to boost your sales on overseas markets
- How to increase your profit margins
- How to make your supply chain more sustainable
- How to reduce your production and supply chain costs
- How to outsource production to other countries
- How to prepare your business for global expansion
While doing this research, we combine the accumulated expertise of our analysts and the capabilities of artificial intelligence. The AI-based platform, developed by our data scientists, constitutes the key working tool for business analysts, empowering them to discover deep insights and ideas from the marketing data.
-
1. INTRODUCTION
Making Data-Driven Decisions to Grow Your Business
- REPORT DESCRIPTION
- RESEARCH METHODOLOGY AND AI PLATFORM
- DATA-DRIVEN DECISIONS FOR YOUR BUSINESS
- GLOSSARY AND SPECIFIC TERMS
-
2. EXECUTIVE SUMMARY
A Quick Overview of Market Performance
- KEY FINDINGS
- MARKET TRENDS This Chapter is Available Only for the Professional Edition PRO
-
3. MARKET OVERVIEW
Understanding the Current State of The Market and Its Prospects
- MARKET SIZE
- MARKET STRUCTURE
- TRADE BALANCE
- PER CAPITA CONSUMPTION
- MARKET FORECAST TO 2030
-
4. MOST PROMISING PRODUCT
Finding New Products to Diversify Your Business
This Chapter is Available Only for the Professional Edition PRO- TOP PRODUCTS TO DIVERSIFY YOUR BUSINESS
- BEST-SELLING PRODUCTS
- MOST CONSUMED PRODUCT
- MOST TRADED PRODUCT
- MOST PROFITABLE PRODUCT FOR EXPORT
-
5. MOST PROMISING SUPPLYING COUNTRIES
Choosing the Best Countries to Establish Your Sustainable Supply Chain
This Chapter is Available Only for the Professional Edition PRO- TOP COUNTRIES TO SOURCE YOUR PRODUCT
- TOP PRODUCING COUNTRIES
- TOP EXPORTING COUNTRIES
- LOW-COST EXPORTING COUNTRIES
-
6. MOST PROMISING OVERSEAS MARKETS
Choosing the Best Countries to Boost Your Exports
This Chapter is Available Only for the Professional Edition PRO- TOP OVERSEAS MARKETS FOR EXPORTING YOUR PRODUCT
- TOP CONSUMING MARKETS
- UNSATURATED MARKETS
- TOP IMPORTING MARKETS
- MOST PROFITABLE MARKETS
7. PRODUCTION
The Latest Trends and Insights into The Industry
- PRODUCTION VOLUME AND VALUE
8. IMPORTS
The Largest Import Supplying Countries
- IMPORTS FROM 2012–2023
- IMPORTS BY COUNTRY
- IMPORT PRICES BY COUNTRY
9. EXPORTS
The Largest Destinations for Exports
- EXPORTS FROM 2012–2023
- EXPORTS BY COUNTRY
- EXPORT PRICES BY COUNTRY
-
10. PROFILES OF MAJOR PRODUCERS
The Largest Producers on The Market and Their Profiles
This Chapter is Available Only for the Professional Edition PRO -
LIST OF TABLES
- Key Findings In 2023
- Market Volume, In Physical Terms, 2012–2023
- Market Value, 2012–2023
- Per Capita Consumption In 2012-2023
- Imports, In Physical Terms, By Country, 2012–2023
- Imports, In Value Terms, By Country, 2012–2023
- Import Prices, By Country Of Origin, 2012–2023
- Exports, In Physical Terms, By Country, 2012–2023
- Exports, In Value Terms, By Country, 2012–2023
- Export Prices, By Country Of Destination, 2012–2023
-
LIST OF FIGURES
- Market Volume, In Physical Terms, 2012–2023
- Market Value, 2012–2023
- Market Structure – Domestic Supply vs. Imports, In Physical Terms, 2012-2023
- Market Structure – Domestic Supply vs. Imports, In Value Terms, 2012-2023
- Trade Balance, In Physical Terms, 2012-2023
- Trade Balance, In Value Terms, 2012-2023
- Per Capita Consumption, 2012-2023
- Market Volume Forecast to 2030
- Market Value Forecast to 2030
- Products: Market Size And Growth, By Type
- Products: Average Per Capita Consumption, By Type
- Products: Exports And Growth, By Type
- Products: Export Prices And Growth, By Type
- Production Volume And Growth
- Exports And Growth
- Export Prices And Growth
- Market Size And Growth
- Per Capita Consumption
- Imports And Growth
- Import Prices
- Production, In Physical Terms, 2012–2023
- Production, In Value Terms, 2012–2023
- Imports, In Physical Terms, 2012–2023
- Imports, In Value Terms, 2012–2023
- Imports, In Physical Terms, By Country, 2023
- Imports, In Physical Terms, By Country, 2012–2023
- Imports, In Value Terms, By Country, 2012–2023
- Import Prices, By Country Of Origin, 2012–2023
- Exports, In Physical Terms, 2012–2023
- Exports, In Value Terms, 2012–2023
- Exports, In Physical Terms, By Country, 2023
- Exports, In Physical Terms, By Country, 2012–2023
- Exports, In Value Terms, By Country, 2012–2023
- Export Prices, By Country Of Destination, 2012–2023


