
Italy - Uncooked Pasta - Market Analysis, Forecast, Size, Trends And Insights
Get instant access to more than 2 million reports, dashboards, and datasets on the IndexBox Platform.
View PricingItaly's Uncooked Pasta Exports Reach a Record High of $3.5 Billion in 2023
Italy Uncooked Pasta Exports
In 2023, uncooked pasta exports from Italy dropped slightly to 2M tons, waning by -2.6% compared with the previous year. The total export volume increased at an average annual rate of +1.3% from 2013 to 2023; the trend pattern remained relatively stable, with only minor fluctuations being observed in certain years. The pace of growth appeared the most rapid in 2020 when exports increased by 14%. As a result, the exports attained the peak of 2.3M tons. From 2021 to 2023, the growth of the exports failed to regain momentum.
In value terms, uncooked pasta exports expanded notably to $3.5B (IndexBox estimates) in 2023. Over the period under review, total exports indicated a notable increase from 2013 to 2023: its value increased at an average annual rate of +4.3% over the last decade. The trend pattern, however, indicated some noticeable fluctuations being recorded throughout the analyzed period. Based on 2023 figures, exports increased by +75.8% against 2016 indices. The most prominent rate of growth was recorded in 2020 with an increase of 21%. Over the period under review, the exports hit record highs in 2023 and are expected to retain growth in the immediate term.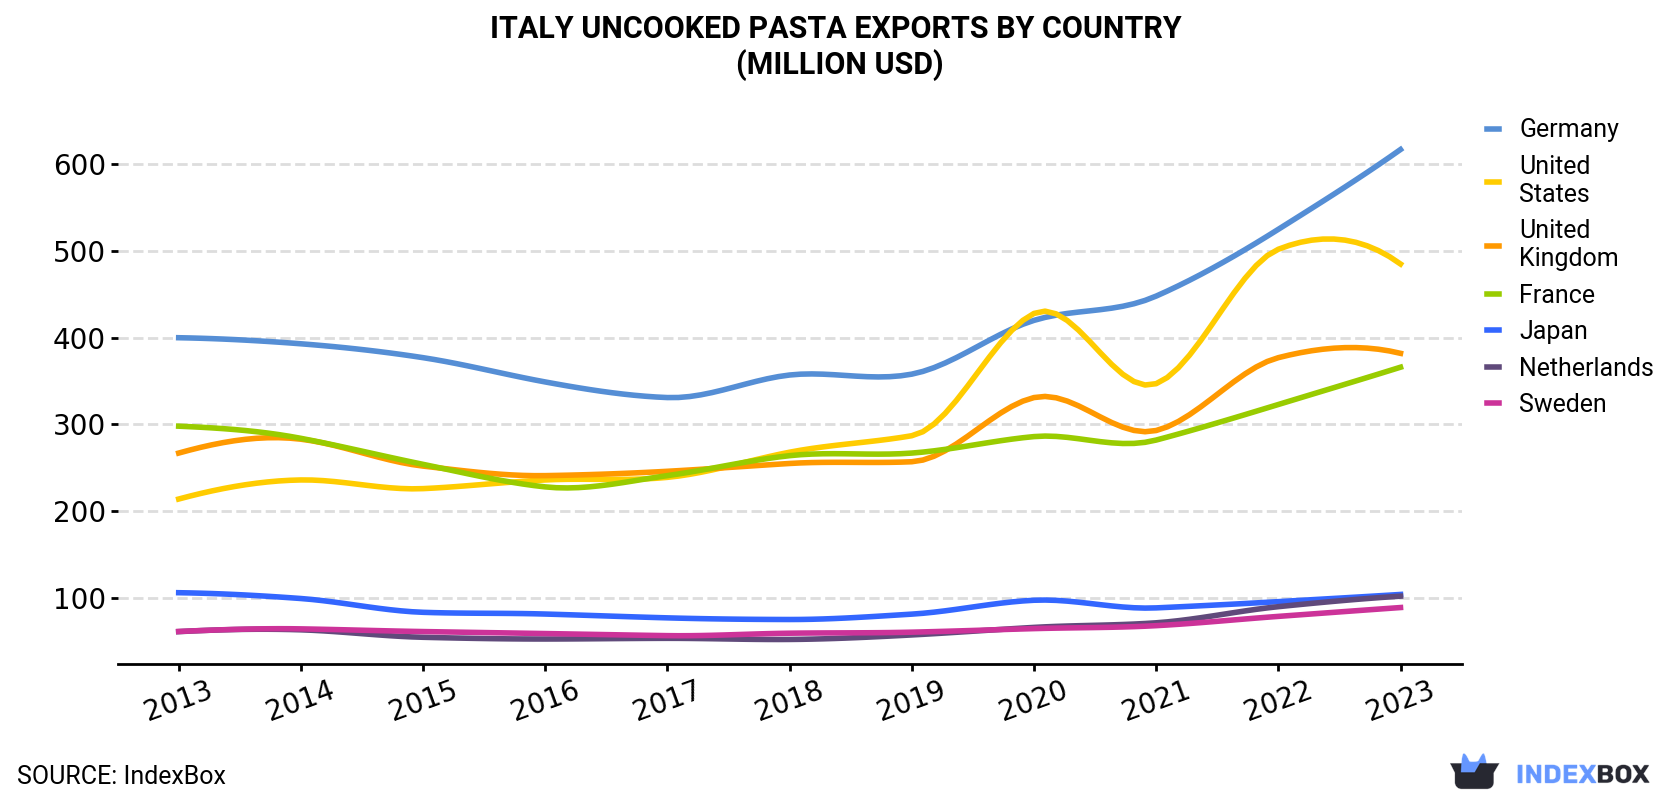
| COUNTRY | Export Value of Uncooked Pasta in Italy (million USD) | ||||||||||
|---|---|---|---|---|---|---|---|---|---|---|---|
| 2013 | 2014 | 2015 | 2016 | 2017 | 2018 | 2019 | 2020 | 2021 | 2022 | 2023 | |
| Germany | 400 | 393 | 377 | 349 | 331 | 357 | 358 | 420 | 448 | 525 | 617 |
| United States | 214 | 236 | 226 | 236 | 239 | 268 | 287 | 428 | 347 | 502 | 485 |
| United Kingdom | 267 | 283 | 252 | 241 | 246 | 255 | 257 | 331 | 293 | 377 | 382 |
| France | 298 | 284 | 254 | 228 | 241 | 264 | 267 | 286 | 282 | 323 | 366 |
| Japan | 106 | 99.3 | 83.4 | 81.4 | 77.0 | 75.1 | 81.3 | 97.3 | 88.5 | 95.7 | 104 |
| Netherlands | 61.1 | 63.2 | 54.6 | 52.6 | 53.4 | 52.1 | 57.3 | 66.0 | 71.3 | 89.9 | 102 |
| Sweden | 61.3 | 64.3 | 61.2 | 58.9 | 56.5 | 59.3 | 60.5 | 64.6 | 68.0 | 78.7 | 88.9 |
| Others | 857 | 861 | 727 | 718 | 756 | 800 | 843 | 982 | 1,036 | 1,194 | 1,311 |
| Total | 2,265 | 2,284 | 2,035 | 1,966 | 1,998 | 2,132 | 2,210 | 2,674 | 2,633 | 3,185 | 3,456 |
Exports by Country
Germany (397K tons), the UK (245K tons) and the United States (230K tons) were the main destinations of uncooked pasta exports from Italy, with a combined 43% share of total exports.
From 2013 to 2023, the most notable rate of growth in terms of shipments, amongst the main countries of destination, was attained by the United States (with a CAGR of +5.4%), while the other leaders experienced more modest paces of growth.
In value terms, the largest markets for uncooked pasta exported from Italy were Germany ($617M), the United States ($485M) and the UK ($382M), with a combined 43% share of total exports.
the United States, with a CAGR of +8.5%, recorded the highest rates of growth with regard to the value of exports, in terms of the main countries of destination over the period under review, while shipments for the other leaders experienced more modest paces of growth.
Exports by Type
Uncooked pasta not containing eggs (1.9M tons) was the largest type of uncooked pasta exported from Italy, with a 95% share of total exports. Moreover, uncooked pasta not containing eggs exceeded the volume of the second product type, uncooked pasta containing eggs (92K tons), more than tenfold.
From 2013 to 2023, the average annual growth rate of the volume of uncooked pasta not containing eggs exports totaled +1.3%.
In value terms, uncooked pasta not containing eggs ($3.2B) remains the largest type of uncooked pasta exported from Italy, comprising 92% of total exports. The second position in the ranking was held by uncooked pasta containing eggs ($276M), with an 8% share of total exports.
From 2013 to 2023, the average annual rate of growth in terms of the value of uncooked pasta not containing eggs exports totaled +4.4%.
Export Prices by Country
In 2023, the uncooked pasta price stood at $1,700 per ton (FOB, Italy), increasing by 11% against the previous year. Over the last decade, it increased at an average annual rate of +3.0%. The pace of growth appeared the most rapid in 2022 when the average export price increased by 15%. The export price peaked in 2023 and is likely to continue growth in the near future.
There were significant differences in the average prices for the major export markets. In 2023, amid the top suppliers, the country with the highest price was Canada ($2,275 per ton), while the average price for exports to Saudi Arabia ($1,297 per ton) was amongst the lowest.
From 2013 to 2023, the most notable rate of growth in terms of prices was recorded for supplies to Austria (+3.5%), while the prices for the other major destinations experienced more modest paces of growth.
This report provides an in-depth analysis of the uncooked pasta market in Italy. Within it, you will discover the latest data on market trends and opportunities by country, consumption, production and price developments, as well as the global trade (imports and exports). The forecast exhibits the market prospects through 2030.
Product coverage:
- Prodcom 10731130 - Uncooked pasta, containing eggs (excluding stuffed or otherwise prepared)
- Prodcom 10731150 - Uncooked pasta (excluding containing eggs, stuffed or otherwise prepared)
Country coverage:
- Italy
Data coverage:
- Market volume and value
- Per Capita consumption
- Forecast of the market dynamics in the medium term
- Trade (exports and imports) in Italy
- Export and import prices
- Market trends, drivers and restraints
- Key market players and their profiles
Reasons to buy this report:
- Take advantage of the latest data
- Find deeper insights into current market developments
- Discover vital success factors affecting the market
This report is designed for manufacturers, distributors, importers, and wholesalers, as well as for investors, consultants and advisors.
In this report, you can find information that helps you to make informed decisions on the following issues:
- How to diversify your business and benefit from new market opportunities
- How to load your idle production capacity
- How to boost your sales on overseas markets
- How to increase your profit margins
- How to make your supply chain more sustainable
- How to reduce your production and supply chain costs
- How to outsource production to other countries
- How to prepare your business for global expansion
While doing this research, we combine the accumulated expertise of our analysts and the capabilities of artificial intelligence. The AI-based platform, developed by our data scientists, constitutes the key working tool for business analysts, empowering them to discover deep insights and ideas from the marketing data.
-
1. INTRODUCTION
Making Data-Driven Decisions to Grow Your Business
- REPORT DESCRIPTION
- RESEARCH METHODOLOGY AND AI PLATFORM
- DATA-DRIVEN DECISIONS FOR YOUR BUSINESS
- GLOSSARY AND SPECIFIC TERMS
-
2. EXECUTIVE SUMMARY
A Quick Overview of Market Performance
- KEY FINDINGS
- MARKET TRENDS This Chapter is Available Only for the Professional Edition PRO
-
3. MARKET OVERVIEW
Understanding the Current State of The Market and Its Prospects
- MARKET SIZE
- MARKET STRUCTURE
- TRADE BALANCE
- PER CAPITA CONSUMPTION
- MARKET FORECAST TO 2030
-
4. MOST PROMISING PRODUCT
Finding New Products to Diversify Your Business
This Chapter is Available Only for the Professional Edition PRO- TOP PRODUCTS TO DIVERSIFY YOUR BUSINESS
- BEST-SELLING PRODUCTS
- MOST CONSUMED PRODUCT
- MOST TRADED PRODUCT
- MOST PROFITABLE PRODUCT FOR EXPORT
-
5. MOST PROMISING SUPPLYING COUNTRIES
Choosing the Best Countries to Establish Your Sustainable Supply Chain
This Chapter is Available Only for the Professional Edition PRO- TOP COUNTRIES TO SOURCE YOUR PRODUCT
- TOP PRODUCING COUNTRIES
- TOP EXPORTING COUNTRIES
- LOW-COST EXPORTING COUNTRIES
-
6. MOST PROMISING OVERSEAS MARKETS
Choosing the Best Countries to Boost Your Exports
This Chapter is Available Only for the Professional Edition PRO- TOP OVERSEAS MARKETS FOR EXPORTING YOUR PRODUCT
- TOP CONSUMING MARKETS
- UNSATURATED MARKETS
- TOP IMPORTING MARKETS
- MOST PROFITABLE MARKETS
7. PRODUCTION
The Latest Trends and Insights into The Industry
- PRODUCTION VOLUME AND VALUE
8. IMPORTS
The Largest Import Supplying Countries
- IMPORTS FROM 2012–2023
- IMPORTS BY COUNTRY
- IMPORT PRICES BY COUNTRY
9. EXPORTS
The Largest Destinations for Exports
- EXPORTS FROM 2012–2023
- EXPORTS BY COUNTRY
- EXPORT PRICES BY COUNTRY
-
10. PROFILES OF MAJOR PRODUCERS
The Largest Producers on The Market and Their Profiles
This Chapter is Available Only for the Professional Edition PRO -
LIST OF TABLES
- Key Findings In 2023
- Market Volume, In Physical Terms, 2012–2023
- Market Value, 2012–2023
- Per Capita Consumption In 2012-2023
- Imports, In Physical Terms, By Country, 2012–2023
- Imports, In Value Terms, By Country, 2012–2023
- Import Prices, By Country Of Origin, 2012–2023
- Exports, In Physical Terms, By Country, 2012–2023
- Exports, In Value Terms, By Country, 2012–2023
- Export Prices, By Country Of Destination, 2012–2023
-
LIST OF FIGURES
- Market Volume, In Physical Terms, 2012–2023
- Market Value, 2012–2023
- Market Structure – Domestic Supply vs. Imports, In Physical Terms, 2012-2023
- Market Structure – Domestic Supply vs. Imports, In Value Terms, 2012-2023
- Trade Balance, In Physical Terms, 2012-2023
- Trade Balance, In Value Terms, 2012-2023
- Per Capita Consumption, 2012-2023
- Market Volume Forecast to 2030
- Market Value Forecast to 2030
- Products: Market Size And Growth, By Type
- Products: Average Per Capita Consumption, By Type
- Products: Exports And Growth, By Type
- Products: Export Prices And Growth, By Type
- Production Volume And Growth
- Exports And Growth
- Export Prices And Growth
- Market Size And Growth
- Per Capita Consumption
- Imports And Growth
- Import Prices
- Production, In Physical Terms, 2012–2023
- Production, In Value Terms, 2012–2023
- Imports, In Physical Terms, 2012–2023
- Imports, In Value Terms, 2012–2023
- Imports, In Physical Terms, By Country, 2023
- Imports, In Physical Terms, By Country, 2012–2023
- Imports, In Value Terms, By Country, 2012–2023
- Import Prices, By Country Of Origin, 2012–2023
- Exports, In Physical Terms, 2012–2023
- Exports, In Value Terms, 2012–2023
- Exports, In Physical Terms, By Country, 2023
- Exports, In Physical Terms, By Country, 2012–2023
- Exports, In Value Terms, By Country, 2012–2023
- Export Prices, By Country Of Destination, 2012–2023


