
World - Textile Hosepiping And Similar Textile Tubing - Market Analysis, Forecast, Size, Trends And Insights
Get instant access to more than 2 million reports, dashboards, and datasets on the IndexBox Platform.
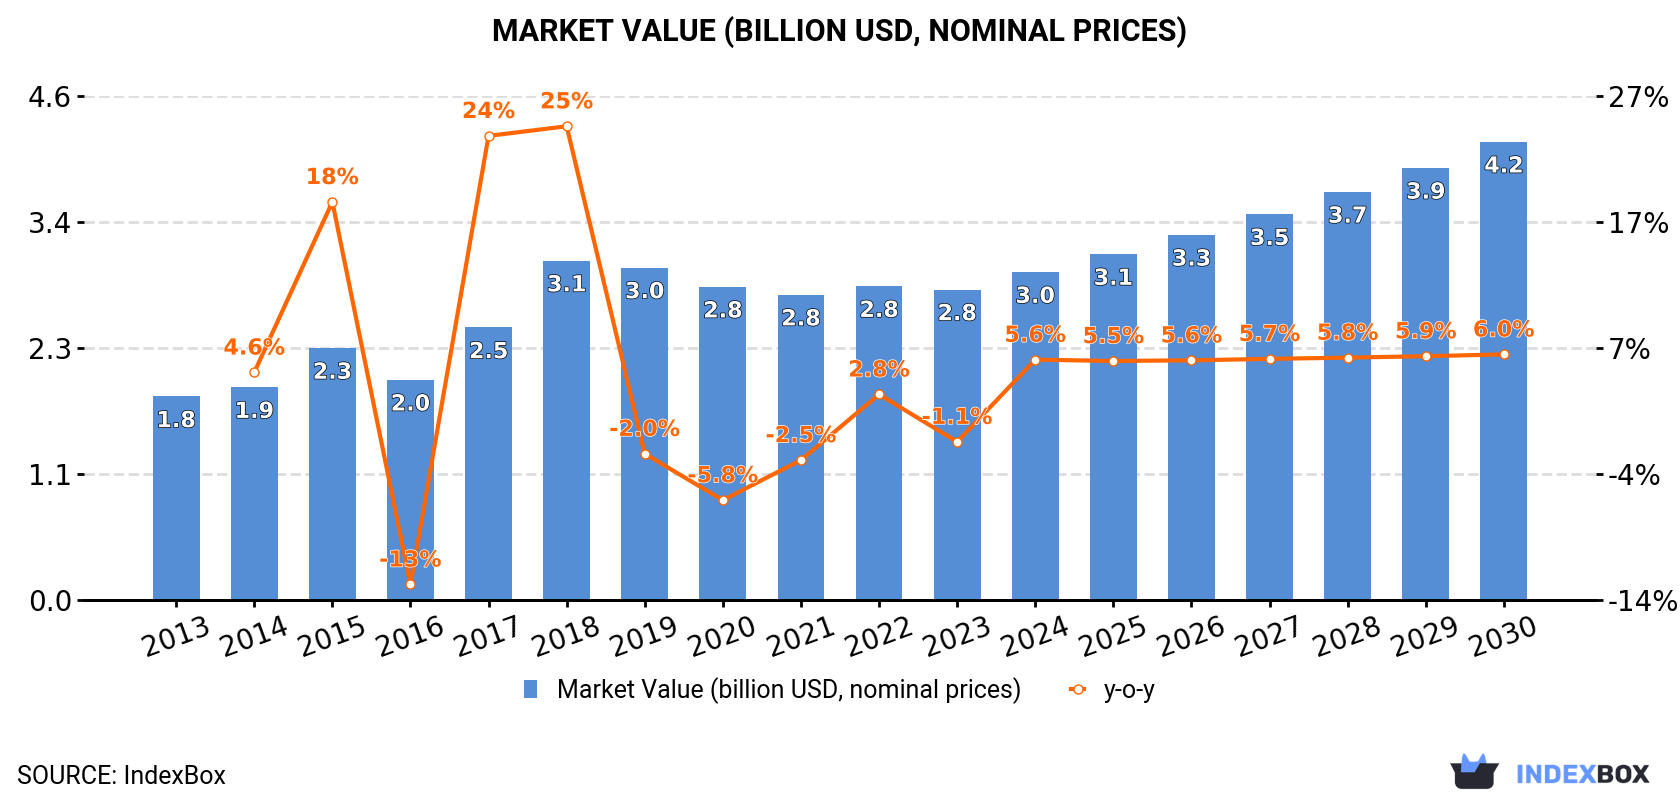
View PricingGlobal Textile Hosepiping Market Expected to Reach $4.2B by 2030 with a 4.0% CAGR in Volume
IndexBox has just published a new report: World - Textile Hosepiping And Similar Textile Tubing - Market Analysis, Forecast, Size, Trends And Insights.
The article discusses the projected growth of the global textile hosepiping and tubing market from 2023 to 2030, with an expected increase in consumption volume and market value. Key insights include trends in consumption, production, imports, and exports, with China emerging as a dominant player in both production and exports. The United States, Japan, and India were highlighted as significant players in market value, with notable growth rates in certain countries like Nigeria. Overall, the article provides a comprehensive overview of the global textile hosepiping and tubing market, emphasizing key growth factors and market dynamics.
Market Forecast
Market Forecast
Driven by increasing demand for textile hosepiping and similar textile tubing worldwide, the market is expected to continue an upward consumption trend over the next seven-year period. Market performance is forecast to decelerate, expanding with an anticipated CAGR of +4.0% for the period from 2023 to 2030, which is projected to bring the market volume to 462K tons by the end of 2030.
In value terms, the market is forecast to increase with an anticipated CAGR of +5.7% for the period from 2023 to 2030, which is projected to bring the market value to $4.2B (in nominal prices) by the end of 2030.
Consumption
Consumption
Global textile tubing consumption contracted modestly to 352K tons in 2023, therefore, remained relatively stable against the year before. Overall, the total consumption indicated a buoyant increase from 2013 to 2023: its volume increased at an average annual rate of +5.3% over the last decade. The trend pattern, however, indicated some noticeable fluctuations being recorded throughout the analyzed period. Based on 2023 figures, consumption decreased by +0.4% against 2021 indices. Over the period under review, global consumption hit record highs at 380K tons in 2018; however, from 2019 to 2023, consumption failed to regain momentum.
The global textile tubing market revenue declined slightly to $2.8B in 2023, remaining stable against the previous year. This figure reflects the total revenues of producers and importers (excluding logistics costs, retail marketing costs, and retailers' margins, which will be included in the final consumer price). Over the period under review, the total consumption indicated notable growth from 2013 to 2023: its value increased at an average annual rate of +4.3% over the last decade. The trend pattern, however, indicated some noticeable fluctuations being recorded throughout the analyzed period. Based on 2023 figures, consumption increased by +1.7% against 2021 indices. As a result, consumption attained the peak level of $3.1B. From 2019 to 2023, the growth of the global market remained at a lower figure.
Consumption By Country
The country with the largest volume of textile tubing consumption was China (58K tons), comprising approx. 17% of total volume. Moreover, textile tubing consumption in China exceeded the figures recorded by the second-largest consumer, the United States (28K tons), twofold. India (25K tons) ranked third in terms of total consumption with a 7% share.
From 2013 to 2023, the average annual growth rate of volume in China amounted to +8.0%. In the other countries, the average annual rates were as follows: the United States (+2.6% per year) and India (+7.9% per year).
In value terms, the United States ($245M), Japan ($227M) and China ($214M) were the countries with the highest levels of market value in 2023, together comprising 24% of the global market. Indonesia, India, Brazil, Mexico, Pakistan, Nigeria, Russia, Bangladesh, the UK and Turkey lagged somewhat behind, together comprising a further 30%.
Nigeria, with a CAGR of +14.5%, recorded the highest rates of growth with regard to market size in terms of the main consuming countries over the period under review, while market for the other global leaders experienced more modest paces of growth.
The countries with the highest levels of textile tubing per capita consumption in 2023 were the UK (107 kg per 1000 persons), Russia (86 kg per 1000 persons) and the United States (84 kg per 1000 persons).
From 2013 to 2023, the biggest increases were recorded for Nigeria (with a CAGR of +11.9%), while consumption for the other global leaders experienced more modest paces of growth.
Production
Production
In 2023, global textile tubing production fell to 366K tons, stabilizing at the year before. Over the period under review, the total production indicated temperate growth from 2013 to 2023: its volume increased at an average annual rate of +4.8% over the last decade. The trend pattern, however, indicated some noticeable fluctuations being recorded throughout the analyzed period. Based on 2023 figures, production decreased by +0.7% against 2021 indices. The most prominent rate of growth was recorded in 2017 with an increase of 31% against the previous year. Over the period under review, global production reached the peak volume at 393K tons in 2018; however, from 2019 to 2023, production remained at a lower figure.
In value terms, textile tubing production reduced slightly to $2.8B in 2023 estimated in export price. In general, the total production indicated a temperate increase from 2013 to 2023: its value increased at an average annual rate of +4.1% over the last decade. The trend pattern, however, indicated some noticeable fluctuations being recorded throughout the analyzed period. Based on 2023 figures, production decreased by +0.7% against 2021 indices. The most prominent rate of growth was recorded in 2018 when the production volume increased by 27% against the previous year. As a result, production attained the peak level of $3.2B. From 2019 to 2023, global production growth failed to regain momentum.
Production By Country
The country with the largest volume of textile tubing production was China (98K tons), accounting for 27% of total volume. Moreover, textile tubing production in China exceeded the figures recorded by the second-largest producer, the United States (29K tons), threefold. India (22K tons) ranked third in terms of total production with a 6% share.
From 2013 to 2023, the average annual rate of growth in terms of volume in China stood at +5.1%. In the other countries, the average annual rates were as follows: the United States (+2.0% per year) and India (+6.8% per year).
Imports
Imports
In 2023, approx. 49K tons of textile hosepiping and similar textile tubing were imported worldwide; which is down by -3.8% compared with 2022. The total import volume increased at an average annual rate of +1.5% over the period from 2013 to 2023; however, the trend pattern indicated some noticeable fluctuations being recorded in certain years. The most prominent rate of growth was recorded in 2017 when imports increased by 20%. Over the period under review, global imports reached the peak figure at 51K tons in 2022, and then fell modestly in the following year.
In value terms, textile tubing imports rose modestly to $362M in 2023. Overall, imports, however, saw a relatively flat trend pattern. The most prominent rate of growth was recorded in 2021 when imports increased by 16%. Over the period under review, global imports reached the maximum in 2023 and are likely to continue growth in years to come.
Imports By Country
The United States (3.8K tons), India (3.4K tons), Italy (2.5K tons), Poland (2.2K tons), Russia (2.2K tons), Brazil (2.1K tons), the Netherlands (1.7K tons), Germany (1.5K tons), Japan (1.4K tons), Taiwan (Chinese) (1.3K tons), Canada (1.3K tons) and the United Arab Emirates (1.3K tons) represented roughly 50% of total imports in 2023. Denmark (869 tons) held a minor share of total imports.
From 2013 to 2023, the biggest increases were recorded for India (with a CAGR of +19.5%), while purchases for the other global leaders experienced more modest paces of growth.
In value terms, the United States ($51M) constitutes the largest market for imported textile hosepiping and similar textile tubing worldwide, comprising 14% of global imports. The second position in the ranking was taken by Japan ($16M), with a 4.3% share of global imports. It was followed by Italy, with a 4.1% share.
In the United States, textile tubing imports remained relatively stable over the period from 2013-2023. The remaining importing countries recorded the following average annual rates of imports growth: Japan (+1.6% per year) and Italy (+10.5% per year).
Import Prices By Country
In 2023, the average textile tubing import price amounted to $7,338 per ton, with an increase of 6.5% against the previous year. Overall, the import price, however, recorded a relatively flat trend pattern. The pace of growth appeared the most rapid in 2021 an increase of 17%. Over the period under review, average import prices reached the peak figure at $8,228 per ton in 2014; however, from 2015 to 2023, import prices remained at a lower figure.
There were significant differences in the average prices amongst the major importing countries. In 2023, amid the top importers, the country with the highest price was the United States ($13,245 per ton), while India ($2,039 per ton) was amongst the lowest.
From 2013 to 2023, the most notable rate of growth in terms of prices was attained by Germany (+0.9%), while the other global leaders experienced more modest paces of growth.
Exports
Exports
In 2023, global exports of textile hosepiping and similar textile tubing amounted to 64K tons, almost unchanged from the year before. Overall, exports recorded a relatively flat trend pattern. The most prominent rate of growth was recorded in 2017 when exports increased by 14% against the previous year. The global exports peaked at 69K tons in 2014; however, from 2015 to 2023, the exports remained at a lower figure.
In value terms, textile tubing exports rose to $401M in 2023. In general, exports, however, showed a relatively flat trend pattern. The most prominent rate of growth was recorded in 2021 when exports increased by 13% against the previous year. The global exports peaked at $483M in 2014; however, from 2015 to 2023, the exports remained at a lower figure.
Exports By Country
China dominates exports structure, amounting to 40K tons, which was near 63% of total exports in 2023. The United States (4.2K tons) held a 6.6% share (based on physical terms) of total exports, which put it in second place, followed by France (4.6%). Germany (2.7K tons), Canada (1.6K tons), Spain (1.4K tons), Norway (1.4K tons), Poland (1.3K tons) and the Netherlands (1.1K tons) followed a long way behind the leaders.
From 2013 to 2023, average annual rates of growth with regard to textile tubing exports from China stood at +1.9%. At the same time, Poland (+25.8%), the Netherlands (+17.4%) and Norway (+5.2%) displayed positive paces of growth. Moreover, Poland emerged as the fastest-growing exporter exported in the world, with a CAGR of +25.8% from 2013-2023. Germany experienced a relatively flat trend pattern. By contrast, Canada (-2.1%), the United States (-2.8%), France (-4.1%) and Spain (-6.8%) illustrated a downward trend over the same period. While the share of China (+9.1 p.p.) and Poland (+1.8 p.p.) increased significantly in terms of the global exports from 2013-2023, the share of the United States (-2.5 p.p.), Spain (-2.5 p.p.) and France (-2.6 p.p.) displayed negative dynamics. The shares of the other countries remained relatively stable throughout the analyzed period.
In value terms, China ($142M) remains the largest textile tubing supplier worldwide, comprising 35% of global exports. The second position in the ranking was taken by Germany ($50M), with a 13% share of global exports. It was followed by the United States, with an 8.2% share.
From 2013 to 2023, the average annual growth rate of value in China stood at +1.6%. The remaining exporting countries recorded the following average annual rates of exports growth: Germany (+0.1% per year) and the United States (-5.5% per year).
Export Prices By Country
In 2023, the average textile tubing export price amounted to $6,284 per ton, with an increase of 2% against the previous year. Overall, the export price, however, continues to indicate a slight shrinkage. The pace of growth appeared the most rapid in 2021 an increase of 5.4%. The global export price peaked at $7,346 per ton in 2015; however, from 2016 to 2023, the export prices remained at a lower figure.
There were significant differences in the average prices amongst the major exporting countries. In 2023, amid the top suppliers, the country with the highest price was Germany ($18,421 per ton), while China ($3,540 per ton) was amongst the lowest.
From 2013 to 2023, the most notable rate of growth in terms of prices was attained by France (+1.3%), while the other global leaders experienced more modest paces of growth.
This report provides an in-depth analysis of the global textile tubing market. Within it, you will discover the latest data on market trends and opportunities by country, consumption, production and price developments, as well as the global trade (imports and exports). The forecast exhibits the market prospects through 2030.
Product coverage:
- Prodcom 13961620 - Textile hosepiping and similar textile tubing, whether or not impregnated or coated, with or without lining, armour or accessories of other materials
Country coverage:
Worldwide - the report contains statistical data for 200 countries and includes detailed profiles of the 50 largest consuming countries:
- USA
- China
- Japan
- Germany
- United Kingdom
- France
- Brazil
- Italy
- Russian Federation
- India
- Canada
- Australia
- Republic of Korea
- Spain
- Mexico
- Indonesia
- Netherlands
- Turkey
- Saudi Arabia
- Switzerland
- Sweden
- Nigeria
- Poland
- Belgium
- Argentina
- Norway
- Austria
- Thailand
- United Arab Emirates
- Colombia
- Denmark
- South Africa
- Malaysia
- Israel
- Singapore
- Egypt
- Philippines
- Finland
- Chile
- Ireland
- Pakistan
- Greece
- Portugal
- Kazakhstan
- Algeria
- Czech Republic
- Qatar
- Peru
- Romania
- Vietnam
+ the largest producing countries
Data coverage:
- Global market volume and value
- Per Capita consumption
- Forecast of the market dynamics in the medium term
- Global production, split by region and country
- Global trade (exports and imports)
- Export and import prices
- Market trends, drivers and restraints
- Key market players and their profiles
Reasons to buy this report:
- Take advantage of the latest data
- Find deeper insights into current market developments
- Discover vital success factors affecting the market
This report is designed for manufacturers, distributors, importers, and wholesalers, as well as for investors, consultants and advisors.
In this report, you can find information that helps you to make informed decisions on the following issues:
- How to diversify your business and benefit from new market opportunities
- How to load your idle production capacity
- How to boost your sales on overseas markets
- How to increase your profit margins
- How to make your supply chain more sustainable
- How to reduce your production and supply chain costs
- How to outsource production to other countries
- How to prepare your business for global expansion
While doing this research, we combine the accumulated expertise of our analysts and the capabilities of artificial intelligence. The AI-based platform, developed by our data scientists, constitutes the key working tool for business analysts, empowering them to discover deep insights and ideas from the marketing data.
-
1. INTRODUCTION
Making Data-Driven Decisions to Grow Your Business
- REPORT DESCRIPTION
- RESEARCH METHODOLOGY AND AI PLATFORM
- DATA-DRIVEN DECISIONS FOR YOUR BUSINESS
- GLOSSARY AND SPECIFIC TERMS
-
2. EXECUTIVE SUMMARY
A Quick Overview of Market Performance
- KEY FINDINGS
- MARKET TRENDS This Chapter is Available Only for the Professional Edition PRO
-
3. MARKET OVERVIEW
Understanding the Current State of The Market and Its Prospects
- MARKET SIZE
- CONSUMPTION BY COUNTRY
- MARKET FORECAST TO 2030
-
4. MOST PROMISING PRODUCT
Finding New Products to Diversify Your Business
This Chapter is Available Only for the Professional Edition PRO- TOP PRODUCTS TO DIVERSIFY YOUR BUSINESS
- BEST-SELLING PRODUCTS
- MOST CONSUMED PRODUCT
- MOST TRADED PRODUCT
- MOST PROFITABLE PRODUCT FOR EXPORT
-
5. MOST PROMISING SUPPLYING COUNTRIES
Choosing the Best Countries to Establish Your Sustainable Supply Chain
This Chapter is Available Only for the Professional Edition PRO- TOP COUNTRIES TO SOURCE YOUR PRODUCT
- TOP PRODUCING COUNTRIES
- TOP EXPORTING COUNTRIES
- LOW-COST EXPORTING COUNTRIES
-
6. MOST PROMISING OVERSEAS MARKETS
Choosing the Best Countries to Boost Your Exports
This Chapter is Available Only for the Professional Edition PRO- TOP OVERSEAS MARKETS FOR EXPORTING YOUR PRODUCT
- TOP CONSUMING MARKETS
- UNSATURATED MARKETS
- TOP IMPORTING MARKETS
- MOST PROFITABLE MARKETS
7. GLOBAL PRODUCTION
The Latest Trends and Insights into The Industry
- PRODUCTION VOLUME AND VALUE
- PRODUCTION BY COUNTRY
8. GLOBAL IMPORTS
The Largest Importers on The Market and How They Succeed
- IMPORTS FROM 2012–2023
- IMPORTS BY COUNTRY
- IMPORT PRICES BY COUNTRY
9. GLOBAL EXPORTS
The Largest Exporters on The Market and How They Succeed
- EXPORTS FROM 2012–2023
- EXPORTS BY COUNTRY
- EXPORT PRICES BY COUNTRY
-
10. PROFILES OF MAJOR PRODUCERS
The Largest Producers on The Market and Their Profiles
This Chapter is Available Only for the Professional Edition PRO -
11. COUNTRY PROFILES
The Largest Markets And Their Profiles
This Chapter is Available Only for the Professional Edition PRO- United States
- China
- Japan
- Germany
- United Kingdom
- France
- Brazil
- Italy
- Russian Federation
- India
- Canada
- Australia
- Republic of Korea
- Spain
- Mexico
- Indonesia
- Netherlands
- Turkey
- Saudi Arabia
- Switzerland
- Sweden
- Nigeria
- Poland
- Belgium
- Argentina
- Norway
- Austria
- Thailand
- United Arab Emirates
- Colombia
- Denmark
- South Africa
- Malaysia
- Israel
- Singapore
- Egypt
- Philippines
- Finland
- Chile
- Ireland
- Pakistan
- Greece
- Portugal
- Kazakhstan
- Algeria
- Czech Republic
- Qatar
- Peru
- Romania
- Vietnam
-
LIST OF TABLES
- Key Findings In 2023
- Market Volume, In Physical Terms, 2012–2023
- Market Value, 2012–2023
- Per Capita Consumption, By Country, 2018–2023
- Production, In Physical Terms, By Country, 2012–2023
- Imports, In Physical Terms, By Country, 2012–2023
- Imports, In Value Terms, By Country, 2012–2023
- Import Prices, By Country Of Destination, 2012–2023
- Exports, In Physical Terms, By Country, 2012–2023
- Exports, In Value Terms, By Country, 2012–2023
- Export Prices, By Country Of Origin, 2012–2023
-
LIST OF FIGURES
- Market Volume, In Physical Terms, 2012–2023
- Market Value, 2012–2023
- Consumption, By Country, 2023
- Market Volume Forecast to 2030
- Market Value Forecast to 2030
- Products: Market Size And Growth, By Type
- Products: Average Per Capita Consumption, By Type
- Products: Exports And Growth, By Type
- Products: Export Prices And Growth, By Type
- Production Volume And Growth
- Exports And Growth
- Export Prices And Growth
- Market Size And Growth
- Per Capita Consumption
- Imports And Growth
- Import Prices
- Production, In Physical Terms, 2012–2023
- Production, In Value Terms, 2012–2023
- Production, By Country, 2023
- Production, In Physical Terms, By Country, 2012–2023
- Imports, In Physical Terms, 2012–2023
- Imports, In Value Terms, 2012–2023
- Imports, In Physical Terms, By Country, 2023
- Imports, In Physical Terms, By Country, 2012–2023
- Imports, In Value Terms, By Country, 2012–2023
- Import Prices, By Country, 2012–2023
- Exports, In Physical Terms, 2012–2023
- Exports, In Value Terms, 2012–2023
- Exports, In Physical Terms, By Country, 2023
- Exports, In Physical Terms, By Country, 2012–2023
- Exports, In Value Terms, By Country, 2012–2023
- Export Prices, 2012–2023


