
U.S. Industrial Mold Market. Analysis And Forecast to 2030
Get instant access to more than 2 million reports, dashboards, and datasets on the IndexBox Platform.
View PricingImports of Molds in the United States Drop to $2.5 Billion in 2023
U.S. Industrial Mold Imports
After three years of growth, purchases abroad of industrial mold decreased by -5.9% to 78K tons in 2023. The total import volume increased at an average annual rate of +4.4% over the period from 2013 to 2023; however, the trend pattern indicated some noticeable fluctuations being recorded in certain years. The pace of growth appeared the most rapid in 2014 when imports increased by 30% against the previous year. Imports peaked at 83K tons in 2022, and then declined in the following year.
In value terms, industrial mold imports contracted modestly to $2.5B (IndexBox estimates) in 2023. The total import value increased at an average annual rate of +2.8% over the period from 2013 to 2023; however, the trend pattern indicated some noticeable fluctuations being recorded in certain years. The growth pace was the most rapid in 2017 with an increase of 17%. Imports peaked at $2.7B in 2018; however, from 2019 to 2023, imports remained at a lower figure.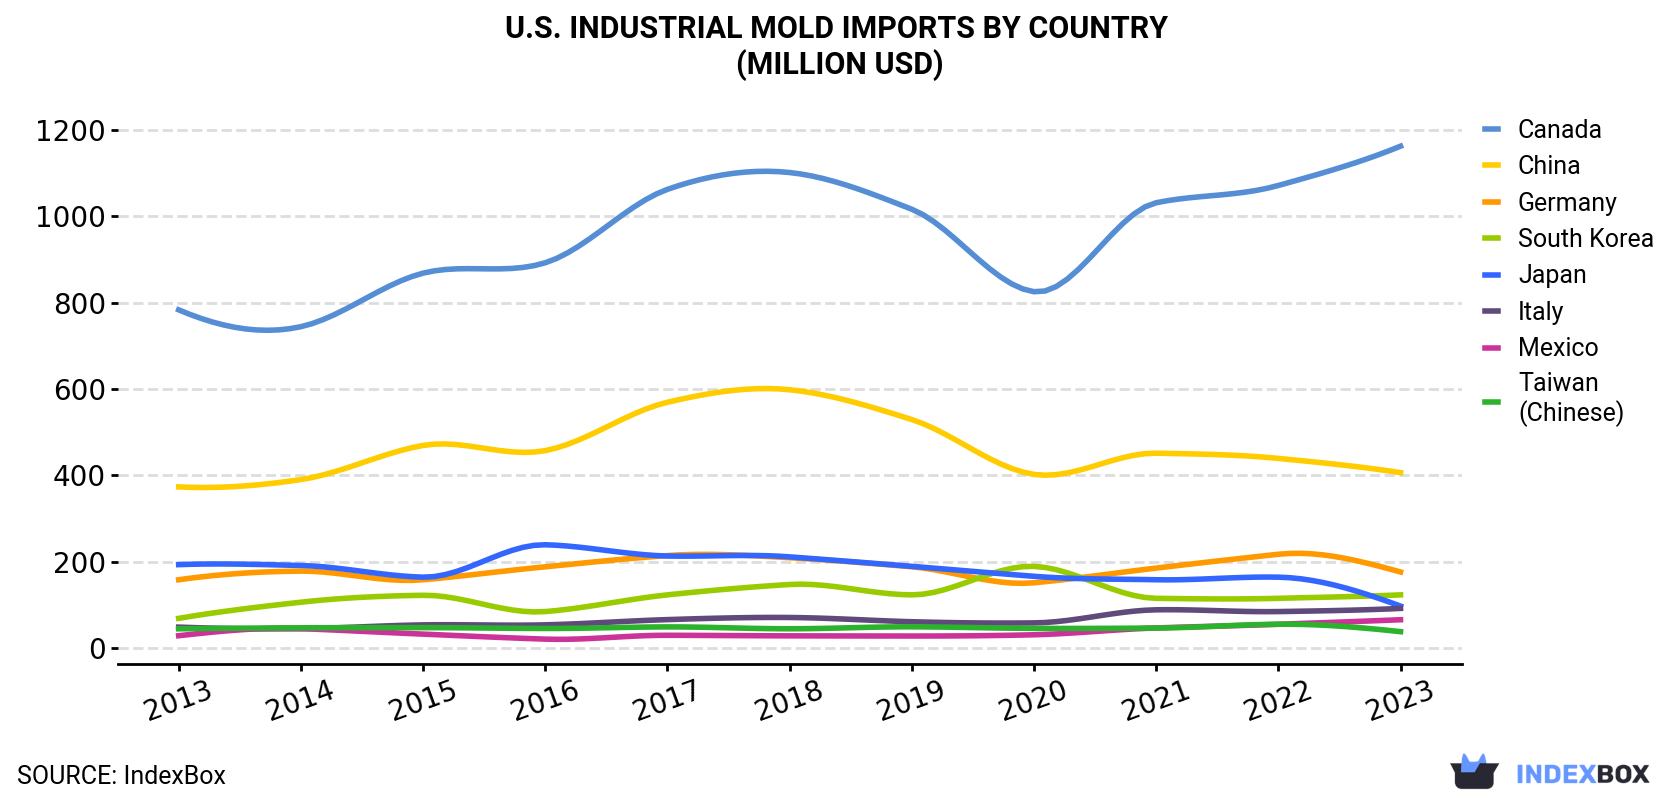
| COUNTRY | Import Value of Industrial Mold in U.S. (million USD) | ||||||||||
|---|---|---|---|---|---|---|---|---|---|---|---|
| 2013 | 2014 | 2015 | 2016 | 2017 | 2018 | 2019 | 2020 | 2021 | 2022 | 2023 | |
| Canada | 783 | 744 | 868 | 892 | 1,062 | 1,101 | 1,016 | 825 | 1,031 | 1,071 | 1,162 |
| China | 373 | 390 | 469 | 457 | 569 | 598 | 529 | 402 | 451 | 439 | 406 |
| Germany | 158 | 178 | 158 | 188 | 214 | 209 | 188 | 151 | 185 | 217 | 176 |
| South Korea | 68.6 | 106 | 122 | 84.3 | 123 | 147 | 123 | 189 | 115 | 115 | 123 |
| Japan | 193 | 191 | 164 | 239 | 213 | 211 | 189 | 166 | 158 | 164 | 97.0 |
| Italy | 48.3 | 44.7 | 53.5 | 53.6 | 65.7 | 70.6 | 60.8 | 58.1 | 88.4 | 84.3 | 91.6 |
| Mexico | 28.4 | 44.9 | 32.1 | 20.5 | 29.4 | 28.1 | 27.7 | 30.6 | 46.4 | 54.9 | 65.4 |
| Taiwan (Chinese) | 44.4 | 46.7 | 47.1 | 45.2 | 48.8 | 44.5 | 49.0 | 45.4 | 46.2 | 55.0 | 37.8 |
| Others | 229 | 240 | 228 | 226 | 255 | 290 | 267 | 290 | 352 | 406 | 388 |
| Total | 1,925 | 1,985 | 2,141 | 2,205 | 2,580 | 2,700 | 2,450 | 2,158 | 2,473 | 2,606 | 2,547 |
Imports by Country
In 2023, China (30K tons) constituted the largest industrial mold supplier to the United States, with a 39% share of total imports. Moreover, industrial mold imports from China exceeded the figures recorded by the second-largest supplier, Mexico (11K tons), threefold. Canada (8.3K tons) ranked third in terms of total imports with an 11% share.
From 2013 to 2023, the average annual growth rate of volume from China totaled +12.2%. The remaining supplying countries recorded the following average annual rates of imports growth: Mexico (+10.8% per year) and Canada (+7.8% per year).
In value terms, Canada ($1.2B) constituted the largest supplier of industrial mold to the United States, comprising 46% of total imports. The second position in the ranking was taken by China ($406M), with a 16% share of total imports. It was followed by Germany, with a 6.9% share.
From 2013 to 2023, the average annual growth rate of value from Canada amounted to +4.0%. The remaining supplying countries recorded the following average annual rates of imports growth: China (+0.9% per year) and Germany (+1.1% per year).
Import Prices by Country
In 2023, the industrial mold price amounted to $32,731 per ton (CIF, US), growing by 3.9% against the previous year. Overall, the import price, however, continues to indicate a slight contraction. The most prominent rate of growth was recorded in 2019 an increase of 18%. As a result, import price attained the peak level of $43,332 per ton. From 2020 to 2023, the average import prices remained at a lower figure.
Prices varied noticeably by country of origin: amid the top importers, the country with the highest price was Austria ($211,098 per ton), while the price for Mexico ($5,736 per ton) was amongst the lowest.
From 2013 to 2023, the most notable rate of growth in terms of prices was attained by Austria (+40.6%), while the prices for the other major suppliers experienced more modest paces of growth.
This report provides an in-depth analysis of the industrial mold market in the U.S.. Within it, you will discover the latest data on market trends and opportunities by country, consumption, production and price developments, as well as the global trade (imports and exports). The forecast exhibits the market prospects through 2030.
Product coverage:
- NAICS 333511 - Industrial mold manufacturing
Companies mentioned:
- Dme Company
- American Tool & Mold
- Hi-Tech Mold & Engineering
- Carlson Tool & Manufacturing Corp
- Delta Tooling Co.
- Nypromold
- Caco-Pacific Corporation
- Metro Mold & Design
- Franchino Mold & Engineering Company
- Tempcraft Corporation
- Ambrit Engineering Corporation
- Mold Masters Co.
- Quality Mold
- Custom Mold & Design
- Tom Smith Industries
- Nordson Xaloy Incorporated
- Mar-Lee Companies
- Seaway Plastics Engineering
- Century Tool & Gage Co.
- Fastek Products
- Industrial Molds
- Ronningen Research and Development Company
- Wirco
- Baker Aerospace Tooling & Machining
- Proper Polymers-Anderson
- Special Tool & Engineering
- Ross Mould
- Milacron Plastics Technologies Group
- Seurat Holdings Inc.
- International Mold Corporation
- Milacron Holdings Corp.
Country coverage:
- United States
Data coverage:
- Market volume and value
- Per Capita consumption
- Forecast of the market dynamics in the medium term
- Trade (exports and imports) in the U.S.
- Export and import prices
- Market trends, drivers and restraints
- Key market players and their profiles
Reasons to buy this report:
- Take advantage of the latest data
- Find deeper insights into current market developments
- Discover vital success factors affecting the market
This report is designed for manufacturers, distributors, importers, and wholesalers, as well as for investors, consultants and advisors.
In this report, you can find information that helps you to make informed decisions on the following issues:
- How to diversify your business and benefit from new market opportunities
- How to load your idle production capacity
- How to boost your sales on overseas markets
- How to increase your profit margins
- How to make your supply chain more sustainable
- How to reduce your production and supply chain costs
- How to outsource production to other countries
- How to prepare your business for global expansion
While doing this research, we combine the accumulated expertise of our analysts and the capabilities of artificial intelligence. The AI-based platform, developed by our data scientists, constitutes the key working tool for business analysts, empowering them to discover deep insights and ideas from the marketing data.
-
1. INTRODUCTION
Making Data-Driven Decisions to Grow Your Business
- REPORT DESCRIPTION
- RESEARCH METHODOLOGY AND AI PLATFORM
- DATA-DRIVEN DECISIONS FOR YOUR BUSINESS
- GLOSSARY AND SPECIFIC TERMS
-
2. EXECUTIVE SUMMARY
A Quick Overview of Market Performance
- KEY FINDINGS
- MARKET TRENDS This Chapter is Available Only for the Professional Edition PRO
-
3. MARKET OVERVIEW
Understanding the Current State of The Market and Its Prospects
- MARKET SIZE
- MARKET STRUCTURE
- TRADE BALANCE
- PER CAPITA CONSUMPTION
- MARKET FORECAST TO 2030
-
4. MOST PROMISING PRODUCT
Finding New Products to Diversify Your Business
This Chapter is Available Only for the Professional Edition PRO- TOP PRODUCTS TO DIVERSIFY YOUR BUSINESS
- BEST-SELLING PRODUCTS
- MOST CONSUMED PRODUCT
- MOST TRADED PRODUCT
- MOST PROFITABLE PRODUCT FOR EXPORT
-
5. MOST PROMISING SUPPLYING COUNTRIES
Choosing the Best Countries to Establish Your Sustainable Supply Chain
This Chapter is Available Only for the Professional Edition PRO- TOP COUNTRIES TO SOURCE YOUR PRODUCT
- TOP PRODUCING COUNTRIES
- TOP EXPORTING COUNTRIES
- LOW-COST EXPORTING COUNTRIES
-
6. MOST PROMISING OVERSEAS MARKETS
Choosing the Best Countries to Boost Your Exports
This Chapter is Available Only for the Professional Edition PRO- TOP OVERSEAS MARKETS FOR EXPORTING YOUR PRODUCT
- TOP CONSUMING MARKETS
- UNSATURATED MARKETS
- TOP IMPORTING MARKETS
- MOST PROFITABLE MARKETS
7. PRODUCTION
The Latest Trends and Insights into The Industry
- PRODUCTION VOLUME AND VALUE
8. IMPORTS
The Largest Import Supplying Countries
- IMPORTS FROM 2012–2023
- IMPORTS BY COUNTRY
- IMPORT PRICES BY COUNTRY
9. EXPORTS
The Largest Destinations for Exports
- EXPORTS FROM 2012–2023
- EXPORTS BY COUNTRY
- EXPORT PRICES BY COUNTRY
-
10. PROFILES OF MAJOR PRODUCERS
The Largest Producers on The Market and Their Profiles
This Chapter is Available Only for the Professional Edition PRO -
LIST OF TABLES
- Key Findings In 2023
- Market Volume, In Physical Terms, 2012–2023
- Market Value, 2012–2023
- Per Capita Consumption In 2012-2023
- Imports, In Physical Terms, By Country, 2012–2023
- Imports, In Value Terms, By Country, 2012–2023
- Import Prices, By Country Of Origin, 2012–2023
- Exports, In Physical Terms, By Country, 2012–2023
- Exports, In Value Terms, By Country, 2012–2023
- Export Prices, By Country Of Destination, 2012–2023
-
LIST OF FIGURES
- Market Volume, In Physical Terms, 2012–2023
- Market Value, 2012–2023
- Market Structure – Domestic Supply vs. Imports, In Physical Terms, 2012-2023
- Market Structure – Domestic Supply vs. Imports, In Value Terms, 2012-2023
- Trade Balance, In Physical Terms, 2012-2023
- Trade Balance, In Value Terms, 2012-2023
- Per Capita Consumption, 2012-2023
- Market Volume Forecast to 2030
- Market Value Forecast to 2030
- Products: Market Size And Growth, By Type
- Products: Average Per Capita Consumption, By Type
- Products: Exports And Growth, By Type
- Products: Export Prices And Growth, By Type
- Production Volume And Growth
- Exports And Growth
- Export Prices And Growth
- Market Size And Growth
- Per Capita Consumption
- Imports And Growth
- Import Prices
- Production, In Physical Terms, 2012–2023
- Production, In Value Terms, 2012–2023
- Imports, In Physical Terms, 2012–2023
- Imports, In Value Terms, 2012–2023
- Imports, In Physical Terms, By Country, 2023
- Imports, In Physical Terms, By Country, 2012–2023
- Imports, In Value Terms, By Country, 2012–2023
- Import Prices, By Country Of Origin, 2012–2023
- Exports, In Physical Terms, 2012–2023
- Exports, In Value Terms, 2012–2023
- Exports, In Physical Terms, By Country, 2023
- Exports, In Physical Terms, By Country, 2012–2023
- Exports, In Value Terms, By Country, 2012–2023
- Export Prices, By Country Of Destination, 2012–2023


