World - Alumina - Market Analysis, Forecast, Size, Trends And Insights
Get instant access to more than 2 million reports, dashboards, and datasets on the IndexBox Platform.
View PricingGlobal Alumina Market to Witness Steady Growth with CAGR of +4.4% from 2023 to 2030
IndexBox has just published a new report: World - Alumina - Market Analysis, Forecast, Size, Trends And Insights.
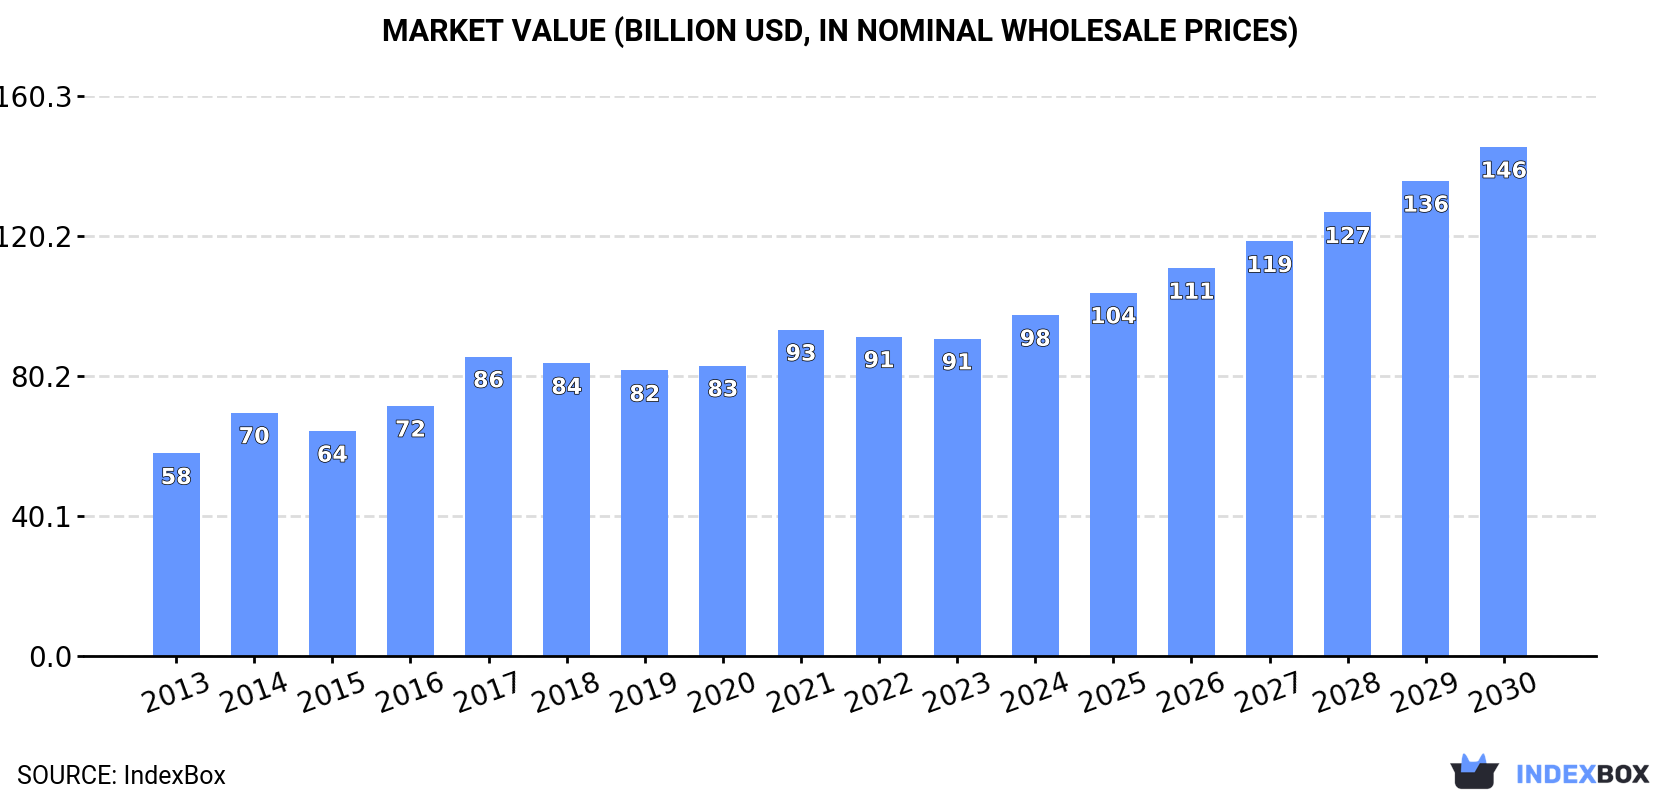
The global alumina market is expected to experience significant growth, with a forecasted CAGR of +4.4% in volume and +7.0% in value from 2023 to 2030. This growth is fueled by rising demand worldwide, resulting in the market volume reaching 183M tons and the market value reaching $145.7B by the end of 2030.
Market Forecast
Driven by increasing demand for alumina worldwide, the market is expected to continue an upward consumption trend over the next seven years. Market performance is forecast to accelerate, expanding with an anticipated CAGR of +4.4% for the period from 2023 to 2030, which is projected to bring the market volume to 183M tons by the end of 2030.
In value terms, the market is forecast to increase with an anticipated CAGR of +7.0% for the period from 2023 to 2030, which is projected to bring the market value to $145.7B (in nominal wholesale prices) by the end of 2030.
Consumption
World Consumption of Alumina
In 2023, global alumina consumption totaled 136M tons, leveling off at the previous year's figure. The total consumption volume increased at an average annual rate of +3.3% over the period from 2013 to 2023; however, the trend pattern indicated some noticeable fluctuations being recorded throughout the analyzed period. The pace of growth was the most pronounced in 2017 when the consumption volume increased by 8.9% against the previous year. Global consumption peaked at 139M tons in 2020; however, from 2021 to 2023, consumption failed to regain momentum.
The global alumina market revenue reduced modestly to $90.8B in 2023, remaining constant against the previous year. This figure reflects the total revenues of producers and importers (excluding logistics costs, retail marketing costs, and retailers' margins, which will be included in the final consumer price). The market value increased at an average annual rate of +4.6% from 2013 to 2023; however, the trend pattern indicated some noticeable fluctuations being recorded in certain years. Over the period under review, the global market hit record highs at $93.4B in 2021; however, from 2022 to 2023, consumption remained at a lower figure.
Consumption By Country
China (75M tons) constituted the country with the largest volume of alumina consumption, accounting for 55% of total volume. Moreover, alumina consumption in China exceeded the figures recorded by the second-largest consumer, India (7.3M tons), tenfold. The third position in this ranking was taken by Canada (6.3M tons), with a 4.6% share.
From 2013 to 2023, the average annual growth rate of volume in China stood at +4.0%. The remaining consuming countries recorded the following average annual rates of consumption growth: India (+6.0% per year) and Canada (+0.8% per year).
In value terms, China ($58.5B) led the market, alone. The second position in the ranking was taken by Russia ($7B). It was followed by India.
From 2013 to 2023, the average annual rate of growth in terms of value in China amounted to +5.5%. In the other countries, the average annual rates were as follows: Russia (+0.4% per year) and India (+7.4% per year).
In 2023, the highest levels of alumina per capita consumption was registered in Bahrain (1,631 kg per person), followed by Norway (461 kg per person), the United Arab Emirates (406 kg per person) and Australia (192 kg per person), while the world average per capita consumption of alumina was estimated at 17 kg per person.
From 2013 to 2023, the average annual rate of growth in terms of the alumina per capita consumption in Bahrain amounted to +13.9%. In the other countries, the average annual rates were as follows: Norway (+0.2% per year) and the United Arab Emirates (+12.8% per year).
Production
World Production of Alumina
In 2023, global production of alumina was estimated at 139M tons, almost unchanged from the previous year's figure. The total output volume increased at an average annual rate of +2.6% over the period from 2013 to 2023; the trend pattern remained relatively stable, with somewhat noticeable fluctuations throughout the analyzed period. The most prominent rate of growth was recorded in 2015 with an increase of 7.1%. Global production peaked at 139M tons in 2021; however, from 2022 to 2023, production remained at a lower figure.
In value terms, alumina production amounted to $96.1B in 2023 estimated in export price. In general, the total production indicated a resilient increase from 2013 to 2023: its value increased at an average annual rate of +5.4% over the last decade. The trend pattern, however, indicated some noticeable fluctuations being recorded throughout the analyzed period. Based on 2023 figures, production decreased by -5.0% against 2021 indices. The pace of growth was the most pronounced in 2017 with an increase of 22%. Global production peaked at $101.1B in 2021; however, from 2022 to 2023, production remained at a lower figure.
Production By Country
China (74M tons) constituted the country with the largest volume of alumina production, comprising approx. 53% of total volume. Moreover, alumina production in China exceeded the figures recorded by the second-largest producer, Australia (21M tons), fourfold. The third position in this ranking was taken by Brazil (11M tons), with a 7.8% share.
From 2013 to 2023, the average annual rate of growth in terms of volume in China amounted to +4.6%. In the other countries, the average annual rates were as follows: Australia (-0.3% per year) and Brazil (+0.9% per year).
Imports
World Imports of Alumina
In 2023, overseas purchases of alumina decreased by -7.7% to 32M tons, falling for the second consecutive year after three years of growth. Overall, imports, however, showed a relatively flat trend pattern. The growth pace was the most rapid in 2017 when imports increased by 7.2%. Global imports peaked at 36M tons in 2021; however, from 2022 to 2023, imports failed to regain momentum.
In value terms, alumina imports fell to $14B in 2023. Over the period under review, total imports indicated measured growth from 2013 to 2023: its value increased at an average annual rate of +2.3% over the last decade. The trend pattern, however, indicated some noticeable fluctuations being recorded throughout the analyzed period. The most prominent rate of growth was recorded in 2017 when imports increased by 33% against the previous year. Over the period under review, global imports reached the maximum at $16.4B in 2022, and then shrank in the following year.
Imports By Country
In 2023, Canada (4.8M tons), followed by Bahrain (3M tons), Norway (2.5M tons), India (2.5M tons), the United Arab Emirates (2.2M tons), Russia (2.1M tons), Malaysia (1.9M tons), China (1.7M tons) and Iceland (1.6M tons) represented the main importers of alumina, together comprising 69% of total imports. The following importers - South Africa (1.4M tons), the United States (1.2M tons), Oman (1M tons) and Argentina (0.9M tons) - together made up 14% of total imports.
From 2013 to 2023, the biggest increases were recorded for Oman (with a CAGR of +18.5%), while purchases for the other global leaders experienced more modest paces of growth.
In value terms, Canada ($1.7B), Russia ($1.3B) and India ($1B) constituted the countries with the highest levels of imports in 2023, with a combined 29% share of global imports. Bahrain, Norway, the United Arab Emirates, China, Malaysia, Iceland, the United States, South Africa, Oman and Argentina lagged somewhat behind, together accounting for a further 48%.
In terms of the main importing countries, Bahrain, with a CAGR of +17.9%, recorded the highest rates of growth with regard to the value of imports, over the period under review, while purchases for the other global leaders experienced more modest paces of growth.
Import Prices By Country
The average alumina import price stood at $431 per ton in 2023, reducing by -7.6% against the previous year. Over the period from 2013 to 2023, it increased at an average annual rate of +1.6%. The most prominent rate of growth was recorded in 2018 an increase of 28% against the previous year. As a result, import price reached the peak level of $485 per ton. From 2019 to 2023, the average import prices failed to regain momentum.
Prices varied noticeably by country of destination: amid the top importers, the country with the highest price was Russia ($605 per ton), while Bahrain ($341 per ton) was amongst the lowest.
From 2013 to 2023, the most notable rate of growth in terms of prices was attained by Russia (+5.9%), while the other global leaders experienced more modest paces of growth.
Exports
World Exports of Alumina
In 2023, approx. 35M tons of alumina were exported worldwide; with a decrease of -6.8% on the previous year. Over the period under review, exports saw a slight downturn. The most prominent rate of growth was recorded in 2021 when exports increased by 32%. As a result, the exports reached the peak of 40M tons. From 2022 to 2023, the growth of the global exports remained at a somewhat lower figure.
In value terms, alumina exports dropped to $14.1B in 2023. Overall, total exports indicated mild growth from 2013 to 2023: its value increased at an average annual rate of +1.2% over the last decade. The trend pattern, however, indicated some noticeable fluctuations being recorded throughout the analyzed period. The most prominent rate of growth was recorded in 2021 when exports increased by 48%. The global exports peaked at $17.6B in 2018; however, from 2019 to 2023, the exports remained at a lower figure.
Exports By Country
Australia was the key exporting country with an export of around 16M tons, which amounted to 45% of total exports. Brazil (7.7M tons) held a 22% share (based on physical terms) of total exports, which put it in second place, followed by India (5.4%) and Indonesia (4.7%). The following exporters - Ireland (1,337K tons), Jamaica (894K tons), Kazakhstan (873K tons), China (726K tons), the Netherlands (676K tons) and Spain (561K tons) - together made up 14% of total exports.
From 2013 to 2023, average annual rates of growth with regard to alumina exports from Australia stood at -1.2%. At the same time, Indonesia (+70.6%), China (+16.0%), India (+3.6%) and the Netherlands (+2.4%) displayed positive paces of growth. Moreover, Indonesia emerged as the fastest-growing exporter exported in the world, with a CAGR of +70.6% from 2013-2023. Brazil experienced a relatively flat trend pattern. By contrast, Spain (-1.2%), Kazakhstan (-1.7%), Ireland (-3.3%) and Jamaica (-6.4%) illustrated a downward trend over the same period. While the share of Indonesia (+4.7 p.p.), Brazil (+3.8 p.p.), India (+2 p.p.) and China (+1.7 p.p.) increased significantly in terms of the global exports from 2013-2023, the share of Jamaica (-1.9 p.p.) displayed negative dynamics. The shares of the other countries remained relatively stable throughout the analyzed period.
In value terms, Australia ($5.4B) remains the largest alumina supplier worldwide, comprising 38% of global exports. The second position in the ranking was held by Brazil ($2.6B), with a 19% share of global exports. It was followed by India, with a 5.8% share.
From 2013 to 2023, the average annual growth rate of value in Australia was relatively modest. In the other countries, the average annual rates were as follows: Brazil (+3.9% per year) and India (+5.9% per year).
Export Prices By Country
The average alumina export price stood at $403 per ton in 2023, declining by -4.4% against the previous year. Over the last decade, it increased at an average annual rate of +2.3%. The most prominent rate of growth was recorded in 2018 when the average export price increased by 33%. As a result, the export price attained the peak level of $465 per ton. From 2019 to 2023, the average export prices remained at a somewhat lower figure.
Prices varied noticeably by country of origin: amid the top suppliers, the country with the highest price was China ($831 per ton), while Australia ($341 per ton) was amongst the lowest.
From 2013 to 2023, the most notable rate of growth in terms of prices was attained by China (+3.7%), while the other global leaders experienced more modest paces of growth.
This report provides an in-depth analysis of the global alumina market. Within it, you will discover the latest data on market trends and opportunities by country, consumption, production and price developments, as well as the global trade (imports and exports). The forecast exhibits the market prospects through 2030.
Product coverage:
- Prodcom 24421200 - Aluminium oxide (excluding artificial corundum)
Country coverage:
Worldwide - the report contains statistical data for 200 countries and includes detailed profiles of the 50 largest consuming countries:
- USA
- China
- Japan
- Germany
- United Kingdom
- France
- Brazil
- Italy
- Russian Federation
- India
- Canada
- Australia
- Republic of Korea
- Spain
- Mexico
- Indonesia
- Netherlands
- Turkey
- Saudi Arabia
- Switzerland
- Sweden
- Nigeria
- Poland
- Belgium
- Argentina
- Norway
- Austria
- Thailand
- United Arab Emirates
- Colombia
- Denmark
- South Africa
- Malaysia
- Israel
- Singapore
- Egypt
- Philippines
- Finland
- Chile
- Ireland
- Pakistan
- Greece
- Portugal
- Kazakhstan
- Algeria
- Czech Republic
- Qatar
- Peru
- Romania
- Vietnam
+ the largest producing countries
Data coverage:
- Global market volume and value
- Per Capita consumption
- Forecast of the market dynamics in the medium term
- Global production, split by region and country
- Global trade (exports and imports)
- Export and import prices
- Market trends, drivers and restraints
- Key market players and their profiles
Company coverage:
Reasons to buy this report:
- Take advantage of the latest data
- Find deeper insights into current market developments
- Discover vital success factors affecting the market
This report is designed for manufacturers, distributors, importers, and wholesalers, as well as for investors, consultants and advisors.
In this report, you can find information that helps you to make informed decisions on the following issues:
- How to diversify your business and benefit from new market opportunities
- How to load your idle production capacity
- How to boost your sales on overseas markets
- How to increase your profit margins
- How to make your supply chain more sustainable
- How to reduce your production and supply chain costs
- How to outsource production to other countries
- How to prepare your business for global expansion
While doing this research, we combine the accumulated expertise of our analysts and the capabilities of artificial intelligence. The AI-based platform, developed by our data scientists, constitutes the key working tool for business analysts, empowering them to discover deep insights and ideas from the marketing data.
-
1. INTRODUCTION
Making Data-Driven Decisions to Grow Your Business
- REPORT DESCRIPTION
- RESEARCH METHODOLOGY AND AI PLATFORM
- DATA-DRIVEN DECISIONS FOR YOUR BUSINESS
- GLOSSARY AND SPECIFIC TERMS
-
2. EXECUTIVE SUMMARY
A Quick Overview of Market Performance
- KEY FINDINGS
- MARKET TRENDS This Chapter is Available Only for the Professional Edition PRO
-
3. MARKET OVERVIEW
Understanding the Current State of The Market and Its Prospects
- MARKET SIZE
- CONSUMPTION BY COUNTRY
- MARKET FORECAST TO 2030
-
4. MOST PROMISING PRODUCT
Finding New Products to Diversify Your Business
This Chapter is Available Only for the Professional Edition PRO- TOP PRODUCTS TO DIVERSIFY YOUR BUSINESS
- BEST-SELLING PRODUCTS
- MOST CONSUMED PRODUCT
- MOST TRADED PRODUCT
- MOST PROFITABLE PRODUCT FOR EXPORT
-
5. MOST PROMISING SUPPLYING COUNTRIES
Choosing the Best Countries to Establish Your Sustainable Supply Chain
This Chapter is Available Only for the Professional Edition PRO- TOP COUNTRIES TO SOURCE YOUR PRODUCT
- TOP PRODUCING COUNTRIES
- TOP EXPORTING COUNTRIES
- LOW-COST EXPORTING COUNTRIES
-
6. MOST PROMISING OVERSEAS MARKETS
Choosing the Best Countries to Boost Your Exports
This Chapter is Available Only for the Professional Edition PRO- TOP OVERSEAS MARKETS FOR EXPORTING YOUR PRODUCT
- TOP CONSUMING MARKETS
- UNSATURATED MARKETS
- TOP IMPORTING MARKETS
- MOST PROFITABLE MARKETS
7. GLOBAL PRODUCTION
The Latest Trends and Insights into The Industry
- PRODUCTION VOLUME AND VALUE
- PRODUCTION BY COUNTRY
8. GLOBAL IMPORTS
The Largest Importers on The Market and How They Succeed
- IMPORTS FROM 2012–2023
- IMPORTS BY COUNTRY
- IMPORT PRICES BY COUNTRY
9. GLOBAL EXPORTS
The Largest Exporters on The Market and How They Succeed
- EXPORTS FROM 2012–2023
- EXPORTS BY COUNTRY
- EXPORT PRICES BY COUNTRY
-
10. PROFILES OF MAJOR PRODUCERS
The Largest Producers on The Market and Their Profiles
This Chapter is Available Only for the Professional Edition PRO -
11. COUNTRY PROFILES
The Largest Markets And Their Profiles
This Chapter is Available Only for the Professional Edition PRO- United States
- China
- Japan
- Germany
- United Kingdom
- France
- Brazil
- Italy
- Russian Federation
- India
- Canada
- Australia
- Republic of Korea
- Spain
- Mexico
- Indonesia
- Netherlands
- Turkey
- Saudi Arabia
- Switzerland
- Sweden
- Nigeria
- Poland
- Belgium
- Argentina
- Norway
- Austria
- Thailand
- United Arab Emirates
- Colombia
- Denmark
- South Africa
- Malaysia
- Israel
- Singapore
- Egypt
- Philippines
- Finland
- Chile
- Ireland
- Pakistan
- Greece
- Portugal
- Kazakhstan
- Algeria
- Czech Republic
- Qatar
- Peru
- Romania
- Vietnam
-
LIST OF TABLES
- Key Findings In 2023
- Market Volume, In Physical Terms, 2012–2023
- Market Value, 2012–2023
- Per Capita Consumption, By Country, 2018–2023
- Production, In Physical Terms, By Country, 2012–2023
- Imports, In Physical Terms, By Country, 2012–2023
- Imports, In Value Terms, By Country, 2012–2023
- Import Prices, By Country Of Destination, 2012–2023
- Exports, In Physical Terms, By Country, 2012–2023
- Exports, In Value Terms, By Country, 2012–2023
- Export Prices, By Country Of Origin, 2012–2023
-
LIST OF FIGURES
- Market Volume, In Physical Terms, 2012–2023
- Market Value, 2012–2023
- Consumption, By Country, 2023
- Market Volume Forecast to 2030
- Market Value Forecast to 2030
- Products: Market Size And Growth, By Type
- Products: Average Per Capita Consumption, By Type
- Products: Exports And Growth, By Type
- Products: Export Prices And Growth, By Type
- Production Volume And Growth
- Exports And Growth
- Export Prices And Growth
- Market Size And Growth
- Per Capita Consumption
- Imports And Growth
- Import Prices
- Production, In Physical Terms, 2012–2023
- Production, In Value Terms, 2012–2023
- Production, By Country, 2023
- Production, In Physical Terms, By Country, 2012–2023
- Imports, In Physical Terms, 2012–2023
- Imports, In Value Terms, 2012–2023
- Imports, In Physical Terms, By Country, 2023
- Imports, In Physical Terms, By Country, 2012–2023
- Imports, In Value Terms, By Country, 2012–2023
- Import Prices, By Country, 2012–2023
- Exports, In Physical Terms, 2012–2023
- Exports, In Value Terms, 2012–2023
- Exports, In Physical Terms, By Country, 2023
- Exports, In Physical Terms, By Country, 2012–2023
- Exports, In Value Terms, By Country, 2012–2023
- Export Prices, 2012–2023


