
Australia - Agricultural Harvesters - Market Analysis, Forecast, Size, Trends And Insights
Get instant access to more than 2 million reports, dashboards, and datasets on the IndexBox Platform.
View PricingAustralia's Agricultural Harvester Imports Reach Unprecedented $691 Million Mark in 2023
Australia Agricultural Harvester Imports
In 2023, purchases abroad of agricultural harvesters increased by 35% to 5.8K units, rising for the fourth year in a row after two years of decline. Overall, imports enjoyed a remarkable increase. The most prominent rate of growth was recorded in 2017 when imports increased by 59%. Over the period under review, imports hit record highs in 2023 and are likely to continue growth in the near future.
In value terms, agricultural harvester imports skyrocketed to $691M (IndexBox estimates) in 2023. In general, imports recorded a resilient increase. The pace of growth appeared the most rapid in 2021 when imports increased by 100%. Over the period under review, imports reached the maximum in 2023 and are expected to retain growth in the near future.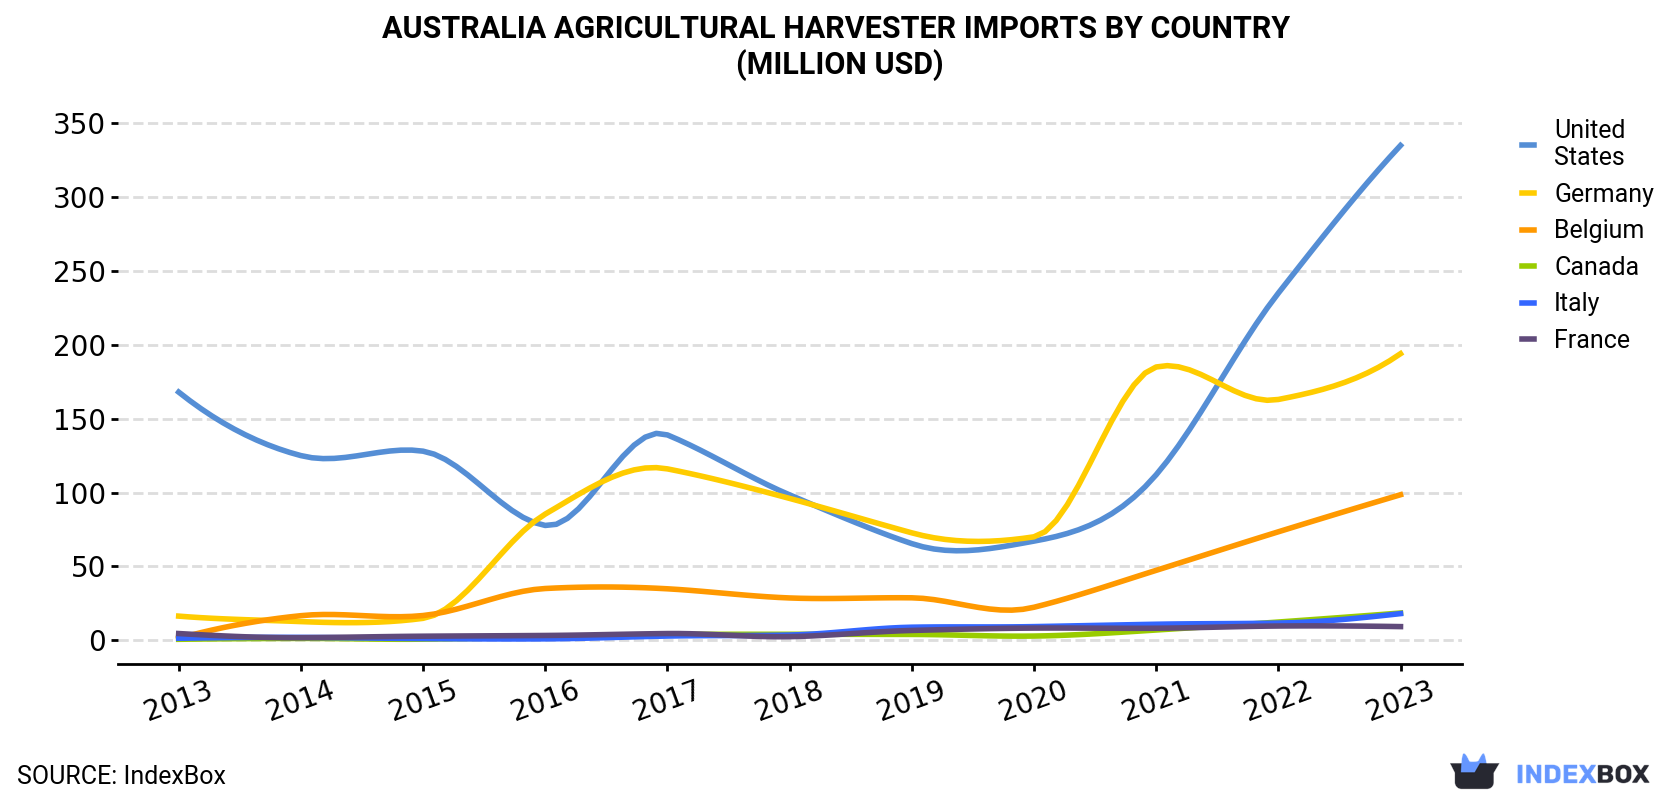
| COUNTRY | Import Value of Agricultural Harvester in Australia (million USD) | ||||||||||
|---|---|---|---|---|---|---|---|---|---|---|---|
| 2013 | 2014 | 2015 | 2016 | 2017 | 2018 | 2019 | 2020 | 2021 | 2022 | 2023 | |
| United States | 168 | 125 | 128 | 77.7 | 139 | 98.4 | 65.4 | 67.1 | 112 | 235 | 335 |
| Germany | 16.3 | 12.6 | 14.8 | 85.4 | 116 | 96.0 | 72.7 | 70.0 | 185 | 163 | 194 |
| Belgium | 1.2 | 16.6 | 16.7 | 35.0 | 34.8 | 28.6 | 28.7 | 22.3 | 47.3 | 73.4 | 98.5 |
| Canada | 0.6 | 1.2 | 0.7 | 2.1 | 3.8 | 4.0 | 3.9 | 2.8 | 6.9 | 12.3 | 18.4 |
| Italy | 1.3 | 1.9 | 1.1 | 0.9 | 2.8 | 3.5 | 8.8 | 9.2 | 10.8 | 11.6 | 18.0 |
| France | 4.5 | 1.7 | 2.7 | 3.2 | 4.5 | 2.4 | 6.6 | 8.2 | 8.1 | 9.6 | 9.2 |
| Others | 6.6 | 8.2 | 6.5 | 8.0 | 7.2 | 11.9 | 7.6 | 9.3 | 7.9 | 8.6 | 17.8 |
| Total | 199 | 168 | 171 | 212 | 307 | 245 | 194 | 189 | 378 | 513 | 691 |
Imports by Country
In 2023, the United States (3.7K units) constituted the largest supplier of agricultural harvester to Australia, with a 64% share of total imports. Moreover, agricultural harvester imports from the United States exceeded the figures recorded by the second-largest supplier, Germany (781 units), fivefold. The third position in this ranking was held by Canada (368 units), with a 6.3% share.
From 2013 to 2023, the average annual growth rate of volume from the United States totaled +12.0%. The remaining supplying countries recorded the following average annual rates of imports growth: Germany (+24.8% per year) and Canada (+39.7% per year).
In value terms, the United States ($335M), Germany ($194M) and Belgium ($99M) appeared to be the largest agricultural harvester suppliers to Australia, together accounting for 91% of total imports.
Belgium, with a CAGR of +55.6%, saw the highest rates of growth with regard to the value of imports, among the main suppliers over the period under review, while purchases for the other leaders experienced more modest paces of growth.
Imports by Type
In 2023, forage harvesters and other harvesting machines (4.3K units) constituted the largest type of agricultural harvesters supplied to Australia, accounting for a 73% share of total imports. Moreover, forage harvesters and other harvesting machines exceeded the figures recorded for the second-largest type, combine harvester-threshers (1.5K units), threefold.
From 2013 to 2023, the average annual rate of growth in terms of the volume of forage harvesters and other harvesting machines imports totaled +19.8%. With regard to the other supplied products, the following average annual rates of growth were recorded: combine harvester-threshers (+6.8% per year) and threshing machinery except combine harvester-threshers (+10.0% per year).
In value terms, combine harvester-threshers ($514M) constituted the largest type of agricultural harvesters supplied to Australia, comprising 74% of total imports. The second position in the ranking was taken by forage harvesters and other harvesting machines ($176M), with a 25% share of total imports.
Import Prices by Country
In 2023, the agricultural harvester price stood at $118,522 per unit (CIF, Australia), approximately mirroring the previous year. Overall, the import price, however, saw a slight reduction. The most prominent rate of growth was recorded in 2021 an increase of 47% against the previous year. Over the period under review, average import prices hit record highs at $135,086 per unit in 2014; however, from 2015 to 2023, import prices stood at a somewhat lower figure.
Prices varied noticeably by country of origin: amid the top importers, the country with the highest price was Belgium ($330,593 per unit), while the price for France ($42,554 per unit) was amongst the lowest.
From 2013 to 2023, the most notable rate of growth in terms of prices was attained by Italy (+12.4%), while the prices for the other major suppliers experienced more modest paces of growth.
This report provides an in-depth analysis of the agricultural harvester market in Australia. Within it, you will discover the latest data on market trends and opportunities by country, consumption, production and price developments, as well as the global trade (imports and exports). The forecast exhibits the market prospects through 2030.
Product coverage:
- Prodcom 28305915 - Combine harvester-threshers
- Prodcom 28305930 - Agricultural threshing machinery (excluding combine harvester-threshers)
- Prodcom 28305945 - Forage harvesters (excluding self-propelled)
- Prodcom 28305960 - Forage harvesters, self-propelled
- Prodcom 28305970 - Harvesting machines (excluding combine harvester threshers, root or tuber harvesting machines, forage harvesters)
Country coverage:
- Australia
Data coverage:
- Market volume and value
- Per Capita consumption
- Forecast of the market dynamics in the medium term
- Trade (exports and imports) in Australia
- Export and import prices
- Market trends, drivers and restraints
- Key market players and their profiles
Reasons to buy this report:
- Take advantage of the latest data
- Find deeper insights into current market developments
- Discover vital success factors affecting the market
This report is designed for manufacturers, distributors, importers, and wholesalers, as well as for investors, consultants and advisors.
In this report, you can find information that helps you to make informed decisions on the following issues:
- How to diversify your business and benefit from new market opportunities
- How to load your idle production capacity
- How to boost your sales on overseas markets
- How to increase your profit margins
- How to make your supply chain more sustainable
- How to reduce your production and supply chain costs
- How to outsource production to other countries
- How to prepare your business for global expansion
While doing this research, we combine the accumulated expertise of our analysts and the capabilities of artificial intelligence. The AI-based platform, developed by our data scientists, constitutes the key working tool for business analysts, empowering them to discover deep insights and ideas from the marketing data.
-
1. INTRODUCTION
Making Data-Driven Decisions to Grow Your Business
- REPORT DESCRIPTION
- RESEARCH METHODOLOGY AND AI PLATFORM
- DATA-DRIVEN DECISIONS FOR YOUR BUSINESS
- GLOSSARY AND SPECIFIC TERMS
-
2. EXECUTIVE SUMMARY
A Quick Overview of Market Performance
- KEY FINDINGS
- MARKET TRENDS This Chapter is Available Only for the Professional Edition PRO
-
3. MARKET OVERVIEW
Understanding the Current State of The Market and Its Prospects
- MARKET SIZE
- MARKET STRUCTURE
- TRADE BALANCE
- PER CAPITA CONSUMPTION
- MARKET FORECAST TO 2030
-
4. MOST PROMISING PRODUCT
Finding New Products to Diversify Your Business
This Chapter is Available Only for the Professional Edition PRO- TOP PRODUCTS TO DIVERSIFY YOUR BUSINESS
- BEST-SELLING PRODUCTS
- MOST CONSUMED PRODUCT
- MOST TRADED PRODUCT
- MOST PROFITABLE PRODUCT FOR EXPORT
-
5. MOST PROMISING SUPPLYING COUNTRIES
Choosing the Best Countries to Establish Your Sustainable Supply Chain
This Chapter is Available Only for the Professional Edition PRO- TOP COUNTRIES TO SOURCE YOUR PRODUCT
- TOP PRODUCING COUNTRIES
- TOP EXPORTING COUNTRIES
- LOW-COST EXPORTING COUNTRIES
-
6. MOST PROMISING OVERSEAS MARKETS
Choosing the Best Countries to Boost Your Exports
This Chapter is Available Only for the Professional Edition PRO- TOP OVERSEAS MARKETS FOR EXPORTING YOUR PRODUCT
- TOP CONSUMING MARKETS
- UNSATURATED MARKETS
- TOP IMPORTING MARKETS
- MOST PROFITABLE MARKETS
7. PRODUCTION
The Latest Trends and Insights into The Industry
- PRODUCTION VOLUME AND VALUE
8. IMPORTS
The Largest Import Supplying Countries
- IMPORTS FROM 2012–2023
- IMPORTS BY COUNTRY
- IMPORT PRICES BY COUNTRY
9. EXPORTS
The Largest Destinations for Exports
- EXPORTS FROM 2012–2023
- EXPORTS BY COUNTRY
- EXPORT PRICES BY COUNTRY
-
10. PROFILES OF MAJOR PRODUCERS
The Largest Producers on The Market and Their Profiles
This Chapter is Available Only for the Professional Edition PRO -
LIST OF TABLES
- Key Findings In 2023
- Market Volume, In Physical Terms, 2012–2023
- Market Value, 2012–2023
- Per Capita Consumption In 2012-2023
- Imports, In Physical Terms, By Country, 2012–2023
- Imports, In Value Terms, By Country, 2012–2023
- Import Prices, By Country Of Origin, 2012–2023
- Exports, In Physical Terms, By Country, 2012–2023
- Exports, In Value Terms, By Country, 2012–2023
- Export Prices, By Country Of Destination, 2012–2023
-
LIST OF FIGURES
- Market Volume, In Physical Terms, 2012–2023
- Market Value, 2012–2023
- Market Structure – Domestic Supply vs. Imports, In Physical Terms, 2012-2023
- Market Structure – Domestic Supply vs. Imports, In Value Terms, 2012-2023
- Trade Balance, In Physical Terms, 2012-2023
- Trade Balance, In Value Terms, 2012-2023
- Per Capita Consumption, 2012-2023
- Market Volume Forecast to 2030
- Market Value Forecast to 2030
- Products: Market Size And Growth, By Type
- Products: Average Per Capita Consumption, By Type
- Products: Exports And Growth, By Type
- Products: Export Prices And Growth, By Type
- Production Volume And Growth
- Exports And Growth
- Export Prices And Growth
- Market Size And Growth
- Per Capita Consumption
- Imports And Growth
- Import Prices
- Production, In Physical Terms, 2012–2023
- Production, In Value Terms, 2012–2023
- Imports, In Physical Terms, 2012–2023
- Imports, In Value Terms, 2012–2023
- Imports, In Physical Terms, By Country, 2023
- Imports, In Physical Terms, By Country, 2012–2023
- Imports, In Value Terms, By Country, 2012–2023
- Import Prices, By Country Of Origin, 2012–2023
- Exports, In Physical Terms, 2012–2023
- Exports, In Value Terms, 2012–2023
- Exports, In Physical Terms, By Country, 2023
- Exports, In Physical Terms, By Country, 2012–2023
- Exports, In Value Terms, By Country, 2012–2023
- Export Prices, By Country Of Destination, 2012–2023


