
Australia - Wool - Market Analysis, Forecast, Size, Trends And Insights
Get instant access to more than 2 million reports, dashboards, and datasets on the IndexBox Platform.
View PricingAustralia's Wool Exports Plunge to $103M in 2023
Australia Wool Exports
In 2023, overseas shipments of wool decreased by -21.6% to 13K tons for the first time since 2020, thus ending a two-year rising trend. Over the period under review, exports saw a abrupt shrinkage. The most prominent rate of growth was recorded in 2021 when exports increased by 37% against the previous year. The exports peaked at 27K tons in 2015; however, from 2016 to 2023, the exports remained at a lower figure.
In value terms, wool exports dropped remarkably to $103M (IndexBox estimates) in 2023. Overall, exports continue to indicate a abrupt contraction. The pace of growth appeared the most rapid in 2021 when exports increased by 39% against the previous year. Over the period under review, the exports reached the peak figure at $265M in 2018; however, from 2019 to 2023, the exports remained at a lower figure.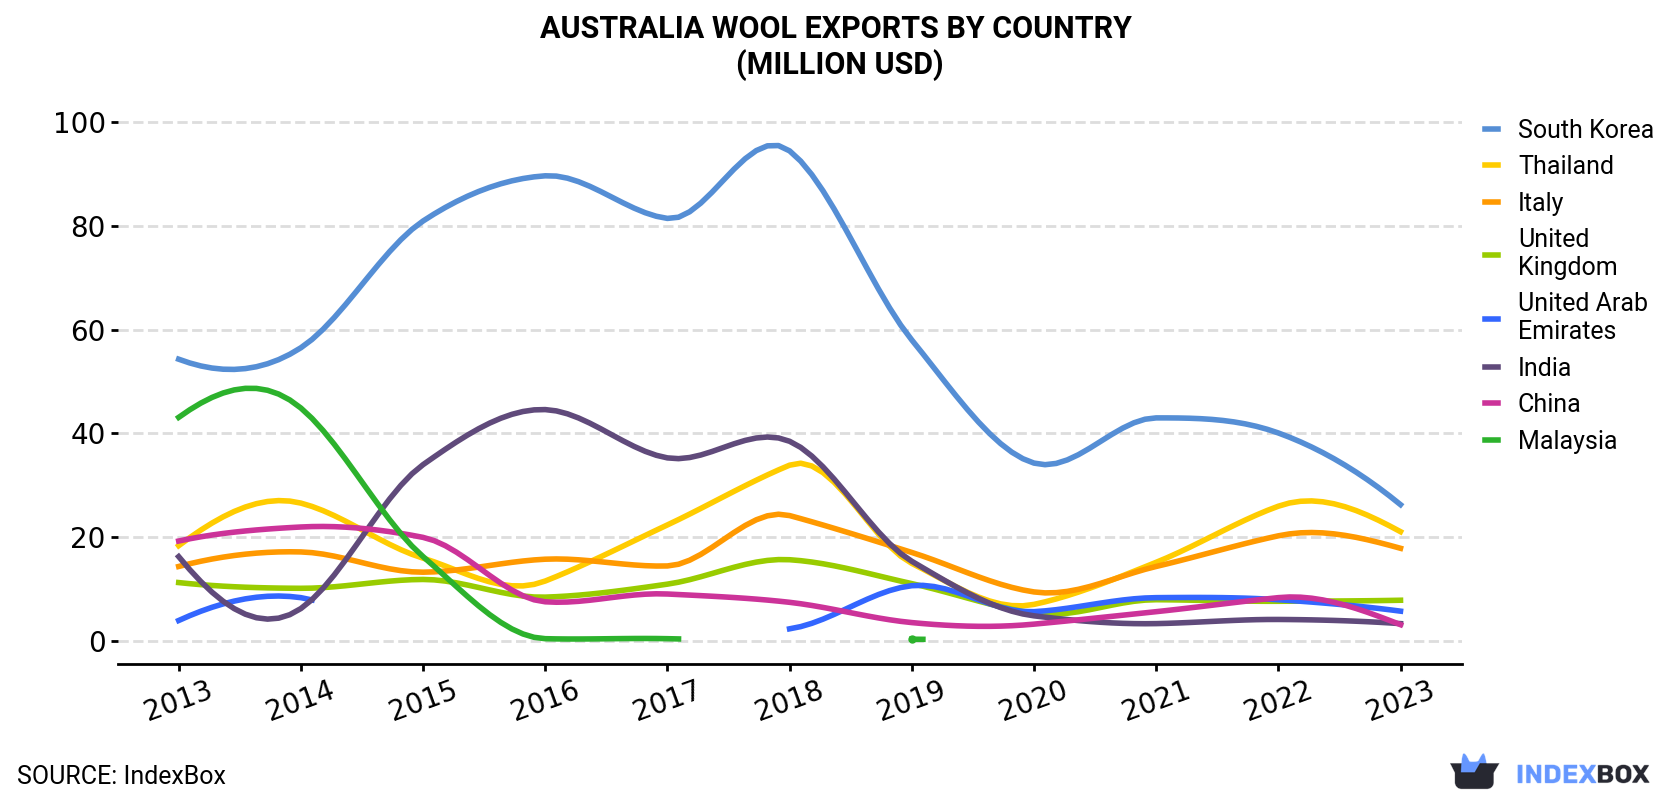
| COUNTRY | Export Value of Wool in Australia (million USD) | ||||||||||
|---|---|---|---|---|---|---|---|---|---|---|---|
| 2013 | 2014 | 2015 | 2016 | 2017 | 2018 | 2019 | 2020 | 2021 | 2022 | 2023 | |
| South Korea | 54.3 | 56.5 | 80.9 | 89.6 | 81.4 | 94.4 | 58.0 | 34.3 | 43.0 | 40.1 | 26.3 |
| Thailand | 18.4 | 26.6 | 16.0 | 11.6 | 22.4 | 33.9 | 15.0 | 7.1 | 15.2 | 26.0 | 21.1 |
| Italy | 14.4 | 17.2 | 13.3 | 15.8 | 14.5 | 24.2 | 17.1 | 9.5 | 14.4 | 20.3 | 17.9 |
| United Kingdom | 11.3 | 10.2 | 11.9 | 8.5 | 11.0 | 15.7 | 11.1 | 5.4 | 8.0 | 7.7 | 7.9 |
| United Arab Emirates | 4.0 | 8.4 | N/A | N/A | N/A | 2.4 | 10.7 | 5.7 | 8.4 | 8.0 | 5.8 |
| India | 16.3 | 6.3 | 34.0 | 44.6 | 35.3 | 38.5 | 15.4 | 4.9 | 3.4 | 4.2 | 3.4 |
| China | 19.3 | 22.0 | 20.0 | 7.6 | 9.1 | 7.5 | 3.6 | 3.3 | 5.7 | 8.4 | 3.2 |
| Malaysia | 43.1 | 44.9 | 16.3 | 0.5 | 0.5 | N/A | 0.4 | N/A | N/A | N/A | N/A |
| Others | 53.6 | 44.9 | 45.1 | 42.9 | 45.9 | 48.6 | 37.1 | 19.8 | 26.6 | 27.2 | 17.2 |
| Total | 235 | 237 | 238 | 221 | 220 | 265 | 168 | 90.0 | 125 | 142 | 103 |
Exports by Country
South Korea (3.9K tons), Thailand (2K tons) and Italy (2K tons) were the main destinations of wool exports from Australia, with a combined 60% share of total exports. the UK, India, the United Arab Emirates, China and Malaysia lagged somewhat behind, together accounting for a further 18%.
From 2013 to 2023, the most notable rate of growth in terms of shipments, amongst the main countries of destination, was attained by the United Arab Emirates (with a CAGR of +4.5%), while the other leaders experienced more modest paces of growth.
In value terms, South Korea ($26M), Thailand ($21M) and Italy ($18M) constituted the largest markets for wool exported from Australia worldwide, with a combined 63% share of total exports. the UK, the United Arab Emirates, India, China and Malaysia lagged somewhat behind, together comprising a further 20%.
the United Arab Emirates, with a CAGR of +3.7%, saw the highest rates of growth with regard to the value of exports, among the main countries of destination over the period under review, while shipments for the other leaders experienced more modest paces of growth.
Exports by Type
Wool; (not carded or combed), carbonised (8.2K tons) was the largest type of wool exported from Australia, with a 65% share of total exports. Moreover, wool; (not carded or combed), carbonised exceeded the volume of the second product type, wool; (not carded or combed), degreased, (not carbonised), shorn (3.9K tons), twofold.
From 2013 to 2023, the average annual rate of growth in terms of the volume of wool; (not carded or combed), carbonised exports amounted to -3.6%. With regard to the other exported products, the following average annual rates of growth were recorded: wool; (not carded or combed), degreased, (not carbonised), shorn (-9.0% per year) and wool; (not carded or combed), degreased, (not carbonised), (other than shorn) (-13.7% per year).
In value terms, wool with the largest exports in Australia were wool; (not carded or combed), carbonised ($61M), wool; (not carded or combed), degreased, (not carbonised), shorn ($37M) and wool; (not carded or combed), degreased, (not carbonised), (other than shorn) ($4.7M), together accounting for 99.9% of total exports.
Among the main product categories, wool; (not carded or combed), carbonised, with a CAGR of -5.4%, saw the highest rates of growth with regard to the value of exports, over the period under review, while shipments for the other products experienced a decline.
Export Prices by Country
In 2023, the wool price stood at $7,898 per ton (FOB, Australia), reducing by -7.6% against the previous year. In general, the export price recorded a perceptible slump. The most prominent rate of growth was recorded in 2018 when the average export price increased by 23%. As a result, the export price attained the peak level of $12,293 per ton. From 2019 to 2023, the average export prices remained at a somewhat lower figure.
Prices varied noticeably by country of destination: amid the top suppliers, the country with the highest price was Malaysia ($26,340 per ton), while the average price for exports to Germany ($4,737 per ton) was amongst the lowest.
From 2013 to 2023, the most notable rate of growth in terms of prices was recorded for supplies to Malaysia (+9.3%), while the prices for the other major destinations experienced mixed trend patterns.
This report provides an in-depth analysis of the wool market in Australia. Within it, you will discover the latest data on market trends and opportunities by country, consumption, production and price developments, as well as the global trade (imports and exports). The forecast exhibits the market prospects through 2030.
Product coverage:
- Prodcom 13102200 - Wool, degreased or carbonised, not carded or combed
Country coverage:
- Australia
Data coverage:
- Market volume and value
- Per Capita consumption
- Forecast of the market dynamics in the medium term
- Trade (exports and imports) in Australia
- Export and import prices
- Market trends, drivers and restraints
- Key market players and their profiles
Reasons to buy this report:
- Take advantage of the latest data
- Find deeper insights into current market developments
- Discover vital success factors affecting the market
This report is designed for manufacturers, distributors, importers, and wholesalers, as well as for investors, consultants and advisors.
In this report, you can find information that helps you to make informed decisions on the following issues:
- How to diversify your business and benefit from new market opportunities
- How to load your idle production capacity
- How to boost your sales on overseas markets
- How to increase your profit margins
- How to make your supply chain more sustainable
- How to reduce your production and supply chain costs
- How to outsource production to other countries
- How to prepare your business for global expansion
While doing this research, we combine the accumulated expertise of our analysts and the capabilities of artificial intelligence. The AI-based platform, developed by our data scientists, constitutes the key working tool for business analysts, empowering them to discover deep insights and ideas from the marketing data.
-
1. INTRODUCTION
Making Data-Driven Decisions to Grow Your Business
- REPORT DESCRIPTION
- RESEARCH METHODOLOGY AND AI PLATFORM
- DATA-DRIVEN DECISIONS FOR YOUR BUSINESS
- GLOSSARY AND SPECIFIC TERMS
-
2. EXECUTIVE SUMMARY
A Quick Overview of Market Performance
- KEY FINDINGS
- MARKET TRENDS This Chapter is Available Only for the Professional Edition PRO
-
3. MARKET OVERVIEW
Understanding the Current State of The Market and Its Prospects
- MARKET SIZE
- MARKET STRUCTURE
- TRADE BALANCE
- PER CAPITA CONSUMPTION
- MARKET FORECAST TO 2030
-
4. MOST PROMISING PRODUCT
Finding New Products to Diversify Your Business
This Chapter is Available Only for the Professional Edition PRO- TOP PRODUCTS TO DIVERSIFY YOUR BUSINESS
- BEST-SELLING PRODUCTS
- MOST CONSUMED PRODUCT
- MOST TRADED PRODUCT
- MOST PROFITABLE PRODUCT FOR EXPORT
-
5. MOST PROMISING SUPPLYING COUNTRIES
Choosing the Best Countries to Establish Your Sustainable Supply Chain
This Chapter is Available Only for the Professional Edition PRO- TOP COUNTRIES TO SOURCE YOUR PRODUCT
- TOP PRODUCING COUNTRIES
- TOP EXPORTING COUNTRIES
- LOW-COST EXPORTING COUNTRIES
-
6. MOST PROMISING OVERSEAS MARKETS
Choosing the Best Countries to Boost Your Exports
This Chapter is Available Only for the Professional Edition PRO- TOP OVERSEAS MARKETS FOR EXPORTING YOUR PRODUCT
- TOP CONSUMING MARKETS
- UNSATURATED MARKETS
- TOP IMPORTING MARKETS
- MOST PROFITABLE MARKETS
7. PRODUCTION
The Latest Trends and Insights into The Industry
- PRODUCTION VOLUME AND VALUE
8. IMPORTS
The Largest Import Supplying Countries
- IMPORTS FROM 2012–2023
- IMPORTS BY COUNTRY
- IMPORT PRICES BY COUNTRY
9. EXPORTS
The Largest Destinations for Exports
- EXPORTS FROM 2012–2023
- EXPORTS BY COUNTRY
- EXPORT PRICES BY COUNTRY
-
10. PROFILES OF MAJOR PRODUCERS
The Largest Producers on The Market and Their Profiles
This Chapter is Available Only for the Professional Edition PRO -
LIST OF TABLES
- Key Findings In 2023
- Market Volume, In Physical Terms, 2012–2023
- Market Value, 2012–2023
- Per Capita Consumption In 2012-2023
- Imports, In Physical Terms, By Country, 2012–2023
- Imports, In Value Terms, By Country, 2012–2023
- Import Prices, By Country Of Origin, 2012–2023
- Exports, In Physical Terms, By Country, 2012–2023
- Exports, In Value Terms, By Country, 2012–2023
- Export Prices, By Country Of Destination, 2012–2023
-
LIST OF FIGURES
- Market Volume, In Physical Terms, 2012–2023
- Market Value, 2012–2023
- Market Structure – Domestic Supply vs. Imports, In Physical Terms, 2012-2023
- Market Structure – Domestic Supply vs. Imports, In Value Terms, 2012-2023
- Trade Balance, In Physical Terms, 2012-2023
- Trade Balance, In Value Terms, 2012-2023
- Per Capita Consumption, 2012-2023
- Market Volume Forecast to 2030
- Market Value Forecast to 2030
- Products: Market Size And Growth, By Type
- Products: Average Per Capita Consumption, By Type
- Products: Exports And Growth, By Type
- Products: Export Prices And Growth, By Type
- Production Volume And Growth
- Exports And Growth
- Export Prices And Growth
- Market Size And Growth
- Per Capita Consumption
- Imports And Growth
- Import Prices
- Production, In Physical Terms, 2012–2023
- Production, In Value Terms, 2012–2023
- Imports, In Physical Terms, 2012–2023
- Imports, In Value Terms, 2012–2023
- Imports, In Physical Terms, By Country, 2023
- Imports, In Physical Terms, By Country, 2012–2023
- Imports, In Value Terms, By Country, 2012–2023
- Import Prices, By Country Of Origin, 2012–2023
- Exports, In Physical Terms, 2012–2023
- Exports, In Value Terms, 2012–2023
- Exports, In Physical Terms, By Country, 2023
- Exports, In Physical Terms, By Country, 2012–2023
- Exports, In Value Terms, By Country, 2012–2023
- Export Prices, By Country Of Destination, 2012–2023


