World - Avocados - Market Analysis, Forecast, Size, Trends and Insights
Get instant access to more than 2 million reports, dashboards, and datasets on the IndexBox Platform.
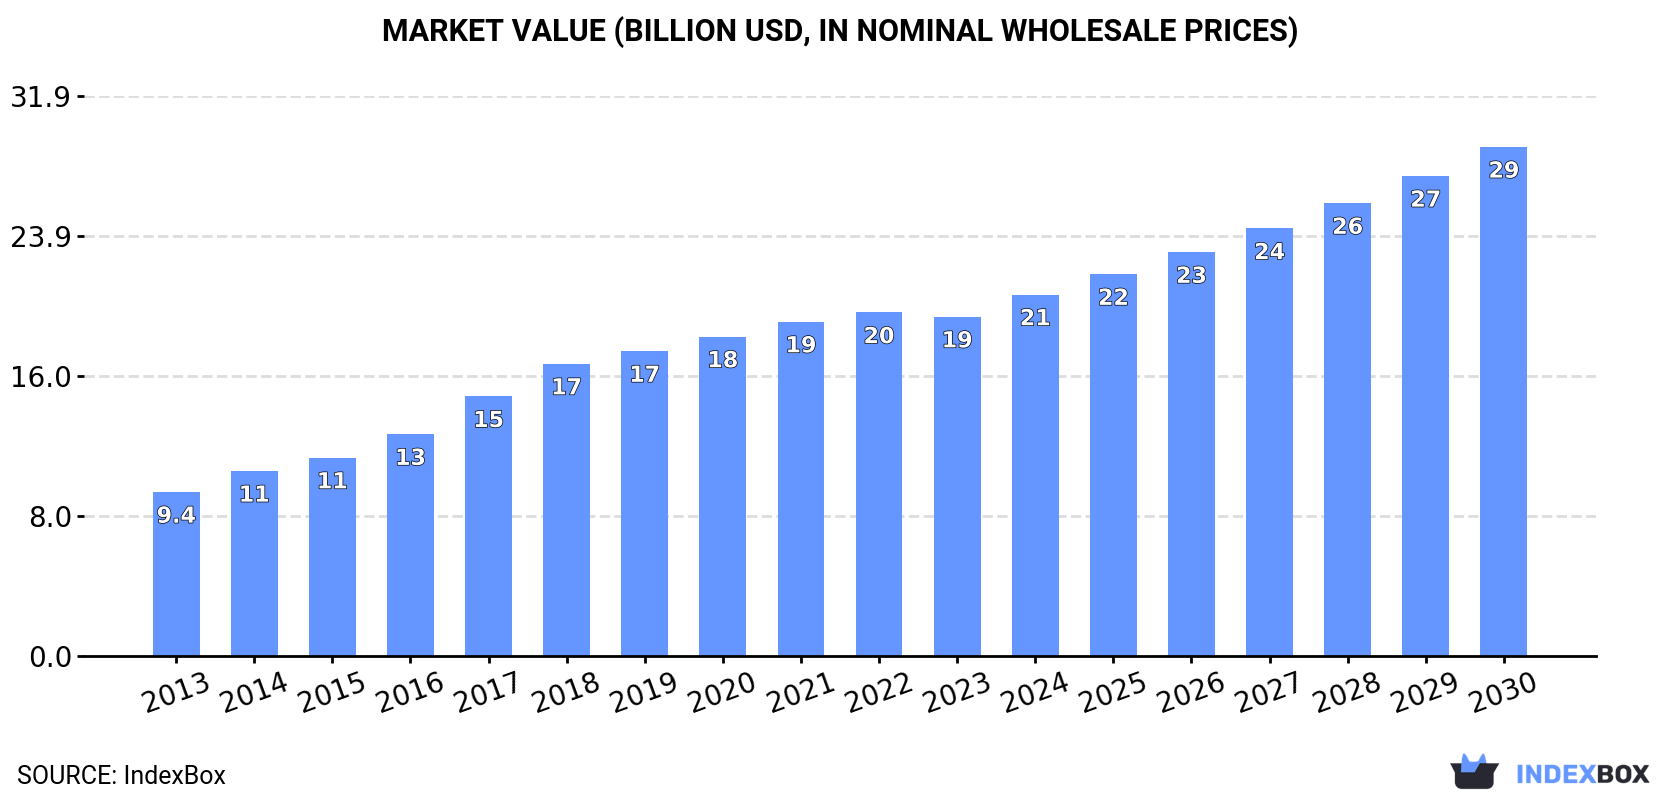
View PricingGlobal Avocado Market: Anticipated CAGR of +3.9% in Volume and +6.0% in Value from 2023 to 2030
IndexBox has just published a new report: World - Avocados - Market Analysis, Forecast, Size, Trends and Insights.
Driven by rising global demand, the avocado market is projected to see steady growth in both volume and value over the next seven years. With an anticipated CAGR of +3.9% in volume and +6.0% in value, the market is expected to reach 12M tons and $29B respectively by 2030.
Market Forecast
Driven by increasing demand for avocados worldwide, the market is expected to continue an upward consumption trend over the next seven years. Market performance is forecast to decelerate, expanding with an anticipated CAGR of +3.9% for the period from 2023 to 2030, which is projected to bring the market volume to 12M tons by the end of 2030.
In value terms, the market is forecast to increase with an anticipated CAGR of +6.0% for the period from 2023 to 2030, which is projected to bring the market value to $29B (in nominal wholesale prices) by the end of 2030.
Consumption
World Consumption of Avocados
After ten years of growth, consumption of avocados decreased by -1.4% to 8.9M tons in 2023. Over the period under review, the total consumption indicated a prominent increase from 2013 to 2023: its volume increased at an average annual rate of +6.3% over the last decade. The trend pattern, however, indicated some noticeable fluctuations being recorded throughout the analyzed period. Based on 2023 figures, consumption increased by +83.8% against 2013 indices. Global consumption peaked at 9.1M tons in 2022, and then reduced slightly in the following year.
The global avocado market size reduced to $19.3B in 2023, approximately reflecting the previous year. This figure reflects the total revenues of producers and importers (excluding logistics costs, retail marketing costs, and retailers' margins, which will be included in the final consumer price). In general, the total consumption indicated resilient growth from 2013 to 2023: its value increased at an average annual rate of +7.5% over the last decade. The trend pattern, however, indicated some noticeable fluctuations being recorded throughout the analyzed period. Based on 2023 figures, consumption increased by +106.9% against 2013 indices. Over the period under review, the global market reached the peak level at $19.6B in 2022, and then declined modestly in the following year.
Consumption By Country
The countries with the highest volumes of consumption in 2023 were the United States (1.3M tons), Mexico (1.3M tons) and Colombia (938K tons), with a combined 40% share of global consumption. The Dominican Republic, Indonesia, Kenya, Brazil, Spain, Vietnam, Peru, China, Ethiopia and Haiti lagged somewhat behind, together comprising a further 33%.
From 2013 to 2023, the most notable rate of growth in terms of consumption, amongst the main consuming countries, was attained by Ethiopia (with a CAGR of +25.8%), while consumption for the other global leaders experienced more modest paces of growth.
In value terms, the United States ($3.1B), Mexico ($3.1B) and Colombia ($1.8B) were the countries with the highest levels of market value in 2023, with a combined 42% share of the global market. The Dominican Republic, China, Kenya, Spain, Vietnam, Brazil, Peru, Indonesia, Ethiopia and Haiti lagged somewhat behind, together accounting for a further 26%.
Ethiopia, with a CAGR of +35.7%, recorded the highest rates of growth with regard to market size among the main consuming countries over the period under review, while market for the other global leaders experienced more modest paces of growth.
In 2023, the highest levels of avocado per capita consumption was registered in the Dominican Republic (56 kg per person), followed by Colombia (18 kg per person), Haiti (15 kg per person) and Mexico (9.5 kg per person), while the world average per capita consumption of avocado was estimated at 1.1 kg per person.
From 2013 to 2023, the average annual rate of growth in terms of the avocado per capita consumption in the Dominican Republic stood at +4.5%. In the other countries, the average annual rates were as follows: Colombia (+11.1% per year) and Haiti (+5.5% per year).
Production
World Production of Avocados
After ten years of growth, production of avocados decreased by -2.3% to 8.8M tons in 2023. Overall, the total production indicated a strong increase from 2013 to 2023: its volume increased at an average annual rate of +6.2% over the last decade. The trend pattern, however, indicated some noticeable fluctuations being recorded throughout the analyzed period. Based on 2023 figures, production increased by +82.8% against 2013 indices. The growth pace was the most rapid in 2020 when the production volume increased by 9.9% against the previous year. Global production peaked at 9M tons in 2022, and then shrank slightly in the following year. The general positive trend in terms output was largely conditioned by buoyant growth of the harvested area and a modest increase in yield figures.
In value terms, avocado production totaled $18.8B in 2023 estimated in export price. Over the period under review, production, however, continues to indicate buoyant growth. The pace of growth was the most pronounced in 2017 when the production volume increased by 24%. Global production peaked at $18.9B in 2021; however, from 2022 to 2023, production stood at a somewhat lower figure.
Production By Country
The country with the largest volume of avocado production was Mexico (2.5M tons), accounting for 28% of total volume. Moreover, avocado production in Mexico exceeded the figures recorded by the second-largest producer, Colombia (1M tons), twofold. The third position in this ranking was taken by Peru (822K tons), with a 9.3% share.
From 2013 to 2023, the average annual rate of growth in terms of volume in Mexico totaled +5.4%. In the other countries, the average annual rates were as follows: Colombia (+13.4% per year) and Peru (+11.0% per year).
Yield
The global average avocado yield totaled 10 tons per ha in 2023, remaining constant against the year before. The yield figure increased at an average annual rate of +1.2% from 2013 to 2023; the trend pattern remained consistent, with only minor fluctuations being recorded in certain years. The most prominent rate of growth was recorded in 2014 with an increase of 4.5%. Over the period under review, the average avocado yield hit record highs in 2023 and is likely to continue growth in years to come.
Harvested Area
In 2023, approx. 862K ha of avocados were harvested worldwide; which is down by -2.5% on 2022. Over the period under review, the total harvested area indicated a perceptible expansion from 2013 to 2023: its figure increased at an average annual rate of +4.9% over the last decade. The trend pattern, however, indicated some noticeable fluctuations being recorded throughout the analyzed period. Based on 2023 figures, avocado harvested area increased by +61.5% against 2013 indices. The growth pace was the most rapid in 2016 with an increase of 10% against the previous year. Over the period under review, the harvested area dedicated to avocado production attained the maximum at 884K ha in 2022, and then contracted modestly in the following year.
Imports
World Imports of Avocados
In 2023, global imports of avocados amounted to 3.4M tons, with an increase of 11% against 2022 figures. Over the period under review, imports showed a resilient expansion. The most prominent rate of growth was recorded in 2015 with an increase of 18% against the previous year. Over the period under review, global imports reached the maximum in 2023 and are likely to see gradual growth in years to come.
In value terms, avocado imports totaled $8.9B in 2023. Overall, imports showed a resilient increase. The pace of growth was the most pronounced in 2016 when imports increased by 28% against the previous year. Global imports peaked in 2023 and are expected to retain growth in years to come.
Imports By Country
In 2023, the United States (1.3M tons) was the major importer of avocados, constituting 37% of total imports. The Netherlands (496K tons) held a 15% share (based on physical terms) of total imports, which put it in second place, followed by Spain (7.1%), France (5.6%) and Germany (4.5%). The UK (120K tons), Canada (110K tons), Chile (67K tons), China (66K tons) and Japan (62K tons) followed a long way behind the leaders.
From 2013 to 2023, average annual rates of growth with regard to avocado imports into the United States stood at +8.2%. At the same time, China (+45.9%), Chile (+32.9%), Spain (+19.4%), Germany (+17.3%), the Netherlands (+15.7%), the UK (+11.3%), France (+6.8%) and Canada (+6.7%) displayed positive paces of growth. Moreover, China emerged as the fastest-growing importer imported in the world, with a CAGR of +45.9% from 2013-2023. Japan experienced a relatively flat trend pattern. While the share of the Netherlands (+5.3 p.p.), Spain (+3.8 p.p.), Germany (+2 p.p.), China (+1.8 p.p.) and Chile (+1.6 p.p.) increased significantly in terms of the global imports from 2013-2023, the share of France (-2.4 p.p.), Japan (-3 p.p.) and the United States (-8.7 p.p.) displayed negative dynamics. The shares of the other countries remained relatively stable throughout the analyzed period.
In value terms, the United States ($3B), the Netherlands ($1.6B) and France ($614M) appeared to be the countries with the highest levels of imports in 2023, together comprising 58% of global imports. Spain, Germany, the UK, Canada, Japan, China and Chile lagged somewhat behind, together accounting for a further 23%.
In terms of the main importing countries, China, with a CAGR of +46.2%, recorded the highest rates of growth with regard to the value of imports, over the period under review, while purchases for the other global leaders experienced more modest paces of growth.
Import Prices By Country
The average avocado import price stood at $2,613 per ton in 2023, approximately mirroring the previous year. Over the period from 2013 to 2023, it increased at an average annual rate of +1.9%. The pace of growth was the most pronounced in 2017 an increase of 18%. As a result, import price reached the peak level of $2,926 per ton. From 2018 to 2023, the average import prices failed to regain momentum.
Prices varied noticeably by country of destination: amid the top importers, the country with the highest price was Germany ($3,449 per ton), while Chile ($1,419 per ton) was amongst the lowest.
From 2013 to 2023, the most notable rate of growth in terms of prices was attained by the Netherlands (+3.6%), while the other global leaders experienced more modest paces of growth.
Exports
World Exports of Avocados
In 2023, global exports of avocados totaled 3.3M tons, with an increase of 8.6% against 2022. Over the period under review, exports showed a prominent expansion. The most prominent rate of growth was recorded in 2016 with an increase of 24%. Over the period under review, the global exports attained the maximum in 2023 and are expected to retain growth in the near future.
In value terms, avocado exports rose modestly to $8.2B in 2023. In general, exports saw a resilient expansion. The pace of growth appeared the most rapid in 2016 when exports increased by 33% against the previous year. Over the period under review, the global exports reached the peak figure in 2023 and are expected to retain growth in the immediate term.
Exports By Country
In 2023, Mexico (1.2M tons) represented the key exporter of avocados, mixing up 37% of total exports. Peru (613K tons) held a 19% share (based on physical terms) of total exports, which put it in second place, followed by the Netherlands (13%). The following exporters - Spain (139K tons), Chile (100K tons), Colombia (98K tons), Kenya (97K tons), Israel (94K tons), South Africa (71K tons), the Dominican Republic (56K tons) and the United States (54K tons) - together made up 21% of total exports.
Exports from Mexico increased at an average annual rate of +8.1% from 2013 to 2023. At the same time, Colombia (+68.1%), the Netherlands (+16.9%), Peru (+16.2%), Kenya (+12.9%), the Dominican Republic (+10.5%), Spain (+8.0%), Israel (+4.1%), South Africa (+3.4%), the United States (+2.2%) and Chile (+1.2%) displayed positive paces of growth. Moreover, Colombia emerged as the fastest-growing exporter exported in the world, with a CAGR of +68.1% from 2013-2023. Peru (+7.4 p.p.), the Netherlands (+5.7 p.p.) and Colombia (+2.9 p.p.) significantly strengthened its position in terms of the global exports, while the United States, South Africa, Israel, Chile and Mexico saw its share reduced by -1.9%, -2%, -2.3%, -4.2% and -8.9% from 2013 to 2023, respectively. The shares of the other countries remained relatively stable throughout the analyzed period.
In value terms, Mexico ($2.9B), Peru ($1.4B) and the Netherlands ($1.4B) were the countries with the highest levels of exports in 2023, together comprising 70% of global exports. Spain, Israel, Chile, Kenya, Colombia, South Africa, the United States and the Dominican Republic lagged somewhat behind, together comprising a further 21%.
Colombia, with a CAGR of +66.4%, recorded the highest growth rate of the value of exports, in terms of the main exporting countries over the period under review, while shipments for the other global leaders experienced more modest paces of growth.
Export Prices By Country
In 2023, the average avocado export price amounted to $2,479 per ton, falling by -4.8% against the previous year. Over the period from 2013 to 2023, it increased at an average annual rate of +1.7%. The growth pace was the most rapid in 2017 an increase of 13%. The global export price peaked at $2,773 per ton in 2019; however, from 2020 to 2023, the export prices failed to regain momentum.
There were significant differences in the average prices amongst the major exporting countries. In 2023, amid the top suppliers, the country with the highest price was the Netherlands ($3,219 per ton), while the Dominican Republic ($1,588 per ton) was amongst the lowest.
From 2013 to 2023, the most notable rate of growth in terms of prices was attained by the Dominican Republic (+3.7%), while the other global leaders experienced more modest paces of growth.
This report provides an in-depth analysis of the global avocado market. Within it, you will discover the latest data on market trends and opportunities by country, consumption, production and price developments, as well as the global trade (imports and exports). The forecast exhibits the market prospects through 2030.
Product coverage:
- FCL 572 - Avocados
Country coverage:
Worldwide - the report contains statistical data for 200 countries and includes detailed profiles of the 50 largest consuming countries:
- USA
- China
- Japan
- Germany
- United Kingdom
- France
- Brazil
- Italy
- Russian Federation
- India
- Canada
- Australia
- Republic of Korea
- Spain
- Mexico
- Indonesia
- Netherlands
- Turkey
- Saudi Arabia
- Switzerland
- Sweden
- Nigeria
- Poland
- Belgium
- Argentina
- Norway
- Austria
- Thailand
- United Arab Emirates
- Colombia
- Denmark
- South Africa
- Malaysia
- Israel
- Singapore
- Egypt
- Philippines
- Finland
- Chile
- Ireland
- Pakistan
- Greece
- Portugal
- Kazakhstan
- Algeria
- Czech Republic
- Qatar
- Peru
- Romania
- Vietnam
+ the largest producing countries
Data coverage:
- Global market volume and value
- Per Capita consumption
- Forecast of the market dynamics in the medium term
- Global production, split by region and country
- Global trade (exports and imports)
- Export and import prices
- Market trends, drivers and restraints
- Key market players and their profiles
Reasons to buy this report:
- Take advantage of the latest data
- Find deeper insights into current market developments
- Discover vital success factors affecting the market
This report is designed for manufacturers, distributors, importers, and wholesalers, as well as for investors, consultants and advisors.
In this report, you can find information that helps you to make informed decisions on the following issues:
- How to diversify your business and benefit from new market opportunities
- How to load your idle production capacity
- How to boost your sales on overseas markets
- How to increase your profit margins
- How to make your supply chain more sustainable
- How to reduce your production and supply chain costs
- How to outsource production to other countries
- How to prepare your business for global expansion
While doing this research, we combine the accumulated expertise of our analysts and the capabilities of artificial intelligence. The AI-based platform, developed by our data scientists, constitutes the key working tool for business analysts, empowering them to discover deep insights and ideas from the marketing data.
-
1. INTRODUCTION
Making Data-Driven Decisions to Grow Your Business
- REPORT DESCRIPTION
- RESEARCH METHODOLOGY AND AI PLATFORM
- DATA-DRIVEN DECISIONS FOR YOUR BUSINESS
- GLOSSARY AND SPECIFIC TERMS
-
2. EXECUTIVE SUMMARY
A Quick Overview of Market Performance
- KEY FINDINGS
- MARKET TRENDS This Chapter is Available Only for the Professional Edition PRO
-
3. MARKET OVERVIEW
Understanding the Current State of The Market and Its Prospects
- MARKET SIZE
- CONSUMPTION BY COUNTRY
- MARKET FORECAST TO 2030
-
4. MOST PROMISING PRODUCT
Finding New Products to Diversify Your Business
This Chapter is Available Only for the Professional Edition PRO- TOP PRODUCTS TO DIVERSIFY YOUR BUSINESS
- BEST-SELLING PRODUCTS
- MOST CONSUMED PRODUCT
- MOST TRADED PRODUCT
- MOST PROFITABLE PRODUCT FOR EXPORT
-
5. MOST PROMISING SUPPLYING COUNTRIES
Choosing the Best Countries to Establish Your Sustainable Supply Chain
This Chapter is Available Only for the Professional Edition PRO- TOP COUNTRIES TO SOURCE YOUR PRODUCT
- TOP PRODUCING COUNTRIES
- COUNTRIES WITH TOP YIELDS
- TOP EXPORTING COUNTRIES
- LOW-COST EXPORTING COUNTRIES
-
6. MOST PROMISING OVERSEAS MARKETS
Choosing the Best Countries to Boost Your Exports
This Chapter is Available Only for the Professional Edition PRO- TOP OVERSEAS MARKETS FOR EXPORTING YOUR PRODUCT
- TOP CONSUMING MARKETS
- UNSATURATED MARKETS
- TOP IMPORTING MARKETS
- MOST PROFITABLE MARKETS
7. GLOBAL PRODUCTION
The Latest Trends and Insights into The Industry
- PRODUCTION VOLUME AND VALUE
- PRODUCTION BY COUNTRY
- HARVESTED AREA AND YIELD BY COUNTRY
8. GLOBAL IMPORTS
The Largest Importers on The Market and How They Succeed
- IMPORTS FROM 2012–2023
- IMPORTS BY COUNTRY
- IMPORT PRICES BY COUNTRY
9. GLOBAL EXPORTS
The Largest Exporters on The Market and How They Succeed
- EXPORTS FROM 2012–2023
- EXPORTS BY COUNTRY
- EXPORT PRICES BY COUNTRY
-
10. PROFILES OF MAJOR PRODUCERS
The Largest Producers on The Market and Their Profiles
This Chapter is Available Only for the Professional Edition PRO -
11. COUNTRY PROFILES
The Largest Markets And Their Profiles
This Chapter is Available Only for the Professional Edition PRO- United States
- China
- Japan
- Germany
- United Kingdom
- France
- Brazil
- Italy
- Russian Federation
- India
- Canada
- Australia
- Republic of Korea
- Spain
- Mexico
- Indonesia
- Netherlands
- Turkey
- Saudi Arabia
- Switzerland
- Sweden
- Nigeria
- Poland
- Belgium
- Argentina
- Norway
- Austria
- Thailand
- United Arab Emirates
- Colombia
- Denmark
- South Africa
- Malaysia
- Israel
- Singapore
- Egypt
- Philippines
- Finland
- Chile
- Ireland
- Pakistan
- Greece
- Portugal
- Kazakhstan
- Algeria
- Czech Republic
- Qatar
- Peru
- Romania
- Vietnam
-
LIST OF TABLES
- Key Findings In 2023
- Market Volume, In Physical Terms, 2012–2023
- Market Value, 2012–2023
- Per Capita Consumption, By Country, 2018–2023
- Production, In Physical Terms, By Country, 2012–2023
- Harvested Area, By Country, 2012-2023
- Yield, By Country, 2012-2023
- Imports, In Physical Terms, By Country, 2012–2023
- Imports, In Value Terms, By Country, 2012–2023
- Import Prices, By Country Of Destination, 2012–2023
- Exports, In Physical Terms, By Country, 2012–2023
- Exports, In Value Terms, By Country, 2012–2023
- Export Prices, By Country Of Origin, 2012–2023
-
LIST OF FIGURES
- Market Volume, In Physical Terms, 2012–2023
- Market Value, 2012–2023
- Consumption, By Country, 2023
- Market Volume Forecast to 2030
- Market Value Forecast to 2030
- Products: Market Size And Growth, By Type
- Products: Average Per Capita Consumption, By Type
- Products: Exports And Growth, By Type
- Products: Export Prices And Growth, By Type
- Production Volume And Growth
- Yield And Growth
- Exports And Growth
- Export Prices And Growth
- Market Size And Growth
- Per Capita Consumption
- Imports And Growth
- Import Prices
- Production, In Physical Terms, 2012–2023
- Production, In Value Terms, 2012–2023
- Area Harvested, 2012–2023
- Yield, 2012–2023
- Production, By Country, 2023
- Production, In Physical Terms, By Country, 2012–2023
- Harvested Area, By Country, 2023
- Harvested Area, By Country, 2012-2023
- Yield, By Country, 2012-2023
- Imports, In Physical Terms, 2012–2023
- Imports, In Value Terms, 2012–2023
- Imports, In Physical Terms, By Country, 2023
- Imports, In Physical Terms, By Country, 2012–2023
- Imports, In Value Terms, By Country, 2012–2023
- Import Prices, By Country, 2012–2023
- Exports, In Physical Terms, 2012–2023
- Exports, In Value Terms, 2012–2023
- Exports, In Physical Terms, By Country, 2023
- Exports, In Physical Terms, By Country, 2012–2023
- Exports, In Value Terms, By Country, 2012–2023
- Export Prices, 2012–2023


