World - Bauxite - Market Analysis, Forecast, Size, Trends And Insights
Get instant access to more than 2 million reports, dashboards, and datasets on the IndexBox Platform.
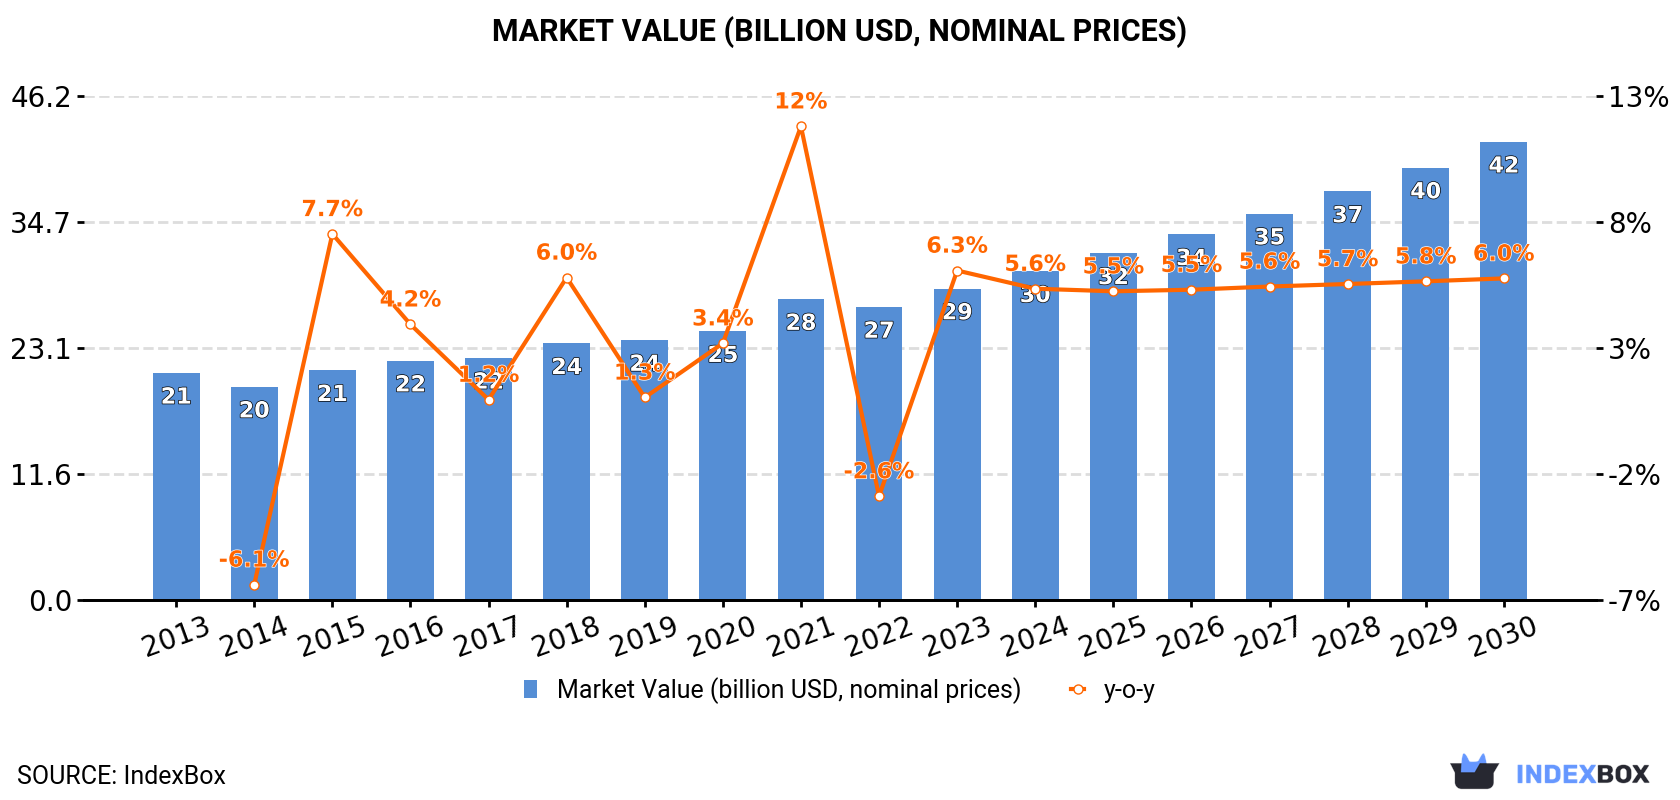
View PricingGlobal Bauxite Market Expected to Reach $42B by 2030 with Anticipated CAGR of +5.7%
IndexBox has just published a new report: World - Bauxite - Market Analysis, Forecast, Size, Trends And Insights.
The global bauxite market is expected to see a steady increase in demand over the next seven years, with market volume projected to reach 506M tons and market value estimated to hit $42B by 2030. China leads the market in both consumption and production of bauxite, while Guinea is the main player in exports. The market is anticipated to experience growth in the future due to various factors, including rising demand and fluctuating import and export prices.
Market Forecast
Market Forecast
Driven by increasing demand for bauxite worldwide, the market is expected to continue an upward consumption trend over the next seven-year period. Market performance is forecast to accelerate, expanding with an anticipated CAGR of +3.5% for the period from 2023 to 2030, which is projected to bring the market volume to 506M tons by the end of 2030.
In value terms, the market is forecast to increase with an anticipated CAGR of +5.7% for the period from 2023 to 2030, which is projected to bring the market value to $42B (in nominal prices) by the end of 2030.
Consumption
Consumption
Global bauxite consumption amounted to 399M tons in 2023, increasing by 4.9% against 2022. The total consumption volume increased at an average annual rate of +2.5% over the period from 2013 to 2023; however, the trend pattern indicated some noticeable fluctuations being recorded throughout the analyzed period. Global consumption peaked in 2023 and is likely to see steady growth in years to come.
The global bauxite market revenue totaled $28.6B in 2023, with an increase of 6.3% against the previous year. This figure reflects the total revenues of producers and importers (excluding logistics costs, retail marketing costs, and retailers' margins, which will be included in the final consumer price). The market value increased at an average annual rate of +3.2% from 2013 to 2023; however, the trend pattern indicated some noticeable fluctuations being recorded in certain years. Global consumption peaked in 2023 and is expected to retain growth in years to come.
Consumption By Country
China (200M tons) remains the largest bauxite consuming country worldwide, comprising approx. 50% of total volume. Moreover, bauxite consumption in China exceeded the figures recorded by the second-largest consumer, Australia (76M tons), threefold. Brazil (33M tons) ranked third in terms of total consumption with an 8.3% share.
From 2013 to 2023, the average annual rate of growth in terms of volume in China totaled +5.2%. In the other countries, the average annual rates were as follows: Australia (+1.8% per year) and Brazil (+2.6% per year).
In value terms, China ($12.7B) led the market, alone. The second position in the ranking was held by Australia ($2B). It was followed by Brazil.
From 2013 to 2023, the average annual growth rate of value in China stood at +5.4%. The remaining consuming countries recorded the following average annual rates of market growth: Australia (+1.0% per year) and Brazil (+6.3% per year).
In 2023, the highest levels of bauxite per capita consumption was registered in Australia (2,874 kg per person), followed by Guinea (664 kg per person), Brazil (152 kg per person) and China (141 kg per person), while the world average per capita consumption of bauxite was estimated at 50 kg per person.
From 2013 to 2023, the average annual growth rate of the bauxite per capita consumption in Australia was relatively modest. The remaining consuming countries recorded the following average annual rates of per capita consumption growth: Guinea (+27.7% per year) and Brazil (+1.9% per year).
Production
Production
In 2023, global production of bauxite reached 387M tons, flattening at the previous year. The total output volume increased at an average annual rate of +3.2% from 2013 to 2023; the trend pattern remained consistent, with somewhat noticeable fluctuations being observed in certain years. The pace of growth appeared the most rapid in 2014 with an increase of 7.8% against the previous year. Global production peaked at 391M tons in 2021; however, from 2022 to 2023, production failed to regain momentum.
In value terms, bauxite production amounted to $34B in 2023 estimated in export price. Over the period under review, production continues to indicate a relatively flat trend pattern. The most prominent rate of growth was recorded in 2021 with an increase of 11%. As a result, production reached the peak level of $34.8B. From 2022 to 2023, global production growth failed to regain momentum.
Production By Country
The countries with the highest volumes of production in 2023 were Australia (114M tons), Guinea (90M tons) and China (62M tons), with a combined 69% share of global production.
From 2013 to 2023, the most notable rate of growth in terms of production, amongst the main producing countries, was attained by Guinea (with a CAGR of +16.7%), while production for the other global leaders experienced more modest paces of growth.
Imports
Imports
Global bauxite imports rose slightly to 159M tons in 2023, growing by 4.7% compared with 2022. Overall, imports saw noticeable growth. The pace of growth appeared the most rapid in 2017 with an increase of 164% against the previous year. Global imports peaked in 2023 and are likely to continue growth in the near future.
In value terms, bauxite imports amounted to $9.9B in 2023. Over the period under review, imports enjoyed a buoyant expansion. The most prominent rate of growth was recorded in 2022 with an increase of 31%. Global imports peaked in 2023 and are expected to retain growth in the near future.
Imports By Country
China dominates imports structure, recording 138M tons, which was near 87% of total imports in 2023. The following importers - Canada (3.8M tons), Ireland (3.4M tons), the United States (3.4M tons) and India (3.3M tons) - each accounted for an 8.8% share of total imports.
From 2013 to 2023, average annual rates of growth with regard to bauxite imports into China stood at +7.0%. At the same time, India (+29.6%) displayed positive paces of growth. Moreover, India emerged as the fastest-growing importer imported in the world, with a CAGR of +29.6% from 2013-2023. Canada experienced a relatively flat trend pattern. By contrast, Ireland (-2.5%) and the United States (-11.8%) illustrated a downward trend over the same period. From 2013 to 2023, the share of China and India increased by +20 and +1.9 percentage points, respectively. The shares of the other countries remained relatively stable throughout the analyzed period.
In value terms, China ($8.4B) constitutes the largest market for imported bauxite worldwide, comprising 85% of global imports. The second position in the ranking was taken by India ($257M), with a 2.6% share of global imports. It was followed by Ireland, with a 2% share.
From 2013 to 2023, the average annual growth rate of value in China stood at +8.4%. The remaining importing countries recorded the following average annual rates of imports growth: India (+18.4% per year) and Ireland (-0.5% per year).
Import Prices By Country
In 2023, the average bauxite import price amounted to $62 per ton, rising by 1.6% against the previous year. In general, the import price enjoyed a slight increase. The pace of growth appeared the most rapid in 2016 when the average import price increased by 99%. As a result, import price attained the peak level of $107 per ton. From 2017 to 2023, the average import prices remained at a lower figure.
There were significant differences in the average prices amongst the major importing countries. In 2023, amid the top importers, the country with the highest price was India ($77 per ton), while Canada ($39 per ton) was amongst the lowest.
From 2013 to 2023, the most notable rate of growth in terms of prices was attained by Ireland (+2.0%), while the other global leaders experienced more modest paces of growth.
Exports
Exports
In 2023, global bauxite exports dropped modestly to 148M tons, with a decrease of -3.9% on 2022. In general, exports, however, enjoyed a strong expansion. The most prominent rate of growth was recorded in 2015 when exports increased by 38%. The global exports peaked at 154M tons in 2022, and then reduced slightly in the following year.
In value terms, bauxite exports declined to $7.4B in 2023. Overall, exports, however, saw a prominent increase. The pace of growth appeared the most rapid in 2017 when exports increased by 44% against the previous year. The global exports peaked at $8.2B in 2022, and then declined in the following year.
Exports By Country
In 2023, Guinea (80M tons) represented the main exporter of bauxite, comprising 54% of total exports. It was distantly followed by Australia (37M tons) and Indonesia (18M tons), together committing a 38% share of total exports. The following exporters - Brazil (2.6M tons), Turkey (2.6M tons) and Jamaica (2.5M tons) - each reached a 5.3% share of total exports.
Exports from Guinea increased at an average annual rate of +15.8% from 2013 to 2023. At the same time, Turkey (+28.5%) and Australia (+7.9%) displayed positive paces of growth. Moreover, Turkey emerged as the fastest-growing exporter exported in the world, with a CAGR of +28.5% from 2013-2023. Indonesia experienced a relatively flat trend pattern. By contrast, Jamaica (-6.0%) and Brazil (-10.9%) illustrated a downward trend over the same period. From 2013 to 2023, the share of Guinea, Australia and Turkey increased by +30, +2.5 and +1.5 percentage points, respectively.
In value terms, Guinea ($4.6B) remains the largest bauxite supplier worldwide, comprising 62% of global exports. The second position in the ranking was taken by Australia ($1.1B), with a 15% share of global exports. It was followed by Indonesia, with a 14% share.
From 2013 to 2023, the average annual growth rate of value in Guinea totaled +18.3%. In the other countries, the average annual rates were as follows: Australia (+7.9% per year) and Indonesia (+2.2% per year).
Export Prices By Country
The average bauxite export price stood at $50 per ton in 2023, with a decrease of -6.3% against the previous year. Over the last decade, it increased at an average annual rate of +1.9%. The growth pace was the most rapid in 2022 an increase of 22% against the previous year. As a result, the export price reached the peak level of $53 per ton, and then fell in the following year.
Prices varied noticeably by country of origin: amid the top suppliers, the country with the highest price was Brazil ($66 per ton), while Jamaica ($29 per ton) was amongst the lowest.
From 2013 to 2023, the most notable rate of growth in terms of prices was attained by Brazil (+5.1%), while the other global leaders experienced more modest paces of growth.
This report provides an in-depth analysis of the global bauxite market. Within it, you will discover the latest data on market trends and opportunities by country, consumption, production and price developments, as well as the global trade (imports and exports). The forecast exhibits the market prospects through 2030.
Product coverage:
- Prodcom 07291300 - Aluminium ores and concentrates
Country coverage:
Worldwide - the report contains statistical data for 200 countries and includes detailed profiles of the 50 largest consuming countries:
- USA
- China
- Japan
- Germany
- United Kingdom
- France
- Brazil
- Italy
- Russian Federation
- India
- Canada
- Australia
- Republic of Korea
- Spain
- Mexico
- Indonesia
- Netherlands
- Turkey
- Saudi Arabia
- Switzerland
- Sweden
- Nigeria
- Poland
- Belgium
- Argentina
- Norway
- Austria
- Thailand
- United Arab Emirates
- Colombia
- Denmark
- South Africa
- Malaysia
- Israel
- Singapore
- Egypt
- Philippines
- Finland
- Chile
- Ireland
- Pakistan
- Greece
- Portugal
- Kazakhstan
- Algeria
- Czech Republic
- Qatar
- Peru
- Romania
- Vietnam
+ the largest producing countries
Data coverage:
- Global market volume and value
- Per Capita consumption
- Forecast of the market dynamics in the medium term
- Global production, split by region and country
- Global trade (exports and imports)
- Export and import prices
- Market trends, drivers and restraints
- Key market players and their profiles
Company coverage:
Reasons to buy this report:
- Take advantage of the latest data
- Find deeper insights into current market developments
- Discover vital success factors affecting the market
This report is designed for manufacturers, distributors, importers, and wholesalers, as well as for investors, consultants and advisors.
In this report, you can find information that helps you to make informed decisions on the following issues:
- How to diversify your business and benefit from new market opportunities
- How to load your idle production capacity
- How to boost your sales on overseas markets
- How to increase your profit margins
- How to make your supply chain more sustainable
- How to reduce your production and supply chain costs
- How to outsource production to other countries
- How to prepare your business for global expansion
While doing this research, we combine the accumulated expertise of our analysts and the capabilities of artificial intelligence. The AI-based platform, developed by our data scientists, constitutes the key working tool for business analysts, empowering them to discover deep insights and ideas from the marketing data.
-
1. INTRODUCTION
Making Data-Driven Decisions to Grow Your Business
- REPORT DESCRIPTION
- RESEARCH METHODOLOGY AND AI PLATFORM
- DATA-DRIVEN DECISIONS FOR YOUR BUSINESS
- GLOSSARY AND SPECIFIC TERMS
-
2. EXECUTIVE SUMMARY
A Quick Overview of Market Performance
- KEY FINDINGS
- MARKET TRENDS This Chapter is Available Only for the Professional Edition PRO
-
3. MARKET OVERVIEW
Understanding the Current State of The Market and Its Prospects
- MARKET SIZE
- CONSUMPTION BY COUNTRY
- MARKET FORECAST TO 2030
-
4. MOST PROMISING PRODUCT
Finding New Products to Diversify Your Business
This Chapter is Available Only for the Professional Edition PRO- TOP PRODUCTS TO DIVERSIFY YOUR BUSINESS
- BEST-SELLING PRODUCTS
- MOST CONSUMED PRODUCT
- MOST TRADED PRODUCT
- MOST PROFITABLE PRODUCT FOR EXPORT
-
5. MOST PROMISING SUPPLYING COUNTRIES
Choosing the Best Countries to Establish Your Sustainable Supply Chain
This Chapter is Available Only for the Professional Edition PRO- TOP COUNTRIES TO SOURCE YOUR PRODUCT
- TOP PRODUCING COUNTRIES
- TOP EXPORTING COUNTRIES
- LOW-COST EXPORTING COUNTRIES
-
6. MOST PROMISING OVERSEAS MARKETS
Choosing the Best Countries to Boost Your Exports
This Chapter is Available Only for the Professional Edition PRO- TOP OVERSEAS MARKETS FOR EXPORTING YOUR PRODUCT
- TOP CONSUMING MARKETS
- UNSATURATED MARKETS
- TOP IMPORTING MARKETS
- MOST PROFITABLE MARKETS
7. GLOBAL PRODUCTION
The Latest Trends and Insights into The Industry
- PRODUCTION VOLUME AND VALUE
- PRODUCTION BY COUNTRY
8. GLOBAL IMPORTS
The Largest Importers on The Market and How They Succeed
- IMPORTS FROM 2012–2023
- IMPORTS BY COUNTRY
- IMPORT PRICES BY COUNTRY
9. GLOBAL EXPORTS
The Largest Exporters on The Market and How They Succeed
- EXPORTS FROM 2012–2023
- EXPORTS BY COUNTRY
- EXPORT PRICES BY COUNTRY
-
10. PROFILES OF MAJOR PRODUCERS
The Largest Producers on The Market and Their Profiles
This Chapter is Available Only for the Professional Edition PRO -
11. COUNTRY PROFILES
The Largest Markets And Their Profiles
This Chapter is Available Only for the Professional Edition PRO- United States
- China
- Japan
- Germany
- United Kingdom
- France
- Brazil
- Italy
- Russian Federation
- India
- Canada
- Australia
- Republic of Korea
- Spain
- Mexico
- Indonesia
- Netherlands
- Turkey
- Saudi Arabia
- Switzerland
- Sweden
- Nigeria
- Poland
- Belgium
- Argentina
- Norway
- Austria
- Thailand
- United Arab Emirates
- Colombia
- Denmark
- South Africa
- Malaysia
- Israel
- Singapore
- Egypt
- Philippines
- Finland
- Chile
- Ireland
- Pakistan
- Greece
- Portugal
- Kazakhstan
- Algeria
- Czech Republic
- Qatar
- Peru
- Romania
- Vietnam
-
LIST OF TABLES
- Key Findings In 2023
- Market Volume, In Physical Terms, 2012–2023
- Market Value, 2012–2023
- Per Capita Consumption, By Country, 2018–2023
- Production, In Physical Terms, By Country, 2012–2023
- Imports, In Physical Terms, By Country, 2012–2023
- Imports, In Value Terms, By Country, 2012–2023
- Import Prices, By Country Of Destination, 2012–2023
- Exports, In Physical Terms, By Country, 2012–2023
- Exports, In Value Terms, By Country, 2012–2023
- Export Prices, By Country Of Origin, 2012–2023
-
LIST OF FIGURES
- Market Volume, In Physical Terms, 2012–2023
- Market Value, 2012–2023
- Consumption, By Country, 2023
- Market Volume Forecast to 2030
- Market Value Forecast to 2030
- Products: Market Size And Growth, By Type
- Products: Average Per Capita Consumption, By Type
- Products: Exports And Growth, By Type
- Products: Export Prices And Growth, By Type
- Production Volume And Growth
- Exports And Growth
- Export Prices And Growth
- Market Size And Growth
- Per Capita Consumption
- Imports And Growth
- Import Prices
- Production, In Physical Terms, 2012–2023
- Production, In Value Terms, 2012–2023
- Production, By Country, 2023
- Production, In Physical Terms, By Country, 2012–2023
- Imports, In Physical Terms, 2012–2023
- Imports, In Value Terms, 2012–2023
- Imports, In Physical Terms, By Country, 2023
- Imports, In Physical Terms, By Country, 2012–2023
- Imports, In Value Terms, By Country, 2012–2023
- Import Prices, By Country, 2012–2023
- Exports, In Physical Terms, 2012–2023
- Exports, In Value Terms, 2012–2023
- Exports, In Physical Terms, By Country, 2023
- Exports, In Physical Terms, By Country, 2012–2023
- Exports, In Value Terms, By Country, 2012–2023
- Export Prices, 2012–2023


