
World - Blueberries And Cranberries - Market Analysis, Forecast, Size, Trends and Insights
Get instant access to more than 2 million reports, dashboards, and datasets on the IndexBox Platform.
View PricingGlobal Blueberries and Cranberries Market to Witness Significant Growth with +3.9% CAGR from 2023 to 2030
IndexBox has just published a new report: World - Blueberries And Cranberries - Market Analysis, Forecast, Size, Trends and Insights.
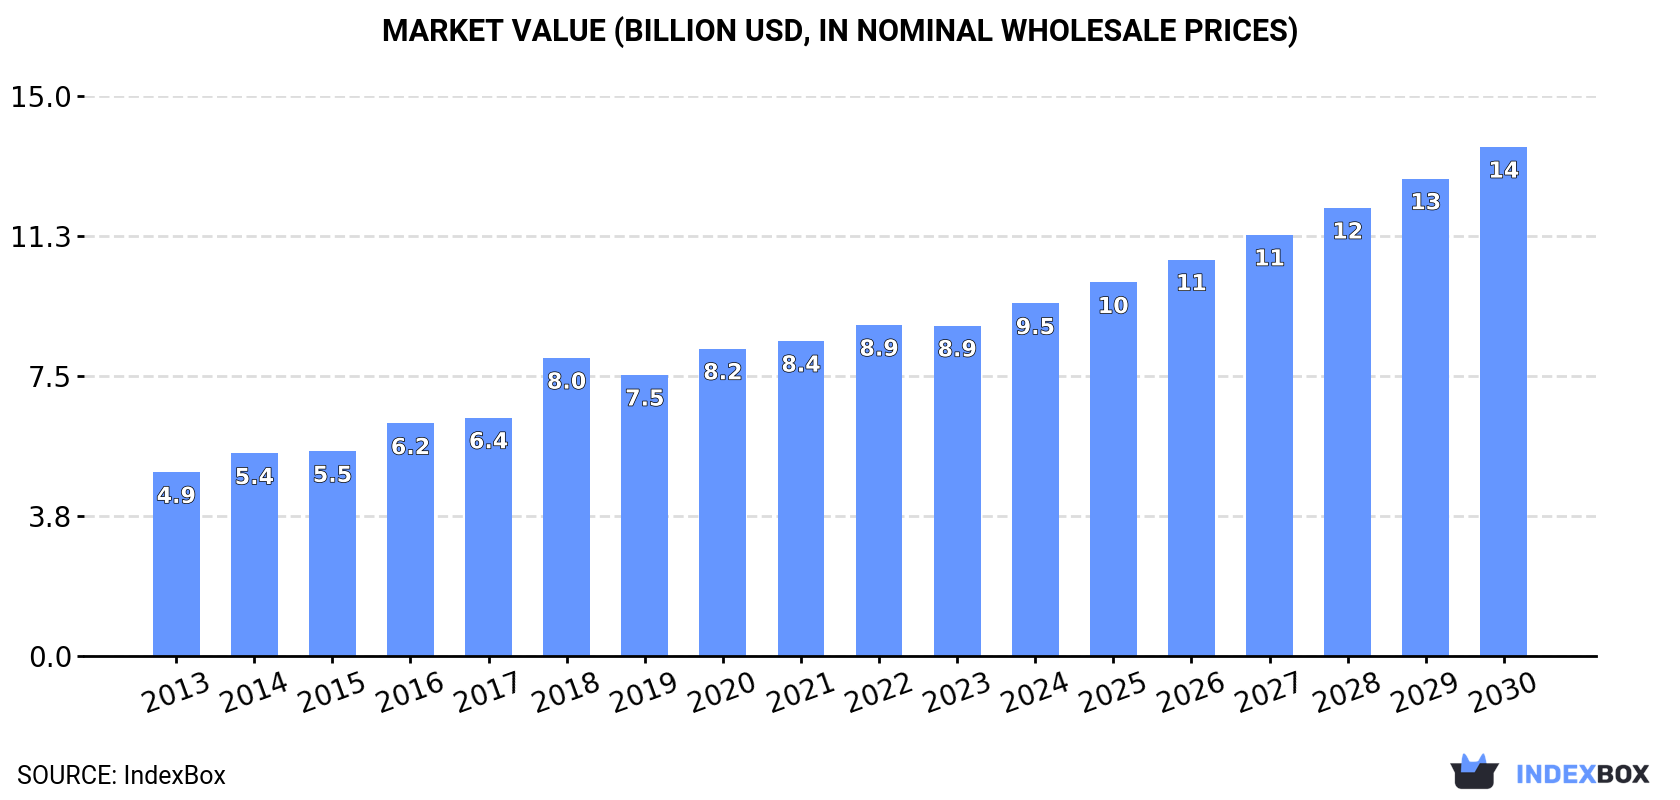
Driven by rising demand worldwide, the market for blueberries and cranberries is set to expand with a forecasted CAGR of +3.9% in volume and +6.4% in value from 2023 to 2030. By the end of 2030, the market volume is expected to reach 2.4M tons and the market value to reach $13.6B.
Market Forecast
Driven by increasing demand for blueberries and cranberries worldwide, the market is expected to continue an upward consumption trend over the next seven years. Market performance is forecast to retain its current trend pattern, expanding with an anticipated CAGR of +3.9% for the period from 2023 to 2030, which is projected to bring the market volume to 2.4M tons by the end of 2030.
In value terms, the market is forecast to increase with an anticipated CAGR of +6.4% for the period from 2023 to 2030, which is projected to bring the market value to $13.6B (in nominal wholesale prices) by the end of 2030.
Consumption
World Consumption of Blueberries and Cranberries
In 2023, consumption of blueberries and cranberries decreased by -4.7% to 1.9M tons for the first time since 2017, thus ending a five-year rising trend. In general, the total consumption indicated noticeable growth from 2013 to 2023: its volume increased at an average annual rate of +4.5% over the last decade. The trend pattern, however, indicated some noticeable fluctuations being recorded throughout the analyzed period. Based on 2023 figures, consumption increased by +56.0% against 2013 indices. Over the period under review, global consumption attained the maximum volume at 2M tons in 2022, and then shrank modestly in the following year.
The global blueberry and cranberry market value declined to $8.9B in 2023, approximately equating the previous year. This figure reflects the total revenues of producers and importers (excluding logistics costs, retail marketing costs, and retailers' margins, which will be included in the final consumer price). Overall, the total consumption indicated resilient growth from 2013 to 2023: its value increased at an average annual rate of +6.0% over the last decade. The trend pattern, however, indicated some noticeable fluctuations being recorded throughout the analyzed period. Based on 2023 figures, consumption increased by +79.7% against 2013 indices. Global consumption peaked at $8.9B in 2022, and then reduced modestly in the following year.
Consumption By Country
The United States (922K tons) constituted the country with the largest volume of blueberry and cranberry consumption, comprising approx. 50% of total volume. Moreover, blueberry and cranberry consumption in the United States exceeded the figures recorded by the second-largest consumer, Canada (323K tons), threefold. Chile (80K tons) ranked third in terms of total consumption with a 4.3% share.
In the United States, blueberry and cranberry consumption increased at an average annual rate of +2.0% over the period from 2013-2023. In the other countries, the average annual rates were as follows: Canada (+5.1% per year) and Chile (+29.9% per year).
In value terms, the United States ($4.3B) led the market, alone. The second position in the ranking was held by Canada ($652M). It was followed by Germany.
From 2013 to 2023, the average annual growth rate of value in the United States stood at +3.4%. The remaining consuming countries recorded the following average annual rates of market growth: Canada (+4.7% per year) and Germany (+14.2% per year).
The countries with the highest levels of blueberry and cranberry per capita consumption in 2023 were Canada (8.3 kg per person), Chile (4.1 kg per person) and the United States (2.7 kg per person).
From 2013 to 2023, the most notable rate of growth in terms of consumption, amongst the main consuming countries, was attained by Chile (with a CAGR of +28.7%), while consumption for the other global leaders experienced more modest paces of growth.
Production
World Production of Blueberries and Cranberries
In 2023, after five years of growth, there was significant decline in production of blueberries and cranberries, when its volume decreased by -5.1% to 1.9M tons. Overall, the total production indicated measured growth from 2013 to 2023: its volume increased at an average annual rate of +4.7% over the last decade. The trend pattern, however, indicated some noticeable fluctuations being recorded throughout the analyzed period. Based on 2023 figures, production increased by +58.7% against 2013 indices. The pace of growth appeared the most rapid in 2016 when the production volume increased by 15% against the previous year. Over the period under review, global production attained the maximum volume at 2M tons in 2022, and then declined in the following year. The general positive trend in terms output was largely conditioned by a measured increase of the harvested area and a relatively flat trend pattern in yield figures.
In value terms, blueberry and cranberry production amounted to $8.3B in 2023 estimated in export price. Over the period under review, the total production indicated a resilient increase from 2013 to 2023: its value increased at an average annual rate of +5.8% over the last decade. The trend pattern, however, indicated some noticeable fluctuations being recorded throughout the analyzed period. Based on 2023 figures, production decreased by -1.2% against 2021 indices. The most prominent rate of growth was recorded in 2018 with an increase of 20%. Over the period under review, global production reached the peak level at $8.3B in 2021; afterwards, it flattened through to 2023.
Production By Country
The countries with the highest volumes of production in 2023 were the United States (673K tons), Canada (346K tons) and Peru (319K tons), with a combined 71% share of global production.
From 2013 to 2023, the biggest increases were recorded for Peru (with a CAGR of +27.9%), while production for the other global leaders experienced more modest paces of growth.
Yield
The global average blueberry and cranberry yield dropped to 9.9 tons per ha in 2023, waning by -2.5% on 2022 figures. Over the period under review, the yield, however, showed a relatively flat trend pattern. The most prominent rate of growth was recorded in 2016 with an increase of 7.8%. Over the period under review, the average blueberry and cranberry yield hit record highs at 10 tons per ha in 2022, and then shrank in the following year.
Harvested Area
The global blueberry and cranberry harvested area dropped modestly to 192K ha in 2023, reducing by -2.6% on the previous year's figure. The harvested area increased at an average annual rate of +4.0% from 2013 to 2023; however, the trend pattern indicated some noticeable fluctuations being recorded throughout the analyzed period. The most prominent rate of growth was recorded in 2019 with an increase of 10%. Over the period under review, the harvested area dedicated to blueberry and cranberry production reached the maximum at 197K ha in 2022, and then shrank in the following year.
Imports
World Imports of Blueberries and Cranberries
After ten years of growth, overseas purchases of blueberries and cranberries decreased by -14% to 838K tons in 2023. In general, imports, however, showed a strong expansion. The most prominent rate of growth was recorded in 2018 with an increase of 32%. Over the period under review, global imports reached the maximum at 974K tons in 2022, and then fell in the following year.
In value terms, blueberry and cranberry imports rose slightly to $5.7B in 2023. Over the period under review, imports, however, recorded a resilient expansion. The most prominent rate of growth was recorded in 2016 with an increase of 28% against the previous year. Over the period under review, global imports hit record highs in 2023 and are likely to see steady growth in the near future.
Imports By Country
The United States represented the major importer of blueberries and cranberries in the world, with the volume of imports amounting to 307K tons, which was approx. 37% of total imports in 2023. It was distantly followed by the Netherlands (105K tons), Germany (64K tons), Canada (59K tons), the UK (58K tons) and Spain (39K tons), together generating a 39% share of total imports. China (30K tons), Poland (21K tons), France (16K tons), Hong Kong SAR (16K tons) and Italy (14K tons) followed a long way behind the leaders.
From 2013 to 2023, average annual rates of growth with regard to blueberry and cranberry imports into the United States stood at +6.4%. At the same time, Spain (+29.0%), China (+28.1%), Poland (+27.7%), the Netherlands (+22.2%), France (+18.2%), Germany (+18.0%), Hong Kong SAR (+17.9%), Italy (+14.0%) and the UK (+8.9%) displayed positive paces of growth. Moreover, Spain emerged as the fastest-growing importer imported in the world, with a CAGR of +29.0% from 2013-2023. Canada experienced a relatively flat trend pattern. While the share of the Netherlands (+8.2 p.p.), Germany (+3.9 p.p.), Spain (+3.7 p.p.), China (+2.8 p.p.) and Poland (+1.9 p.p.) increased significantly in terms of the global imports from 2013-2023, the share of Canada (-9.7 p.p.) and the United States (-14.4 p.p.) displayed negative dynamics. The shares of the other countries remained relatively stable throughout the analyzed period.
In value terms, the United States ($1.9B) constitutes the largest market for imported blueberries and cranberries worldwide, comprising 33% of global imports. The second position in the ranking was held by the Netherlands ($750M), with a 13% share of global imports. It was followed by Germany, with an 8.6% share.
In the United States, blueberry and cranberry imports expanded at an average annual rate of +11.7% over the period from 2013-2023. The remaining importing countries recorded the following average annual rates of imports growth: the Netherlands (+22.3% per year) and Germany (+18.4% per year).
Import Prices By Country
The average blueberry and cranberry import price stood at $6,756 per ton in 2023, with an increase of 20% against the previous year. Over the period from 2013 to 2023, it increased at an average annual rate of +3.4%. As a result, import price reached the peak level and is likely to continue growth in the immediate term.
Prices varied noticeably by country of destination: amid the top importers, the country with the highest price was China ($8,796 per ton), while Canada ($5,298 per ton) was amongst the lowest.
From 2013 to 2023, the most notable rate of growth in terms of prices was attained by Poland (+5.4%), while the other global leaders experienced more modest paces of growth.
Exports
World Exports of Blueberries and Cranberries
In 2023, after five years of growth, there was significant decline in overseas shipments of blueberries and cranberries, when their volume decreased by -14.3% to 872K tons. In general, exports, however, showed a strong expansion. The pace of growth appeared the most rapid in 2018 when exports increased by 27% against the previous year. The global exports peaked at 1M tons in 2022, and then declined in the following year.
In value terms, blueberry and cranberry exports expanded slightly to $5.5B in 2023. Over the period under review, exports, however, recorded a resilient increase. The pace of growth appeared the most rapid in 2018 when exports increased by 27%. Over the period under review, the global exports reached the peak figure in 2023 and are expected to retain growth in the near future.
Exports By Country
Peru was the key exporter of blueberries and cranberries in the world, with the volume of exports resulting at 263K tons, which was near 30% of total exports in 2023. The Netherlands (96K tons) held the second position in the ranking, followed by Canada (82K tons), Spain (74K tons), the United States (58K tons), Mexico (55K tons), Morocco (54K tons) and Chile (48K tons). All these countries together took approx. 54% share of total exports. South Africa (26K tons) held a little share of total exports.
Peru was also the fastest-growing in terms of the blueberries and cranberries exports, with a CAGR of +67.5% from 2013 to 2023. At the same time, Mexico (+34.6%), South Africa (+33.1%), Morocco (+27.6%), the Netherlands (+23.2%) and Spain (+17.1%) displayed positive paces of growth. The United States and Canada experienced a relatively flat trend pattern. By contrast, Chile (-5.1%) illustrated a downward trend over the same period. From 2013 to 2023, the share of Peru, the Netherlands, Mexico, Morocco, Spain and South Africa increased by +30, +7.3, +5.4, +4.7, +3.8 and +2.6 percentage points, respectively.
In value terms, Peru ($1.6B) remains the largest blueberry and cranberry supplier worldwide, comprising 28% of global exports. The second position in the ranking was held by the Netherlands ($760M), with a 14% share of global exports. It was followed by Morocco, with an 11% share.
In Peru, blueberry and cranberry exports increased at an average annual rate of +56.8% over the period from 2013-2023. In the other countries, the average annual rates were as follows: the Netherlands (+20.5% per year) and Morocco (+34.7% per year).
Export Prices By Country
In 2023, the average blueberry and cranberry export price amounted to $6,360 per ton, rising by 19% against the previous year. Over the last decade, it increased at an average annual rate of +3.1%. As a result, the export price attained the peak level and is likely to continue growth in the immediate term.
There were significant differences in the average prices amongst the major exporting countries. In 2023, amid the top suppliers, the country with the highest price was Morocco ($11,527 per ton), while Canada ($2,347 per ton) was amongst the lowest.
From 2013 to 2023, the most notable rate of growth in terms of prices was attained by Morocco (+5.6%), while the other global leaders experienced more modest paces of growth.
This report provides an in-depth analysis of the global blueberry and cranberry market. Within it, you will discover the latest data on market trends and opportunities by country, consumption, production and price developments, as well as the global trade (imports and exports). The forecast exhibits the market prospects through 2030.
Product coverage:
- FCL 552 - Blueberries
- FCL 554 - Cranberries
Country coverage:
Worldwide - the report contains statistical data for 200 countries and includes detailed profiles of the 50 largest consuming countries:
- USA
- China
- Japan
- Germany
- United Kingdom
- France
- Brazil
- Italy
- Russian Federation
- India
- Canada
- Australia
- Republic of Korea
- Spain
- Mexico
- Indonesia
- Netherlands
- Turkey
- Saudi Arabia
- Switzerland
- Sweden
- Nigeria
- Poland
- Belgium
- Argentina
- Norway
- Austria
- Thailand
- United Arab Emirates
- Colombia
- Denmark
- South Africa
- Malaysia
- Israel
- Singapore
- Egypt
- Philippines
- Finland
- Chile
- Ireland
- Pakistan
- Greece
- Portugal
- Kazakhstan
- Algeria
- Czech Republic
- Qatar
- Peru
- Romania
- Vietnam
+ the largest producing countries
Data coverage:
- Global market volume and value
- Per Capita consumption
- Forecast of the market dynamics in the medium term
- Global production, split by region and country
- Global trade (exports and imports)
- Export and import prices
- Market trends, drivers and restraints
- Key market players and their profiles
Reasons to buy this report:
- Take advantage of the latest data
- Find deeper insights into current market developments
- Discover vital success factors affecting the market
This report is designed for manufacturers, distributors, importers, and wholesalers, as well as for investors, consultants and advisors.
In this report, you can find information that helps you to make informed decisions on the following issues:
- How to diversify your business and benefit from new market opportunities
- How to load your idle production capacity
- How to boost your sales on overseas markets
- How to increase your profit margins
- How to make your supply chain more sustainable
- How to reduce your production and supply chain costs
- How to outsource production to other countries
- How to prepare your business for global expansion
While doing this research, we combine the accumulated expertise of our analysts and the capabilities of artificial intelligence. The AI-based platform, developed by our data scientists, constitutes the key working tool for business analysts, empowering them to discover deep insights and ideas from the marketing data.
-
1. INTRODUCTION
Making Data-Driven Decisions to Grow Your Business
- REPORT DESCRIPTION
- RESEARCH METHODOLOGY AND AI PLATFORM
- DATA-DRIVEN DECISIONS FOR YOUR BUSINESS
- GLOSSARY AND SPECIFIC TERMS
-
2. EXECUTIVE SUMMARY
A Quick Overview of Market Performance
- KEY FINDINGS
- MARKET TRENDS This Chapter is Available Only for the Professional Edition PRO
-
3. MARKET OVERVIEW
Understanding the Current State of The Market and Its Prospects
- MARKET SIZE
- CONSUMPTION BY COUNTRY
- MARKET FORECAST TO 2030
-
4. MOST PROMISING PRODUCT
Finding New Products to Diversify Your Business
This Chapter is Available Only for the Professional Edition PRO- TOP PRODUCTS TO DIVERSIFY YOUR BUSINESS
- BEST-SELLING PRODUCTS
- MOST CONSUMED PRODUCT
- MOST TRADED PRODUCT
- MOST PROFITABLE PRODUCT FOR EXPORT
-
5. MOST PROMISING SUPPLYING COUNTRIES
Choosing the Best Countries to Establish Your Sustainable Supply Chain
This Chapter is Available Only for the Professional Edition PRO- TOP COUNTRIES TO SOURCE YOUR PRODUCT
- TOP PRODUCING COUNTRIES
- COUNTRIES WITH TOP YIELDS
- TOP EXPORTING COUNTRIES
- LOW-COST EXPORTING COUNTRIES
-
6. MOST PROMISING OVERSEAS MARKETS
Choosing the Best Countries to Boost Your Exports
This Chapter is Available Only for the Professional Edition PRO- TOP OVERSEAS MARKETS FOR EXPORTING YOUR PRODUCT
- TOP CONSUMING MARKETS
- UNSATURATED MARKETS
- TOP IMPORTING MARKETS
- MOST PROFITABLE MARKETS
7. GLOBAL PRODUCTION
The Latest Trends and Insights into The Industry
- PRODUCTION VOLUME AND VALUE
- PRODUCTION BY COUNTRY
- HARVESTED AREA AND YIELD BY COUNTRY
8. GLOBAL IMPORTS
The Largest Importers on The Market and How They Succeed
- IMPORTS FROM 2012–2023
- IMPORTS BY COUNTRY
- IMPORT PRICES BY COUNTRY
9. GLOBAL EXPORTS
The Largest Exporters on The Market and How They Succeed
- EXPORTS FROM 2012–2023
- EXPORTS BY COUNTRY
- EXPORT PRICES BY COUNTRY
-
10. PROFILES OF MAJOR PRODUCERS
The Largest Producers on The Market and Their Profiles
This Chapter is Available Only for the Professional Edition PRO -
11. COUNTRY PROFILES
The Largest Markets And Their Profiles
This Chapter is Available Only for the Professional Edition PRO- United States
- China
- Japan
- Germany
- United Kingdom
- France
- Brazil
- Italy
- Russian Federation
- India
- Canada
- Australia
- Republic of Korea
- Spain
- Mexico
- Indonesia
- Netherlands
- Turkey
- Saudi Arabia
- Switzerland
- Sweden
- Nigeria
- Poland
- Belgium
- Argentina
- Norway
- Austria
- Thailand
- United Arab Emirates
- Colombia
- Denmark
- South Africa
- Malaysia
- Israel
- Singapore
- Egypt
- Philippines
- Finland
- Chile
- Ireland
- Pakistan
- Greece
- Portugal
- Kazakhstan
- Algeria
- Czech Republic
- Qatar
- Peru
- Romania
- Vietnam
-
LIST OF TABLES
- Key Findings In 2023
- Market Volume, In Physical Terms, 2012–2023
- Market Value, 2012–2023
- Per Capita Consumption, By Country, 2018–2023
- Production, In Physical Terms, By Country, 2012–2023
- Harvested Area, By Country, 2012-2023
- Yield, By Country, 2012-2023
- Imports, In Physical Terms, By Country, 2012–2023
- Imports, In Value Terms, By Country, 2012–2023
- Import Prices, By Country Of Destination, 2012–2023
- Exports, In Physical Terms, By Country, 2012–2023
- Exports, In Value Terms, By Country, 2012–2023
- Export Prices, By Country Of Origin, 2012–2023
-
LIST OF FIGURES
- Market Volume, In Physical Terms, 2012–2023
- Market Value, 2012–2023
- Consumption, By Country, 2023
- Market Volume Forecast to 2030
- Market Value Forecast to 2030
- Products: Market Size And Growth, By Type
- Products: Average Per Capita Consumption, By Type
- Products: Exports And Growth, By Type
- Products: Export Prices And Growth, By Type
- Production Volume And Growth
- Yield And Growth
- Exports And Growth
- Export Prices And Growth
- Market Size And Growth
- Per Capita Consumption
- Imports And Growth
- Import Prices
- Production, In Physical Terms, 2012–2023
- Production, In Value Terms, 2012–2023
- Area Harvested, 2012–2023
- Yield, 2012–2023
- Production, By Country, 2023
- Production, In Physical Terms, By Country, 2012–2023
- Harvested Area, By Country, 2023
- Harvested Area, By Country, 2012-2023
- Yield, By Country, 2012-2023
- Imports, In Physical Terms, 2012–2023
- Imports, In Value Terms, 2012–2023
- Imports, In Physical Terms, By Country, 2023
- Imports, In Physical Terms, By Country, 2012–2023
- Imports, In Value Terms, By Country, 2012–2023
- Import Prices, By Country, 2012–2023
- Exports, In Physical Terms, 2012–2023
- Exports, In Value Terms, 2012–2023
- Exports, In Physical Terms, By Country, 2023
- Exports, In Physical Terms, By Country, 2012–2023
- Exports, In Value Terms, By Country, 2012–2023
- Export Prices, 2012–2023


