Brazil - Meat And Poultry - Market Analysis, Forecast, Size, Trends and Insights
Get instant access to more than 2 million reports, dashboards, and datasets on the IndexBox Platform.
View PricingMeat and Poultry Export in Brazil Declines by 9%, Drops to $21.1B in 2023
Brazil Meat And Poultry Exports
In 2023, the amount of meat and poultry exported from Brazil was estimated at 7.9M tons, with an increase of 6.2% against the previous year's figure. The total export volume increased at an average annual rate of +4.1% over the period from 2013 to 2023; however, the trend pattern indicated some noticeable fluctuations being recorded throughout the analyzed period. The most prominent rate of growth was recorded in 2019 with an increase of 16%. The exports peaked in 2023 and are likely to see steady growth in the immediate term.
In value terms, meat and poultry exports declined to $21.1B (IndexBox estimates) in 2023. Over the period under review, total exports indicated a tangible increase from 2013 to 2023: its value increased at an average annual rate of +4.4% over the last decade. The trend pattern, however, indicated some noticeable fluctuations being recorded throughout the analyzed period. Based on 2023 figures, exports increased by +78.4% against 2016 indices. The growth pace was the most rapid in 2022 with an increase of 27% against the previous year. As a result, the exports reached the peak of $23.1B, and then shrank in the following year.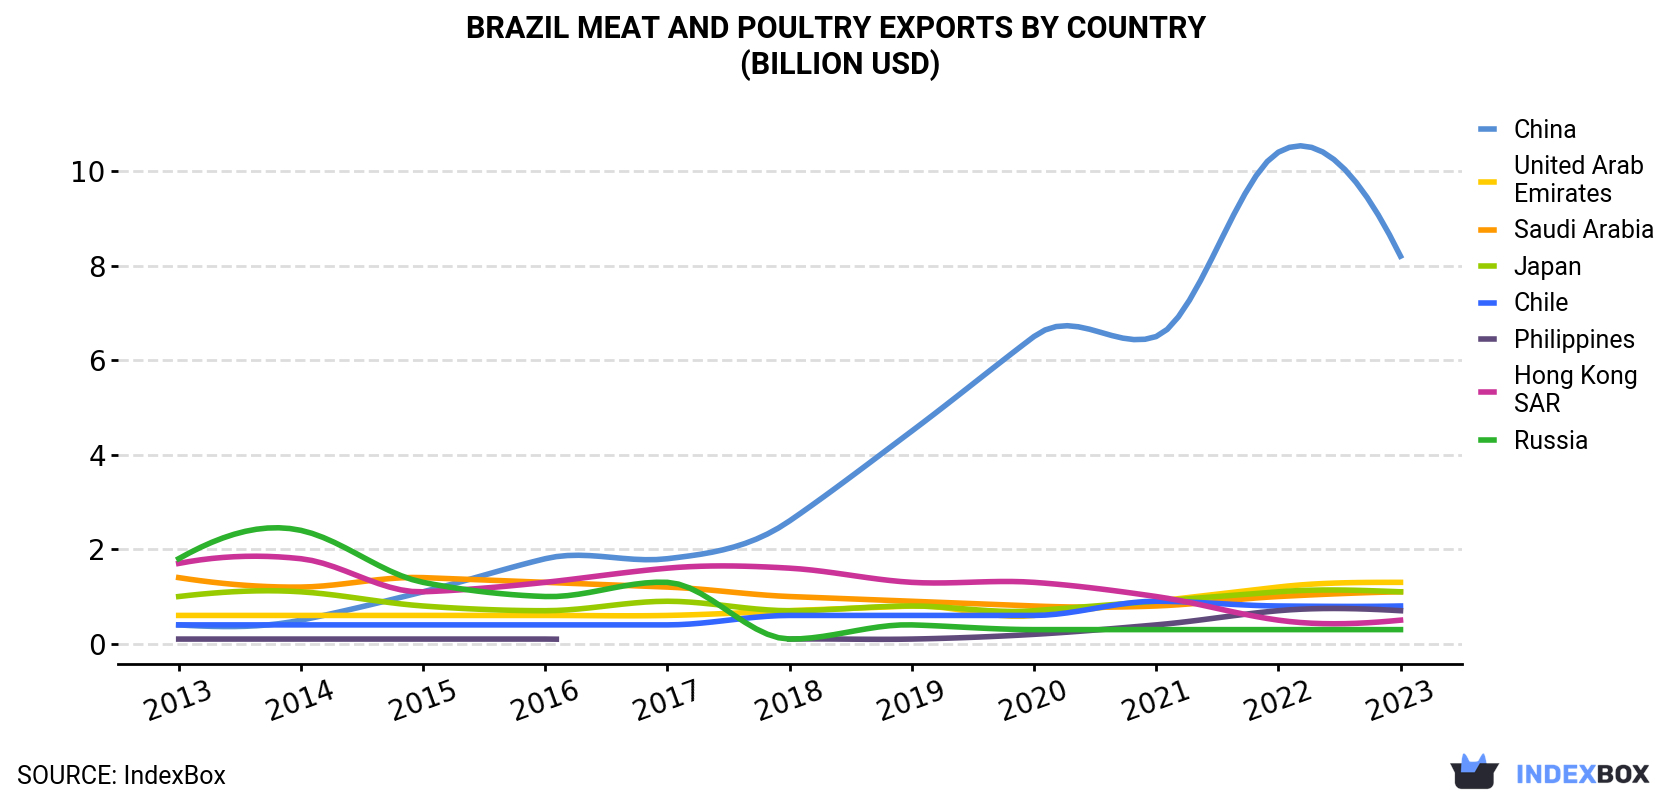
| COUNTRY | Export Value of Meat And Poultry in Brazil (billion USD) | ||||||||||
|---|---|---|---|---|---|---|---|---|---|---|---|
| 2013 | 2014 | 2015 | 2016 | 2017 | 2018 | 2019 | 2020 | 2021 | 2022 | 2023 | |
| China | 0.4 | 0.5 | 1.1 | 1.8 | 1.8 | 2.6 | 4.5 | 6.5 | 6.5 | 10.4 | 8.2 |
| United Arab Emirates | 0.6 | 0.6 | 0.6 | 0.6 | 0.6 | 0.7 | 0.8 | 0.6 | 0.9 | 1.2 | 1.3 |
| Saudi Arabia | 1.4 | 1.2 | 1.4 | 1.3 | 1.2 | 1.0 | 0.9 | 0.8 | 0.8 | 1.0 | 1.1 |
| Japan | 1.0 | 1.1 | 0.8 | 0.7 | 0.9 | 0.7 | 0.8 | 0.7 | 0.9 | 1.1 | 1.1 |
| Chile | 0.4 | 0.4 | 0.4 | 0.4 | 0.4 | 0.6 | 0.6 | 0.6 | 0.9 | 0.8 | 0.8 |
| Philippines | 0.1 | 0.1 | 0.1 | 0.1 | N/A | 0.1 | 0.1 | 0.2 | 0.4 | 0.7 | 0.7 |
| Hong Kong | 1.7 | 1.8 | 1.1 | 1.3 | 1.6 | 1.6 | 1.3 | 1.3 | 1.0 | 0.5 | 0.5 |
| Russia | 1.8 | 2.4 | 1.3 | 1.0 | 1.3 | 0.1 | 0.4 | 0.3 | 0.3 | 0.3 | 0.3 |
| Others | 6.4 | 6.2 | 5.5 | 4.7 | 5.2 | 5.1 | 5.9 | 5.0 | 6.5 | 7.2 | 7.2 |
| Total | 13.8 | 14.3 | 12.2 | 11.8 | 13.1 | 12.5 | 15.5 | 16.0 | 18.2 | 23.1 | 21.1 |
Exports by Country
China (2.2M tons) was the main destination for meat and poultry exports from Brazil, with a 28% share of total exports. Moreover, meat and poultry exports to China exceeded the volume sent to the second major destination, the United Arab Emirates (530K tons), fourfold. Japan (468K tons) ranked third in terms of total exports with a 5.9% share.
From 2013 to 2023, the average annual rate of growth in terms of volume to China totaled +27.9%. Exports to the other major destinations recorded the following average annual rates of exports growth: the United Arab Emirates (+7.2% per year) and Japan (+1.9% per year).
In value terms, China ($8.2B) remains the key foreign market for meat and poultry exports from Brazil, comprising 39% of total exports. The second position in the ranking was taken by the United Arab Emirates ($1.3B), with a 6% share of total exports. It was followed by Japan, with a 5.1% share.
From 2013 to 2023, the average annual growth rate of value to China amounted to +33.9%. Exports to the other major destinations recorded the following average annual rates of exports growth: the United Arab Emirates (+7.7% per year) and Japan (+1.1% per year).
Exports by Type
Chicken meat (4.7M tons) was the largest type of meat and poultry exported from Brazil, with a 60% share of total exports. Moreover, chicken meat exceeded the volume of the second product type, beef (cattle meat) (2M tons), twofold. Pork (1.1M tons) ranked third in terms of total exports with a 14% share.
From 2013 to 2023, the average annual growth rate of the volume of chicken meat exports totaled +2.9%. With regard to the other exported products, the following average annual rates of growth were recorded: beef (cattle meat) (+5.4% per year) and pork (+9.5% per year).
In value terms, meat and poultry with the largest exports in Brazil were beef (cattle meat) ($9.5B), chicken meat ($8.8B) and pork ($2.6B), with a combined 99% share of total exports. Turkey meat, duck and goose meat, horse, mule and donkey meat, lamb and sheep meat, rabbit or hare meat, goat meat and meat of camels and other animals lagged somewhat behind, together comprising a further 0.9%.
In terms of the main product categories, lamb and sheep meat, with a CAGR of +154.9%, recorded the highest growth rate of the value of exports, over the period under review, while shipments for the other products experienced more modest paces of growth.
Export Prices by Country
In 2023, the meat and poultry price stood at $2,674 per ton (FOB, Brazil), dropping by -14% against the previous year. In general, the export price, however, continues to indicate a relatively flat trend pattern. The most prominent rate of growth was recorded in 2022 an increase of 23%. As a result, the export price reached the peak level of $3,108 per ton, and then shrank in the following year.
Prices varied noticeably by country of destination: amid the top suppliers, the country with the highest price was the United States ($4,343 per ton), while the average price for exports to South Africa ($670 per ton) was amongst the lowest.
From 2013 to 2023, the most notable rate of growth in terms of prices was recorded for supplies to the United States (+6.1%), while the prices for the other major destinations experienced more modest paces of growth.
This report provides an in-depth analysis of the meat and poultry market in Brazil. Within it, you will discover the latest data on market trends and opportunities by country, consumption, production and price developments, as well as the global trade (imports and exports). The forecast exhibits the market prospects through 2030.
Product coverage:
- FCL 1108 - Meat of asses
- FCL 1089 - Meat of pigeons and other birds nes
- FCL 947 - Buffalo meat
- FCL 1127 - Meat of camels
- FCL 867 - Meat of cattle
- FCL 870 - Meat of cattle, boneless
- FCL 1058 - Chicken meat
- FCL 1069 - Duck meat
- FCL 1017 - Goat meat
- FCL 1073 - Goose meat
- FCL 1097 - Horse meat
- FCL 1111 - Meat of mules
- FCL 1158 - Meat of other domestic camelids
- FCL 1151 - Meat of other domestic rodents
- FCL 1035 - Pig meat
- FCL 1141 - Rabbit meat
- FCL 977 - Meat of sheep
- FCL 1080 - Turkey meat
Country coverage:
- Brazil
Data coverage:
- Market volume and value
- Per Capita consumption
- Forecast of the market dynamics in the medium term
- Trade (exports and imports) in Brazil
- Export and import prices
- Market trends, drivers and restraints
- Key market players and their profiles
Reasons to buy this report:
- Take advantage of the latest data
- Find deeper insights into current market developments
- Discover vital success factors affecting the market
This report is designed for manufacturers, distributors, importers, and wholesalers, as well as for investors, consultants and advisors.
In this report, you can find information that helps you to make informed decisions on the following issues:
- How to diversify your business and benefit from new market opportunities
- How to load your idle production capacity
- How to boost your sales on overseas markets
- How to increase your profit margins
- How to make your supply chain more sustainable
- How to reduce your production and supply chain costs
- How to outsource production to other countries
- How to prepare your business for global expansion
While doing this research, we combine the accumulated expertise of our analysts and the capabilities of artificial intelligence. The AI-based platform, developed by our data scientists, constitutes the key working tool for business analysts, empowering them to discover deep insights and ideas from the marketing data.
-
1. INTRODUCTION
Making Data-Driven Decisions to Grow Your Business
- REPORT DESCRIPTION
- RESEARCH METHODOLOGY AND AI PLATFORM
- DATA-DRIVEN DECISIONS FOR YOUR BUSINESS
- GLOSSARY AND SPECIFIC TERMS
-
2. EXECUTIVE SUMMARY
A Quick Overview of Market Performance
- KEY FINDINGS
- MARKET TRENDS This Chapter is Available Only for the Professional Edition PRO
-
3. MARKET OVERVIEW
Understanding the Current State of The Market and Its Prospects
- MARKET SIZE
- MARKET STRUCTURE
- TRADE BALANCE
- PER CAPITA CONSUMPTION
- MARKET FORECAST TO 2030
-
4. MOST PROMISING PRODUCT
Finding New Products to Diversify Your Business
This Chapter is Available Only for the Professional Edition PRO- TOP PRODUCTS TO DIVERSIFY YOUR BUSINESS
- BEST-SELLING PRODUCTS
- MOST CONSUMED PRODUCT
- MOST TRADED PRODUCT
- MOST PROFITABLE PRODUCT FOR EXPORT
-
5. MOST PROMISING SUPPLYING COUNTRIES
Choosing the Best Countries to Establish Your Sustainable Supply Chain
This Chapter is Available Only for the Professional Edition PRO- TOP COUNTRIES TO SOURCE YOUR PRODUCT
- TOP PRODUCING COUNTRIES
- COUNTRIES WITH TOP YIELDS
- TOP EXPORTING COUNTRIES
- LOW-COST EXPORTING COUNTRIES
-
6. MOST PROMISING OVERSEAS MARKETS
Choosing the Best Countries to Boost Your Exports
This Chapter is Available Only for the Professional Edition PRO- TOP OVERSEAS MARKETS FOR EXPORTING YOUR PRODUCT
- TOP CONSUMING MARKETS
- UNSATURATED MARKETS
- TOP IMPORTING MARKETS
- MOST PROFITABLE MARKETS
7. PRODUCTION
The Latest Trends and Insights into The Industry
- PRODUCTION, PRODUCING ANIMALS AND YIELD
8. IMPORTS
The Largest Import Supplying Countries
- IMPORTS FROM 2012–2023
- IMPORTS BY COUNTRY
- IMPORT PRICES BY COUNTRY
9. EXPORTS
The Largest Destinations for Exports
- EXPORTS FROM 2012–2023
- EXPORTS BY COUNTRY
- EXPORT PRICES BY COUNTRY
-
10. PROFILES OF MAJOR PRODUCERS
The Largest Producers on The Market and Their Profiles
This Chapter is Available Only for the Professional Edition PRO -
LIST OF TABLES
- Key Findings In 2023
- Market Volume, In Physical Terms, 2012–2023
- Market Value, 2012–2023
- Per Capita Consumption In 2012-2023
- Imports, In Physical Terms, By Country, 2012–2023
- Imports, In Value Terms, By Country, 2012–2023
- Import Prices, By Country Of Origin, 2012–2023
- Exports, In Physical Terms, By Country, 2012–2023
- Exports, In Value Terms, By Country, 2012–2023
- Export Prices, By Country Of Destination, 2012–2023
-
LIST OF FIGURES
- Market Volume, In Physical Terms, 2012–2023
- Market Value, 2012–2023
- Market Structure – Domestic Supply vs. Imports, In Physical Terms, 2012-2023
- Market Structure – Domestic Supply vs. Imports, In Value Terms, 2012-2023
- Trade Balance, In Physical Terms, 2012-2023
- Trade Balance, In Value Terms, 2012-2023
- Per Capita Consumption, 2012-2023
- Market Volume Forecast to 2030
- Market Value Forecast to 2030
- Products: Market Size And Growth, By Type
- Products: Average Per Capita Consumption, By Type
- Products: Exports And Growth, By Type
- Products: Export Prices And Growth, By Type
- Production Volume And Growth
- Yield And Growth
- Exports And Growth
- Export Prices And Growth
- Market Size And Growth
- Per Capita Consumption
- Imports And Growth
- Import Prices
- Production, In Physical Terms, 2012–2023
- Production, In Value Terms, 2012–2023
- Producing Animals Slaughtered, 2012–2023
- Yield, 2012–2023
- Imports, In Physical Terms, 2012–2023
- Imports, In Value Terms, 2012–2023
- Imports, In Physical Terms, By Country, 2023
- Imports, In Physical Terms, By Country, 2012–2023
- Imports, In Value Terms, By Country, 2012–2023
- Import Prices, By Country Of Origin, 2012–2023
- Exports, In Physical Terms, 2012–2023
- Exports, In Value Terms, 2012–2023
- Exports, In Physical Terms, By Country, 2023
- Exports, In Physical Terms, By Country, 2012–2023
- Exports, In Value Terms, By Country, 2012–2023
- Export Prices, By Country Of Destination, 2012–2023


