
Brazil - Sewing Thread Of Man-Made Filaments Or Staple Fibers - Market Analysis, Forecast, Size, Trends and Insights
Get instant access to more than 2 million reports, dashboards, and datasets on the IndexBox Platform.
View PricingBrazil's Sewing Thread Exports Surge to $11 Million in 2023
Brazil Sewing Thread Exports
In 2023, exports of sewing thread of man-made filaments or staple fibers from Brazil fell to 842 tons, dropping by -4.9% on the previous year's figure. Over the period under review, exports showed a slight reduction. The most prominent rate of growth was recorded in 2021 when exports increased by 67% against the previous year. As a result, the exports attained the peak of 1.1K tons. From 2022 to 2023, the growth of the exports remained at a somewhat lower figure.
In value terms, sewing thread exports expanded to $11M (IndexBox estimates) in 2023. Overall, exports saw a slight setback. The pace of growth was the most pronounced in 2021 with an increase of 70% against the previous year. The exports peaked at $12M in 2013; however, from 2014 to 2023, the exports remained at a lower figure.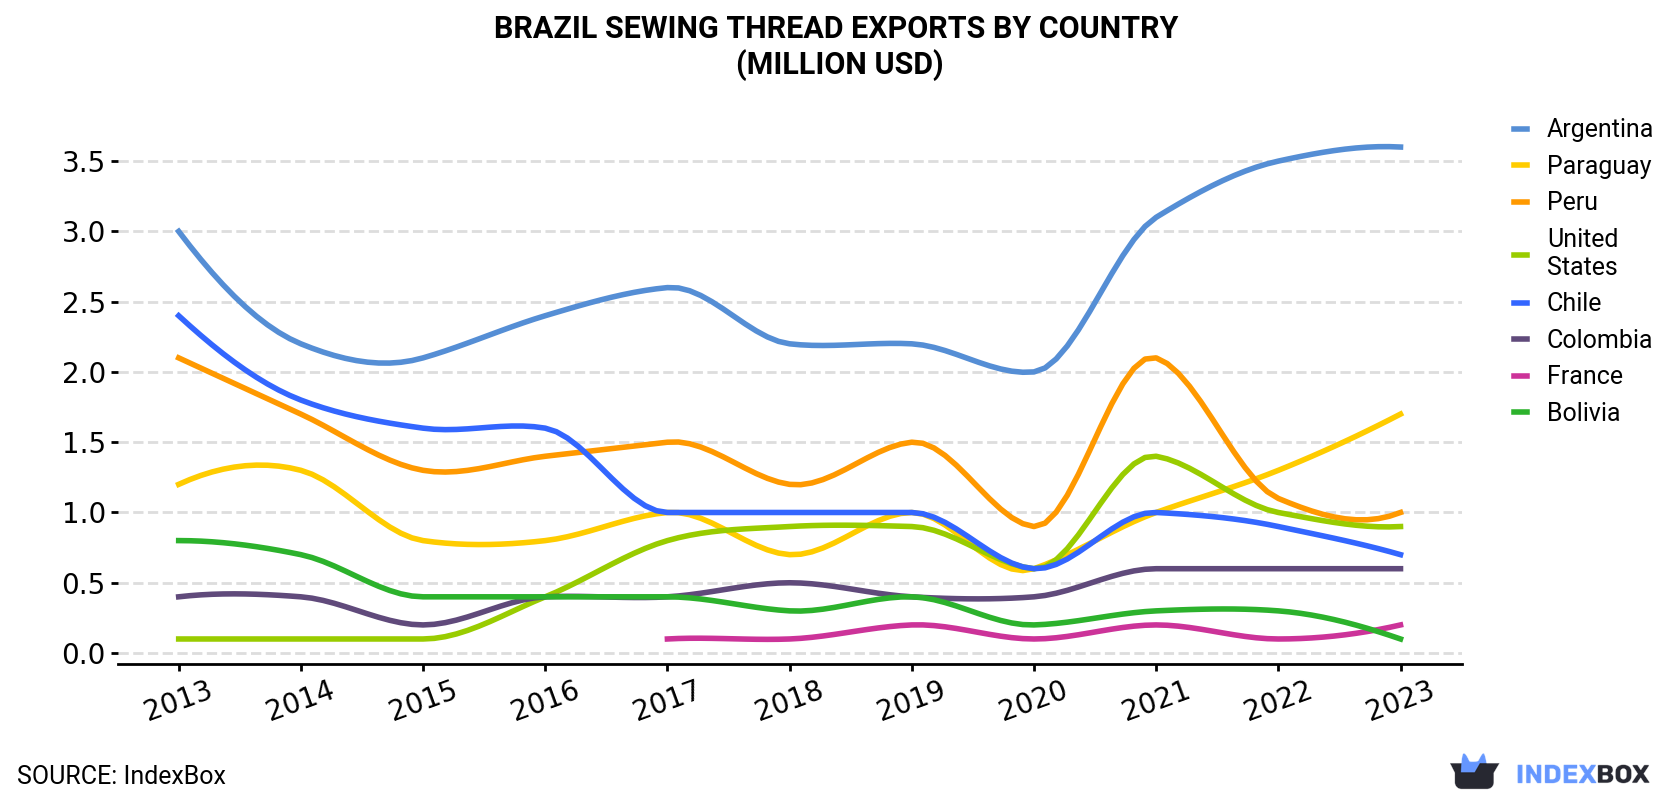
| COUNTRY | Export Value of Sewing Thread in Brazil (million USD) | ||||||||||
|---|---|---|---|---|---|---|---|---|---|---|---|
| 2013 | 2014 | 2015 | 2016 | 2017 | 2018 | 2019 | 2020 | 2021 | 2022 | 2023 | |
| Argentina | 3.0 | 2.2 | 2.1 | 2.4 | 2.6 | 2.2 | 2.2 | 2.0 | 3.1 | 3.5 | 3.6 |
| Paraguay | 1.2 | 1.3 | 0.8 | 0.8 | 1.0 | 0.7 | 1.0 | 0.6 | 1.0 | 1.3 | 1.7 |
| Peru | 2.1 | 1.7 | 1.3 | 1.4 | 1.5 | 1.2 | 1.5 | 0.9 | 2.1 | 1.1 | 1.0 |
| United States | 0.1 | 0.1 | 0.1 | 0.4 | 0.8 | 0.9 | 0.9 | 0.6 | 1.4 | 1.0 | 0.9 |
| Chile | 2.4 | 1.8 | 1.6 | 1.6 | 1.0 | 1.0 | 1.0 | 0.6 | 1.0 | 0.9 | 0.7 |
| Colombia | 0.4 | 0.4 | 0.2 | 0.4 | 0.4 | 0.5 | 0.4 | 0.4 | 0.6 | 0.6 | 0.6 |
| France | N/A | N/A | N/A | N/A | 0.1 | 0.1 | 0.2 | 0.1 | 0.2 | 0.1 | 0.2 |
| Bolivia | 0.8 | 0.7 | 0.4 | 0.4 | 0.4 | 0.3 | 0.4 | 0.2 | 0.3 | 0.3 | 0.1 |
| Others | 2.1 | 2.5 | 2.0 | 2.0 | 1.7 | 1.9 | 1.7 | 1.2 | 1.6 | 1.6 | 1.7 |
| Total | 12.0 | 10.7 | 8.5 | 9.3 | 9.5 | 8.8 | 9.2 | 6.6 | 11.3 | 10.3 | 10.6 |
Exports by Country
Argentina (287 tons), Paraguay (152 tons) and Peru (107 tons) were the main destinations of sewing thread exports from Brazil, with a combined 65% share of total exports. Colombia, the United States, Chile, France and Bolivia lagged somewhat behind, together comprising a further 22%.
From 2013 to 2023, the biggest increases were recorded for France (with a CAGR of +45.6%), while shipments for the other leaders experienced more modest paces of growth.
In value terms, Argentina ($3.6M) remains the key foreign market for sewing thread of man-made filaments or staple fibers exports from Brazil, comprising 34% of total exports. The second position in the ranking was taken by Paraguay ($1.7M), with a 16% share of total exports. It was followed by Peru, with a 9.3% share.
From 2013 to 2023, the average annual growth rate of value to Argentina stood at +1.9%. Exports to the other major destinations recorded the following average annual rates of exports growth: Paraguay (+3.9% per year) and Peru (-7.4% per year).
Exports by Type
Sewing thread of man-made filaments, whether or not put up for retail sale (618 tons) was the largest type of sewing thread of man-made filaments or staple fibers exported from Brazil, accounting for a 73% share of total exports. Moreover, sewing thread of man-made filaments, whether or not put up for retail sale exceeded the volume of the second product type, sewing thread of man-made staple fibres, whether or not put up for retail sale (224 tons), threefold.
From 2013 to 2023, the average annual growth rate of the volume of sewing thread of man-made filaments, whether or not put up for retail sale exports amounted to -3.0%.
In value terms, sewing thread of man-made filaments, whether or not put up for retail sale ($8.2M) remains the largest type of sewing thread of man-made filaments or staple fibers exported from Brazil, comprising 77% of total exports. The second position in the ranking was taken by sewing thread of man-made staple fibres, whether or not put up for retail sale ($2.4M), with a 23% share of total exports.
From 2013 to 2023, the average annual rate of growth in terms of the value of sewing thread of man-made filaments, whether or not put up for retail sale exports amounted to -2.3%.
Export Prices by Country
In 2023, the sewing thread price amounted to $12,603 per ton (FOB, Brazil), increasing by 7.8% against the previous year. Overall, the export price, however, showed a relatively flat trend pattern. The growth pace was the most rapid in 2022 an increase of 11% against the previous year. The export price peaked at $12,878 per ton in 2013; however, from 2014 to 2023, the export prices failed to regain momentum.
There were significant differences in the average prices for the major overseas markets. In 2023, amid the top suppliers, the country with the highest price was Uruguay ($18,942 per ton), while the average price for exports to Peru ($9,213 per ton) was amongst the lowest.
From 2013 to 2023, the most notable rate of growth in terms of prices was recorded for supplies to Spain (+8.0%), while the prices for the other major destinations experienced more modest paces of growth.
This report provides an in-depth analysis of the sewing thread market in Brazil. Within it, you will discover the latest data on market trends and opportunities by country, consumption, production and price developments, as well as the global trade (imports and exports). The forecast exhibits the market prospects through 2030.
Product coverage:
- Prodcom 13108510 - Sewing thread of man-made filaments
- Prodcom 13108550 - Sewing thread of man-made staple fibres
Country coverage:
- Brazil
Data coverage:
- Market volume and value
- Per Capita consumption
- Forecast of the market dynamics in the medium term
- Trade (exports and imports) in Brazil
- Export and import prices
- Market trends, drivers and restraints
- Key market players and their profiles
Reasons to buy this report:
- Take advantage of the latest data
- Find deeper insights into current market developments
- Discover vital success factors affecting the market
This report is designed for manufacturers, distributors, importers, and wholesalers, as well as for investors, consultants and advisors.
In this report, you can find information that helps you to make informed decisions on the following issues:
- How to diversify your business and benefit from new market opportunities
- How to load your idle production capacity
- How to boost your sales on overseas markets
- How to increase your profit margins
- How to make your supply chain more sustainable
- How to reduce your production and supply chain costs
- How to outsource production to other countries
- How to prepare your business for global expansion
While doing this research, we combine the accumulated expertise of our analysts and the capabilities of artificial intelligence. The AI-based platform, developed by our data scientists, constitutes the key working tool for business analysts, empowering them to discover deep insights and ideas from the marketing data.
-
1. INTRODUCTION
Making Data-Driven Decisions to Grow Your Business
- REPORT DESCRIPTION
- RESEARCH METHODOLOGY AND AI PLATFORM
- DATA-DRIVEN DECISIONS FOR YOUR BUSINESS
- GLOSSARY AND SPECIFIC TERMS
-
2. EXECUTIVE SUMMARY
A Quick Overview of Market Performance
- KEY FINDINGS
- MARKET TRENDS This Chapter is Available Only for the Professional Edition PRO
-
3. MARKET OVERVIEW
Understanding the Current State of The Market and Its Prospects
- MARKET SIZE
- MARKET STRUCTURE
- TRADE BALANCE
- PER CAPITA CONSUMPTION
- MARKET FORECAST TO 2030
-
4. MOST PROMISING PRODUCT
Finding New Products to Diversify Your Business
This Chapter is Available Only for the Professional Edition PRO- TOP PRODUCTS TO DIVERSIFY YOUR BUSINESS
- BEST-SELLING PRODUCTS
- MOST CONSUMED PRODUCT
- MOST TRADED PRODUCT
- MOST PROFITABLE PRODUCT FOR EXPORT
-
5. MOST PROMISING SUPPLYING COUNTRIES
Choosing the Best Countries to Establish Your Sustainable Supply Chain
This Chapter is Available Only for the Professional Edition PRO- TOP COUNTRIES TO SOURCE YOUR PRODUCT
- TOP PRODUCING COUNTRIES
- TOP EXPORTING COUNTRIES
- LOW-COST EXPORTING COUNTRIES
-
6. MOST PROMISING OVERSEAS MARKETS
Choosing the Best Countries to Boost Your Exports
This Chapter is Available Only for the Professional Edition PRO- TOP OVERSEAS MARKETS FOR EXPORTING YOUR PRODUCT
- TOP CONSUMING MARKETS
- UNSATURATED MARKETS
- TOP IMPORTING MARKETS
- MOST PROFITABLE MARKETS
7. PRODUCTION
The Latest Trends and Insights into The Industry
- PRODUCTION VOLUME AND VALUE
8. IMPORTS
The Largest Import Supplying Countries
- IMPORTS FROM 2012–2023
- IMPORTS BY COUNTRY
- IMPORT PRICES BY COUNTRY
9. EXPORTS
The Largest Destinations for Exports
- EXPORTS FROM 2012–2023
- EXPORTS BY COUNTRY
- EXPORT PRICES BY COUNTRY
-
10. PROFILES OF MAJOR PRODUCERS
The Largest Producers on The Market and Their Profiles
This Chapter is Available Only for the Professional Edition PRO -
LIST OF TABLES
- Key Findings In 2023
- Market Volume, In Physical Terms, 2012–2023
- Market Value, 2012–2023
- Per Capita Consumption In 2012-2023
- Imports, In Physical Terms, By Country, 2012–2023
- Imports, In Value Terms, By Country, 2012–2023
- Import Prices, By Country Of Origin, 2012–2023
- Exports, In Physical Terms, By Country, 2012–2023
- Exports, In Value Terms, By Country, 2012–2023
- Export Prices, By Country Of Destination, 2012–2023
-
LIST OF FIGURES
- Market Volume, In Physical Terms, 2012–2023
- Market Value, 2012–2023
- Market Structure – Domestic Supply vs. Imports, In Physical Terms, 2012-2023
- Market Structure – Domestic Supply vs. Imports, In Value Terms, 2012-2023
- Trade Balance, In Physical Terms, 2012-2023
- Trade Balance, In Value Terms, 2012-2023
- Per Capita Consumption, 2012-2023
- Market Volume Forecast to 2030
- Market Value Forecast to 2030
- Products: Market Size And Growth, By Type
- Products: Average Per Capita Consumption, By Type
- Products: Exports And Growth, By Type
- Products: Export Prices And Growth, By Type
- Production Volume And Growth
- Exports And Growth
- Export Prices And Growth
- Market Size And Growth
- Per Capita Consumption
- Imports And Growth
- Import Prices
- Production, In Physical Terms, 2012–2023
- Production, In Value Terms, 2012–2023
- Imports, In Physical Terms, 2012–2023
- Imports, In Value Terms, 2012–2023
- Imports, In Physical Terms, By Country, 2023
- Imports, In Physical Terms, By Country, 2012–2023
- Imports, In Value Terms, By Country, 2012–2023
- Import Prices, By Country Of Origin, 2012–2023
- Exports, In Physical Terms, 2012–2023
- Exports, In Value Terms, 2012–2023
- Exports, In Physical Terms, By Country, 2023
- Exports, In Physical Terms, By Country, 2012–2023
- Exports, In Value Terms, By Country, 2012–2023
- Export Prices, By Country Of Destination, 2012–2023


