Canada - Fertilizers - Market Analysis, Forecast, Size, Trends and Insights
Get instant access to more than 2 million reports, dashboards, and datasets on the IndexBox Platform.
View PricingCanada's Fertilizers Export Dives to $9.5 Billion in 2023
Canada Fertilizers Exports
In 2023, shipments abroad of fertilizers decreased by -26.6% to 25M tons for the first time since 2019, thus ending a three-year rising trend. Over the period under review, total exports indicated a measured expansion from 2013 to 2023: its volume increased at an average annual rate of +3.2% over the last decade. The trend pattern, however, indicated some noticeable fluctuations being recorded throughout the analyzed period. Based on 2023 figures, exports increased by +4.5% against 2018 indices. The most prominent rate of growth was recorded in 2022 with an increase of 42% against the previous year. As a result, the exports reached the peak of 34M tons, and then shrank sharply in the following year.
In value terms, fertilizer exports reduced dramatically to $9.5B (IndexBox estimates) in 2023. Overall, exports, however, showed a tangible expansion. The pace of growth appeared the most rapid in 2022 with an increase of 110%. As a result, the exports reached the peak of $13.6B, and then shrank remarkably in the following year.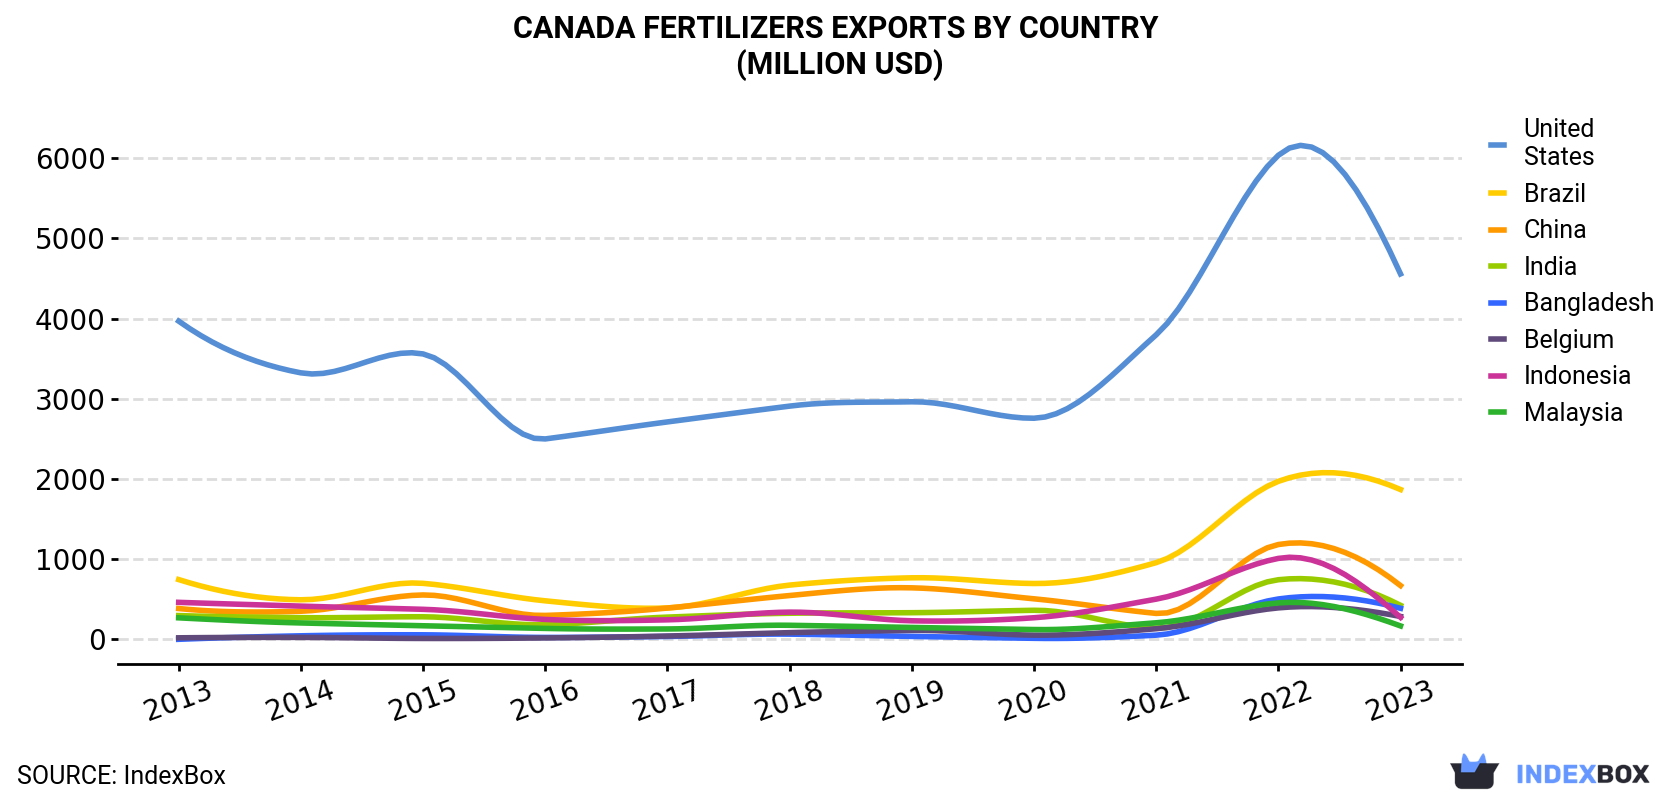
| COUNTRY | Export Value of Fertilizers in Canada (million USD) | ||||||||||
|---|---|---|---|---|---|---|---|---|---|---|---|
| 2013 | 2014 | 2015 | 2016 | 2017 | 2018 | 2019 | 2020 | 2021 | 2022 | 2023 | |
| United States | 3,968 | 3,323 | 3,559 | 2,499 | 2,711 | 2,908 | 2,962 | 2,757 | 3,797 | 6,036 | 4,557 |
| Brazil | 745 | 493 | 698 | 480 | 391 | 676 | 767 | 696 | 956 | 1,970 | 1,868 |
| China | 384 | 350 | 553 | 298 | 390 | 546 | 642 | 505 | 323 | 1,182 | 670 |
| India | 296 | 270 | 281 | 182 | 277 | 325 | 332 | 362 | 140 | 743 | 424 |
| Bangladesh | 0.1 | 43.8 | 56.2 | 23.6 | 35.5 | 64.3 | 36.3 | 12.4 | 51.8 | 503 | 387 |
| Belgium | 18.7 | 23.9 | 10.6 | 17.3 | 41.0 | 83.1 | 111 | 52.1 | 132 | 392 | 285 |
| Indonesia | 461 | 414 | 374 | 248 | 243 | 339 | 231 | 269 | 501 | 1,009 | 274 |
| Malaysia | 268 | 204 | 169 | 136 | 129 | 175 | 148 | 122 | 206 | 454 | 167 |
| Others | 404 | 382 | 413 | 321 | 260 | 344 | 315 | 306 | 397 | 1,355 | 842 |
| Total | 6,544 | 5,504 | 6,114 | 4,204 | 4,477 | 5,461 | 5,544 | 5,081 | 6,503 | 13,643 | 9,474 |
Exports by Country
the United States (13M tons) was the main destination for fertilizer exports from Canada, with a 51% share of total exports. Moreover, fertilizer exports to the United States exceeded the volume sent to the second major destination, Brazil (4.4M tons), threefold. The third position in this ranking was held by China (1.9M tons), with a 7.5% share.
From 2013 to 2023, the average annual rate of growth in terms of volume to the United States amounted to +1.5%. Exports to the other major destinations recorded the following average annual rates of exports growth: Brazil (+7.5% per year) and China (+5.8% per year).
In value terms, the United States ($4.6B) remains the key foreign market for fertilizers exports from Canada, comprising 48% of total exports. The second position in the ranking was taken by Brazil ($1.9B), with a 20% share of total exports. It was followed by China, with a 7.1% share.
From 2013 to 2023, the average annual growth rate of value to the United States totaled +1.4%. Exports to the other major destinations recorded the following average annual rates of exports growth: Brazil (+9.6% per year) and China (+5.7% per year).
Exports by Type
Potassium chloride (MOP) (23M tons) was the largest type of fertilizers exported from Canada, accounting for a 92% share of total exports. It was followed by urea (733K tons), with a 3% share of total exports. The third position in this ranking was taken by ammonium sulphate (474K tons), with a 1.9% share.
From 2013 to 2023, the average annual growth rate of the volume of potassium chloride (MOP) exports stood at +3.6%. With regard to the other exported products, the following average annual rates of growth were recorded: urea (-4.2% per year) and ammonium sulphate (+6.5% per year).
In value terms, potassium chloride (MOP) ($8.5B) remains the largest type of fertilizers exported from Canada, comprising 91% of total exports. The second position in the ranking was taken by urea ($371M), with a 3.9% share of total exports. It was followed by ammonium sulphate, with a 2% share.
From 2013 to 2023, the average annual growth rate of the value of potassium chloride (MOP) exports totaled +4.2%. With regard to the other exported products, the following average annual rates of growth were recorded: urea (-3.4% per year) and ammonium sulphate (+9.0% per year).
Export Prices by Country
In 2023, the fertilizers price amounted to $381 per ton (FOB, Canada), reducing by -5.4% against the previous year. Overall, the export price, however, saw a relatively flat trend pattern. The growth pace was the most rapid in 2022 when the average export price increased by 48%. As a result, the export price attained the peak level of $403 per ton, and then shrank in the following year.
Average prices varied somewhat for the major overseas markets. In 2023, amid the top suppliers, the countries with the highest prices were Malaysia ($477 per ton) and Brazil ($421 per ton), while the average price for exports to China ($359 per ton) and the United States ($362 per ton) were amongst the lowest.
From 2013 to 2023, the most notable rate of growth in terms of prices was recorded for supplies to Malaysia (+3.0%), while the prices for the other major destinations experienced more modest paces of growth.
This report provides an in-depth analysis of the fertilizer market in Canada. Within it, you will discover the latest data on market trends and opportunities by country, consumption, production and price developments, as well as the global trade (imports and exports). The forecast exhibits the market prospects through 2030.
Product coverage:
- FCL 4025 - Potassium nitrate
- FCL 4004 - Calcium ammonium nitrate (CAN) and other mixtures with calcium carbonate
- FCL 4005 - Sodium nitrate
- FCL 4023 - Monoammonium phosphate (MAP)
- FCL 4001 - Urea
- FCL 4002 - Ammonium sulphate
- FCL 4003 - Ammonium nitrate (AN)
- FCL 4006 - Urea and ammonium nitrate solutions (UAN)
- FCL 4016 - Potassium chloride (muriate of potash) (MOP)
- FCL 4021 - NPK fertilizers
- FCL 4014 - Other phosphatic fertilizers, n.e.c.
- FCL 4022 - Diammonium phosphate (DAP)
- FCL 4027 - PK compounds
- FCL 4024 - Other NP compounds
- FCL 4008 - Other nitrogenous fertilizers, n.e.c.
- FCL 4012 - Superphosphates above 35%
- FCL 4013 - Superphosphates, other
- FCL 4018 - Other potassic fertilizers, n.e.c.
Country coverage:
- Canada
Data coverage:
- Market volume and value
- Per Capita consumption
- Forecast of the market dynamics in the medium term
- Trade (exports and imports) in Canada
- Export and import prices
- Market trends, drivers and restraints
- Key market players and their profiles
Reasons to buy this report:
- Take advantage of the latest data
- Find deeper insights into current market developments
- Discover vital success factors affecting the market
This report is designed for manufacturers, distributors, importers, and wholesalers, as well as for investors, consultants and advisors.
In this report, you can find information that helps you to make informed decisions on the following issues:
- How to diversify your business and benefit from new market opportunities
- How to load your idle production capacity
- How to boost your sales on overseas markets
- How to increase your profit margins
- How to make your supply chain more sustainable
- How to reduce your production and supply chain costs
- How to outsource production to other countries
- How to prepare your business for global expansion
While doing this research, we combine the accumulated expertise of our analysts and the capabilities of artificial intelligence. The AI-based platform, developed by our data scientists, constitutes the key working tool for business analysts, empowering them to discover deep insights and ideas from the marketing data.
-
1. INTRODUCTION
Making Data-Driven Decisions to Grow Your Business
- REPORT DESCRIPTION
- RESEARCH METHODOLOGY AND AI PLATFORM
- DATA-DRIVEN DECISIONS FOR YOUR BUSINESS
- GLOSSARY AND SPECIFIC TERMS
-
2. EXECUTIVE SUMMARY
A Quick Overview of Market Performance
- KEY FINDINGS
- MARKET TRENDS This Chapter is Available Only for the Professional Edition PRO
-
3. MARKET OVERVIEW
Understanding the Current State of The Market and Its Prospects
- MARKET SIZE
- MARKET STRUCTURE
- TRADE BALANCE
- PER CAPITA CONSUMPTION
- MARKET FORECAST TO 2030
-
4. MOST PROMISING PRODUCT
Finding New Products to Diversify Your Business
This Chapter is Available Only for the Professional Edition PRO- TOP PRODUCTS TO DIVERSIFY YOUR BUSINESS
- BEST-SELLING PRODUCTS
- MOST CONSUMED PRODUCT
- MOST TRADED PRODUCT
- MOST PROFITABLE PRODUCT FOR EXPORT
-
5. MOST PROMISING SUPPLYING COUNTRIES
Choosing the Best Countries to Establish Your Sustainable Supply Chain
This Chapter is Available Only for the Professional Edition PRO- TOP COUNTRIES TO SOURCE YOUR PRODUCT
- TOP PRODUCING COUNTRIES
- TOP EXPORTING COUNTRIES
- LOW-COST EXPORTING COUNTRIES
-
6. MOST PROMISING OVERSEAS MARKETS
Choosing the Best Countries to Boost Your Exports
This Chapter is Available Only for the Professional Edition PRO- TOP OVERSEAS MARKETS FOR EXPORTING YOUR PRODUCT
- TOP CONSUMING MARKETS
- UNSATURATED MARKETS
- TOP IMPORTING MARKETS
- MOST PROFITABLE MARKETS
7. PRODUCTION
The Latest Trends and Insights into The Industry
- PRODUCTION VOLUME AND VALUE
8. IMPORTS
The Largest Import Supplying Countries
- IMPORTS FROM 2012–2023
- IMPORTS BY COUNTRY
- IMPORT PRICES BY COUNTRY
9. EXPORTS
The Largest Destinations for Exports
- EXPORTS FROM 2012–2023
- EXPORTS BY COUNTRY
- EXPORT PRICES BY COUNTRY
-
10. PROFILES OF MAJOR PRODUCERS
The Largest Producers on The Market and Their Profiles
This Chapter is Available Only for the Professional Edition PRO -
LIST OF TABLES
- Key Findings In 2023
- Market Volume, In Physical Terms, 2012–2023
- Market Value, 2012–2023
- Per Capita Consumption In 2012-2023
- Imports, In Physical Terms, By Country, 2012–2023
- Imports, In Value Terms, By Country, 2012–2023
- Import Prices, By Country Of Origin, 2012–2023
- Exports, In Physical Terms, By Country, 2012–2023
- Exports, In Value Terms, By Country, 2012–2023
- Export Prices, By Country Of Destination, 2012–2023
-
LIST OF FIGURES
- Market Volume, In Physical Terms, 2012–2023
- Market Value, 2012–2023
- Market Structure – Domestic Supply vs. Imports, In Physical Terms, 2012-2023
- Market Structure – Domestic Supply vs. Imports, In Value Terms, 2012-2023
- Trade Balance, In Physical Terms, 2012-2023
- Trade Balance, In Value Terms, 2012-2023
- Per Capita Consumption, 2012-2023
- Market Volume Forecast to 2030
- Market Value Forecast to 2030
- Products: Market Size And Growth, By Type
- Products: Average Per Capita Consumption, By Type
- Products: Exports And Growth, By Type
- Products: Export Prices And Growth, By Type
- Production Volume And Growth
- Exports And Growth
- Export Prices And Growth
- Market Size And Growth
- Per Capita Consumption
- Imports And Growth
- Import Prices
- Production, In Physical Terms, 2012–2023
- Production, In Value Terms, 2012–2023
- Imports, In Physical Terms, 2012–2023
- Imports, In Value Terms, 2012–2023
- Imports, In Physical Terms, By Country, 2023
- Imports, In Physical Terms, By Country, 2012–2023
- Imports, In Value Terms, By Country, 2012–2023
- Import Prices, By Country Of Origin, 2012–2023
- Exports, In Physical Terms, 2012–2023
- Exports, In Value Terms, 2012–2023
- Exports, In Physical Terms, By Country, 2023
- Exports, In Physical Terms, By Country, 2012–2023
- Exports, In Value Terms, By Country, 2012–2023
- Export Prices, By Country Of Destination, 2012–2023


