
Canada - Natural Sands - Market Analysis, Forecast, Size, Trends And Insights
Get instant access to more than 2 million reports, dashboards, and datasets on the IndexBox Platform.
View PricingCanada Sees Significant Rise in Natural Sand Imports, Reaching $282M in 2023
Canada Natural Sand Imports
For the third consecutive year, Canada recorded growth in overseas purchases of natural sands, which increased by 7.1% to 4.6M tons in 2023. Over the period under review, imports recorded buoyant growth. The growth pace was the most rapid in 2017 when imports increased by 97% against the previous year. Imports peaked at 4.8M tons in 2019; however, from 2020 to 2023, imports stood at a somewhat lower figure.
In value terms, natural sand imports rose markedly to $282M (IndexBox estimates) in 2023. Overall, total imports indicated a pronounced increase from 2013 to 2023: its value increased at an average annual rate of +4.7% over the last decade. The trend pattern, however, indicated some noticeable fluctuations being recorded throughout the analyzed period. Based on 2023 figures, imports increased by +50.2% against 2020 indices. The most prominent rate of growth was recorded in 2017 when imports increased by 72% against the previous year. Imports peaked at $306M in 2018; however, from 2019 to 2023, imports failed to regain momentum.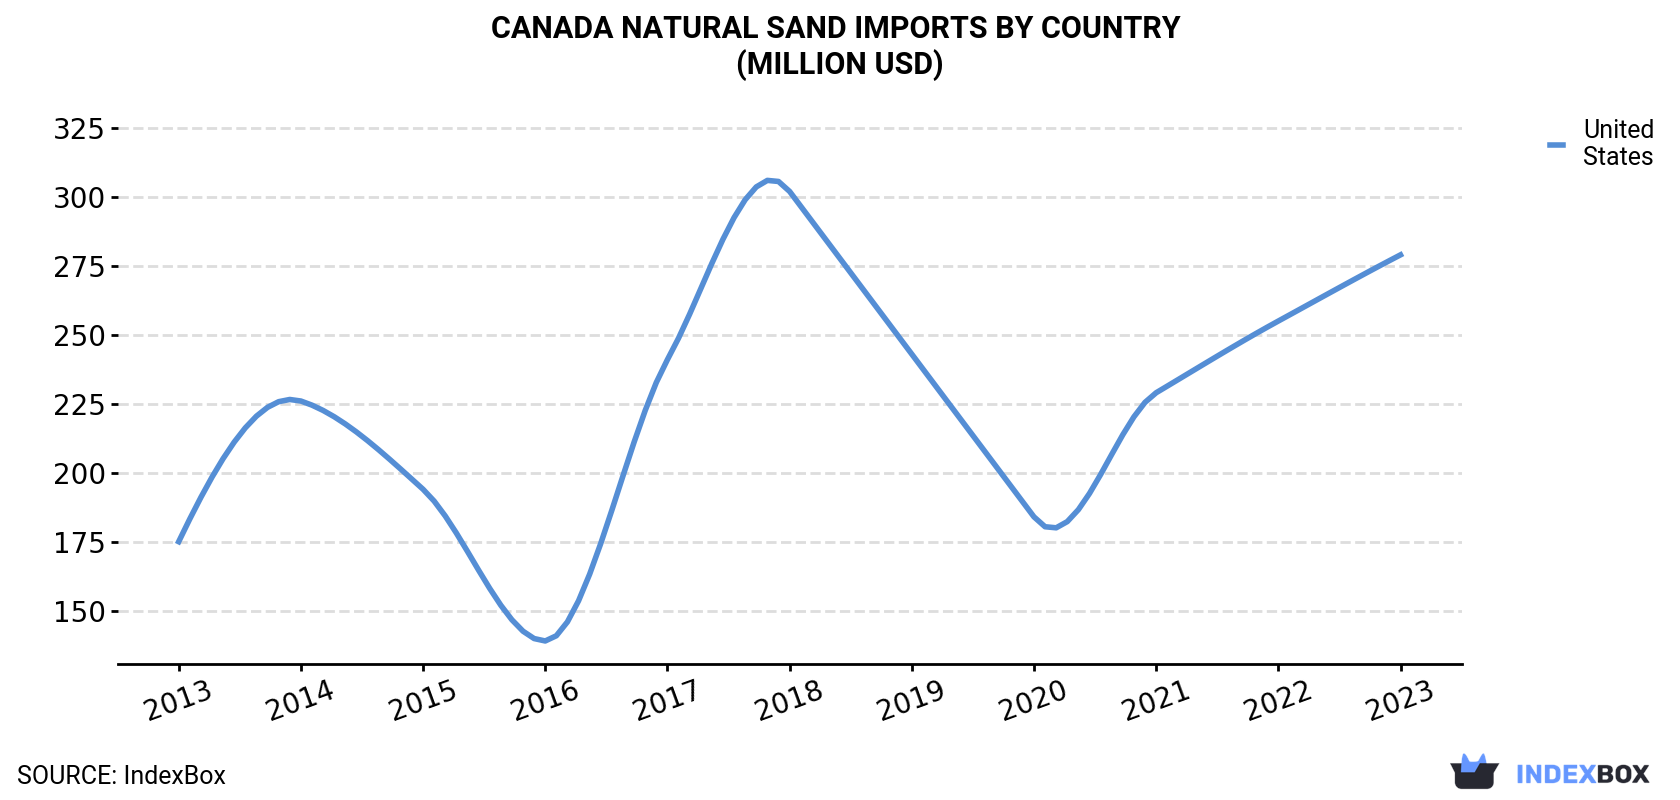
| COUNTRY | Import Value of Natural Sand in Canada (million USD) | ||||||||||
|---|---|---|---|---|---|---|---|---|---|---|---|
| 2013 | 2014 | 2015 | 2016 | 2017 | 2018 | 2019 | 2020 | 2021 | 2022 | 2023 | |
| United States | 175 | 226 | 194 | 139 | 241 | 302 | 243 | 184 | 229 | 255 | 279 |
| Others | 2.2 | 2.1 | 2.2 | 2.1 | 2.3 | 3.9 | 3.2 | 3.7 | 3.6 | 3.2 | 2.5 |
| Total | 177 | 228 | 197 | 141 | 243 | 306 | 247 | 188 | 233 | 258 | 282 |
Imports by Country
In 2023, the United States (4.6M tons) was the main natural sand supplier to Canada, with a approx. 100% share of total imports.
From 2013 to 2023, the average annual growth rate of volume from the United States amounted to +10.6%.
In value terms, the United States ($279M) constituted the largest supplier of natural sands to Canada.
From 2013 to 2023, the average annual rate of growth in terms of value from the United States totaled +4.8%.
Imports by Type
In 2023, silica sands (quartz sands or industrial sands) (4.6M tons) was the main type of natural sands supplied to Canada, accounting for a 100% share of total imports. It was followed by construction sands (17K tons), with a 0.4% share of total imports.
From 2013 to 2023, the average annual growth rate of the volume of silica sands (quartz sands or industrial sands) imports totaled +10.8%.
In value terms, silica sands (quartz sands or industrial sands) ($281M) constituted the largest type of natural sands supplied to Canada, comprising 100% of total imports. The second position in the ranking was held by construction sands ($654K), with a 0.2% share of total imports.
Import Prices by Country
In 2023, the natural sand price stood at $61 per ton (CIF, Canada), picking up by 1.9% against the previous year. In general, the import price, however, showed a deep setback. The pace of growth was the most pronounced in 2015 an increase of 41%. As a result, import price reached the peak level of $179 per ton. From 2016 to 2023, the average import prices remained at a lower figure.
As there is only one major supplying country, the average price level is determined by prices for the United States.
From 2013 to 2023, the rate of growth in terms of prices for the United States amounted to -5.3% per year.
This report provides an in-depth analysis of the natural sand market in Canada. Within it, you will discover the latest data on market trends and opportunities by country, consumption, production and price developments, as well as the global trade (imports and exports). The forecast exhibits the market prospects through 2030.
Product coverage:
- Prodcom 08121150 - Silica sands (quartz sands or industrial sands)
- Prodcom 08121190 - Construction sands such as clayey sands, kaolinic sands, f eldspathic sands (excluding silica sands, metal bearing sands)
Country coverage:
- Canada
Data coverage:
- Market volume and value
- Per Capita consumption
- Forecast of the market dynamics in the medium term
- Trade (exports and imports) in Canada
- Export and import prices
- Market trends, drivers and restraints
- Key market players and their profiles
Reasons to buy this report:
- Take advantage of the latest data
- Find deeper insights into current market developments
- Discover vital success factors affecting the market
This report is designed for manufacturers, distributors, importers, and wholesalers, as well as for investors, consultants and advisors.
In this report, you can find information that helps you to make informed decisions on the following issues:
- How to diversify your business and benefit from new market opportunities
- How to load your idle production capacity
- How to boost your sales on overseas markets
- How to increase your profit margins
- How to make your supply chain more sustainable
- How to reduce your production and supply chain costs
- How to outsource production to other countries
- How to prepare your business for global expansion
While doing this research, we combine the accumulated expertise of our analysts and the capabilities of artificial intelligence. The AI-based platform, developed by our data scientists, constitutes the key working tool for business analysts, empowering them to discover deep insights and ideas from the marketing data.
-
1. INTRODUCTION
Making Data-Driven Decisions to Grow Your Business
- REPORT DESCRIPTION
- RESEARCH METHODOLOGY AND AI PLATFORM
- DATA-DRIVEN DECISIONS FOR YOUR BUSINESS
- GLOSSARY AND SPECIFIC TERMS
-
2. EXECUTIVE SUMMARY
A Quick Overview of Market Performance
- KEY FINDINGS
- MARKET TRENDS This Chapter is Available Only for the Professional Edition PRO
-
3. MARKET OVERVIEW
Understanding the Current State of The Market and Its Prospects
- MARKET SIZE
- MARKET STRUCTURE
- TRADE BALANCE
- PER CAPITA CONSUMPTION
- MARKET FORECAST TO 2030
-
4. MOST PROMISING PRODUCT
Finding New Products to Diversify Your Business
This Chapter is Available Only for the Professional Edition PRO- TOP PRODUCTS TO DIVERSIFY YOUR BUSINESS
- BEST-SELLING PRODUCTS
- MOST CONSUMED PRODUCT
- MOST TRADED PRODUCT
- MOST PROFITABLE PRODUCT FOR EXPORT
-
5. MOST PROMISING SUPPLYING COUNTRIES
Choosing the Best Countries to Establish Your Sustainable Supply Chain
This Chapter is Available Only for the Professional Edition PRO- TOP COUNTRIES TO SOURCE YOUR PRODUCT
- TOP PRODUCING COUNTRIES
- TOP EXPORTING COUNTRIES
- LOW-COST EXPORTING COUNTRIES
-
6. MOST PROMISING OVERSEAS MARKETS
Choosing the Best Countries to Boost Your Exports
This Chapter is Available Only for the Professional Edition PRO- TOP OVERSEAS MARKETS FOR EXPORTING YOUR PRODUCT
- TOP CONSUMING MARKETS
- UNSATURATED MARKETS
- TOP IMPORTING MARKETS
- MOST PROFITABLE MARKETS
7. PRODUCTION
The Latest Trends and Insights into The Industry
- PRODUCTION VOLUME AND VALUE
8. IMPORTS
The Largest Import Supplying Countries
- IMPORTS FROM 2012–2023
- IMPORTS BY COUNTRY
- IMPORT PRICES BY COUNTRY
9. EXPORTS
The Largest Destinations for Exports
- EXPORTS FROM 2012–2023
- EXPORTS BY COUNTRY
- EXPORT PRICES BY COUNTRY
-
10. PROFILES OF MAJOR PRODUCERS
The Largest Producers on The Market and Their Profiles
This Chapter is Available Only for the Professional Edition PRO -
LIST OF TABLES
- Key Findings In 2023
- Market Volume, In Physical Terms, 2012–2023
- Market Value, 2012–2023
- Per Capita Consumption In 2012-2023
- Imports, In Physical Terms, By Country, 2012–2023
- Imports, In Value Terms, By Country, 2012–2023
- Import Prices, By Country Of Origin, 2012–2023
- Exports, In Physical Terms, By Country, 2012–2023
- Exports, In Value Terms, By Country, 2012–2023
- Export Prices, By Country Of Destination, 2012–2023
-
LIST OF FIGURES
- Market Volume, In Physical Terms, 2012–2023
- Market Value, 2012–2023
- Market Structure – Domestic Supply vs. Imports, In Physical Terms, 2012-2023
- Market Structure – Domestic Supply vs. Imports, In Value Terms, 2012-2023
- Trade Balance, In Physical Terms, 2012-2023
- Trade Balance, In Value Terms, 2012-2023
- Per Capita Consumption, 2012-2023
- Market Volume Forecast to 2030
- Market Value Forecast to 2030
- Products: Market Size And Growth, By Type
- Products: Average Per Capita Consumption, By Type
- Products: Exports And Growth, By Type
- Products: Export Prices And Growth, By Type
- Production Volume And Growth
- Exports And Growth
- Export Prices And Growth
- Market Size And Growth
- Per Capita Consumption
- Imports And Growth
- Import Prices
- Production, In Physical Terms, 2012–2023
- Production, In Value Terms, 2012–2023
- Imports, In Physical Terms, 2012–2023
- Imports, In Value Terms, 2012–2023
- Imports, In Physical Terms, By Country, 2023
- Imports, In Physical Terms, By Country, 2012–2023
- Imports, In Value Terms, By Country, 2012–2023
- Import Prices, By Country Of Origin, 2012–2023
- Exports, In Physical Terms, 2012–2023
- Exports, In Value Terms, 2012–2023
- Exports, In Physical Terms, By Country, 2023
- Exports, In Physical Terms, By Country, 2012–2023
- Exports, In Value Terms, By Country, 2012–2023
- Export Prices, By Country Of Destination, 2012–2023


