World - Cassava - Market Analysis, Forecast, Size, Trends and Insights
Get instant access to more than 2 million reports, dashboards, and datasets on the IndexBox Platform.
View PricingGlobal Cassava Market to Witness 2.9% CAGR Growth in Volume Over Next Seven Years
IndexBox has just published a new report: World - Cassava - Market Analysis, Forecast, Size, Trends and Insights.
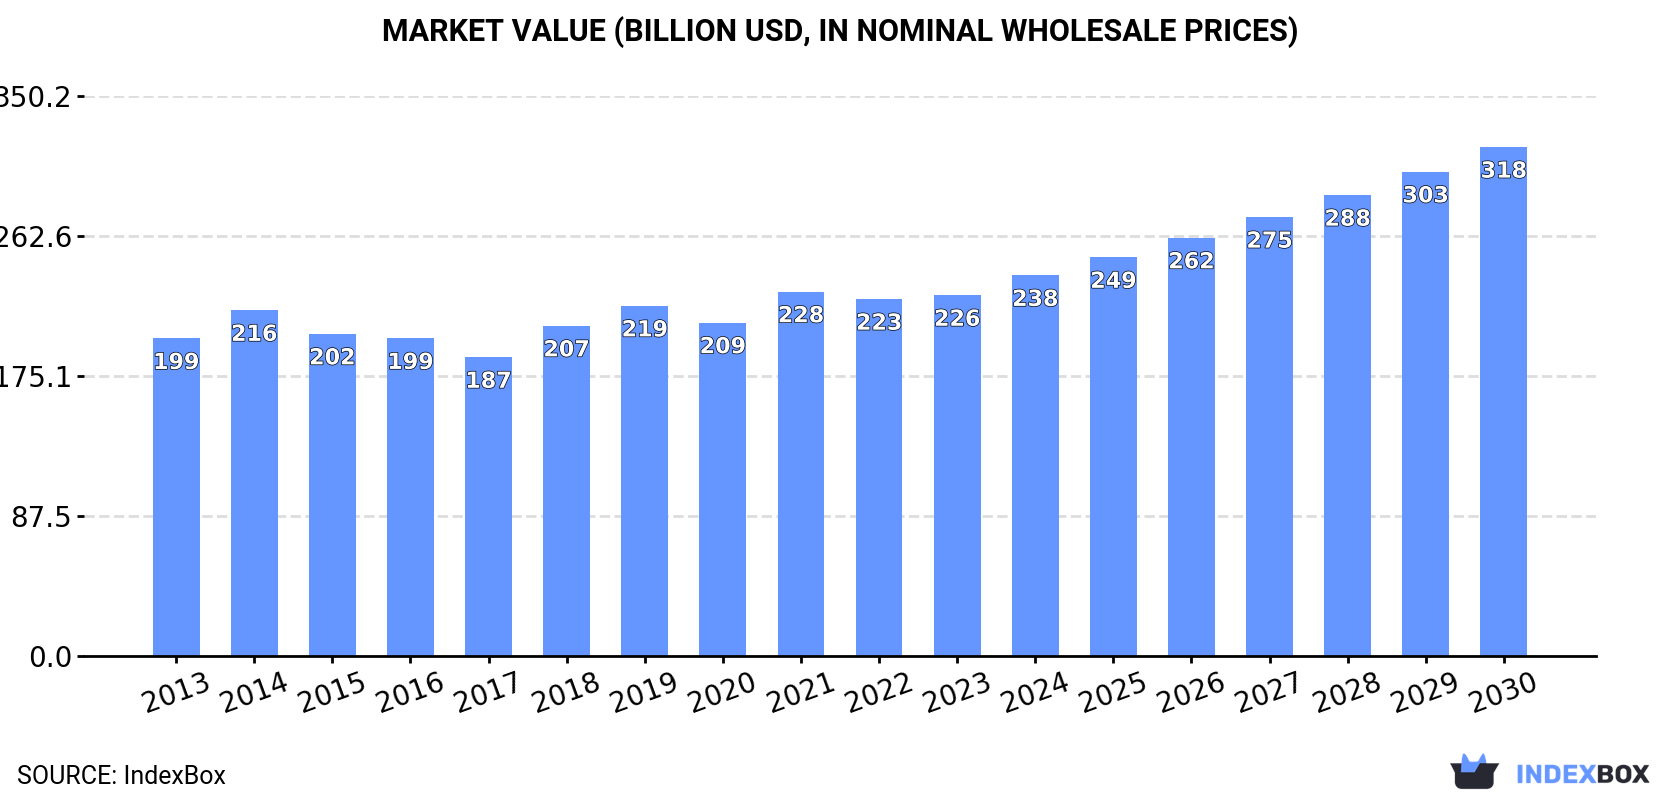
The global cassava market is expected to experience continued growth due to increasing demand, with a forecasted CAGR of +2.9% in volume and +5.0% in value from 2023 to 2030. By the end of 2030, the market volume is projected to reach 403M tons, with a market value of $318.4B in nominal prices.
Market Forecast
Driven by increasing demand for cassava worldwide, the market is expected to continue an upward consumption trend over the next seven years. Market performance is forecast to accelerate, expanding with an anticipated CAGR of +2.9% for the period from 2023 to 2030, which is projected to bring the market volume to 403M tons by the end of 2030.
In value terms, the market is forecast to increase with an anticipated CAGR of +5.0% for the period from 2023 to 2030, which is projected to bring the market value to $318.4B (in nominal wholesale prices) by the end of 2030.
Consumption
World Consumption of Cassava
After three years of growth, consumption of cassava decreased by -0.7% to 331M tons in 2023. The total consumption volume increased at an average annual rate of +1.7% from 2013 to 2023; the trend pattern remained relatively stable, with only minor fluctuations being observed throughout the analyzed period. The pace of growth appeared the most rapid in 2021 with an increase of 5.5% against the previous year. Global consumption peaked at 333M tons in 2022, and then fell in the following year.
The global cassava market revenue was estimated at $225.7B in 2023, approximately mirroring the previous year. This figure reflects the total revenues of producers and importers (excluding logistics costs, retail marketing costs, and retailers' margins, which will be included in the final consumer price). The market value increased at an average annual rate of +1.3% from 2013 to 2023; the trend pattern remained consistent, with somewhat noticeable fluctuations being observed throughout the analyzed period. Over the period under review, the global market reached the maximum level at $227.9B in 2021; however, from 2022 to 2023, consumption stood at a somewhat lower figure.
Consumption By Country
The countries with the highest volumes of consumption in 2023 were Nigeria (60M tons), Democratic Republic of the Congo (47M tons) and Thailand (34M tons), with a combined 43% share of global consumption. Ghana, Brazil, Cambodia, Indonesia, China, Angola, Vietnam, India, Mozambique and Cote d'Ivoire lagged somewhat behind, together accounting for a further 37%.
From 2013 to 2023, the biggest increases were recorded for Cote d'Ivoire (with a CAGR of +10.0%), while consumption for the other global leaders experienced more modest paces of growth.
In value terms, Democratic Republic of the Congo ($46.8B), Nigeria ($39.9B) and Brazil ($19.4B) were the countries with the highest levels of market value in 2023, with a combined 47% share of the global market. Ghana, Angola, Indonesia, Thailand, Cambodia, India, China, Vietnam, Cote d'Ivoire and Mozambique lagged somewhat behind, together comprising a further 29%.
Among the main consuming countries, Cambodia, with a CAGR of +8.5%, recorded the highest growth rate of market size over the period under review, while market for the other global leaders experienced more modest paces of growth.
The countries with the highest levels of cassava per capita consumption in 2023 were Cambodia (874 kg per person), Ghana (765 kg per person) and Thailand (486 kg per person).
From 2013 to 2023, the most notable rate of growth in terms of consumption, amongst the main consuming countries, was attained by Cambodia (with a CAGR of +7.7%), while consumption for the other global leaders experienced more modest paces of growth.
Production
World Production of Cassava
In 2023, after three years of growth, there was decline in production of cassava, when its volume decreased by -0.7% to 328M tons. The total output volume increased at an average annual rate of +1.6% over the period from 2013 to 2023; the trend pattern remained relatively stable, with somewhat noticeable fluctuations throughout the analyzed period. The most prominent rate of growth was recorded in 2021 with an increase of 5.7% against the previous year. Over the period under review, global production reached the peak volume at 330M tons in 2022, and then contracted in the following year. The general positive trend in terms output was largely conditioned by a modest expansion of the harvested area and a relatively flat trend pattern in yield figures.
In value terms, cassava production expanded remarkably to $245.6B in 2023 estimated in export price. The total output value increased at an average annual rate of +2.1% over the period from 2013 to 2023; the trend pattern indicated some noticeable fluctuations being recorded throughout the analyzed period. The most prominent rate of growth was recorded in 2021 when the production volume increased by 25% against the previous year. As a result, production attained the peak level of $258.4B. From 2022 to 2023, global production growth remained at a lower figure.
Production By Country
The countries with the highest volumes of production in 2023 were Nigeria (60M tons), Democratic Republic of the Congo (47M tons) and Thailand (35M tons), with a combined 43% share of global production. Ghana, Brazil, Cambodia, Indonesia, Vietnam, Angola, India, Mozambique, Cote d'Ivoire and Tanzania lagged somewhat behind, together comprising a further 37%.
From 2013 to 2023, the biggest increases were recorded for Cote d'Ivoire (with a CAGR of +10.0%), while production for the other global leaders experienced more modest paces of growth.
Yield
In 2023, the global average cassava yield reached 10 tons per ha, remaining stable against the previous year. Overall, the yield, however, showed a relatively flat trend pattern. The growth pace was the most rapid in 2016 when the yield increased by 4.6% against the previous year. Over the period under review, the average cassava yield hit record highs at 11 tons per ha in 2018; however, from 2019 to 2023, the yield stood at a somewhat lower figure.
Harvested Area
In 2023, approx. 32M ha of cassava were harvested worldwide; leveling off at the year before. The harvested area increased at an average annual rate of +2.1% from 2013 to 2023; the trend pattern remained relatively stable, with only minor fluctuations throughout the analyzed period. The growth pace was the most rapid in 2019 when the harvested area increased by 9.5%. Over the period under review, the harvested area dedicated to cassava production attained the maximum at 32M ha in 2022, and then shrank modestly in the following year.
Imports
World Imports of Cassava
After three years of growth, purchases abroad of cassava decreased by -14.7% to 10M tons in 2023. Over the period under review, total imports indicated modest growth from 2013 to 2023: its volume increased at an average annual rate of +1.7% over the last decade. The trend pattern, however, indicated some noticeable fluctuations being recorded throughout the analyzed period. Based on 2023 figures, imports increased by +94.8% against 2019 indices. The most prominent rate of growth was recorded in 2022 when imports increased by 34% against the previous year. As a result, imports reached the peak of 12M tons, and then contracted in the following year.
In value terms, cassava imports reduced notably to $2.6B in 2023. Overall, total imports indicated a modest expansion from 2013 to 2023: its value increased at an average annual rate of +1.9% over the last decade. The trend pattern, however, indicated some noticeable fluctuations being recorded throughout the analyzed period. Based on 2023 figures, imports increased by +97.0% against 2019 indices. The most prominent rate of growth was recorded in 2021 with an increase of 49% against the previous year. Global imports peaked at $3.1B in 2022, and then fell sharply in the following year.
Imports By Country
China (5.6M tons) and Thailand (4M tons) dominates imports structure, together achieving 94% of total imports. South Korea (263K tons) followed a long way behind the leaders.
From 2013 to 2023, the biggest increases were recorded for Thailand (with a CAGR of +23.9%), while purchases for the other global leaders experienced a decline in the imports figures.
In value terms, China ($1.6B) constitutes the largest market for imported cassava worldwide, comprising 59% of global imports. The second position in the ranking was taken by Thailand ($564M), with a 22% share of global imports.
From 2013 to 2023, the average annual rate of growth in terms of value in China totaled -1.6%. In the other countries, the average annual rates were as follows: Thailand (+24.4% per year) and South Korea (-4.3% per year).
Import Prices By Country
The average cassava import price stood at $254 per ton in 2023, almost unchanged from the previous year. Over the period under review, the import price, however, continues to indicate a relatively flat trend pattern. The most prominent rate of growth was recorded in 2021 when the average import price increased by 16% against the previous year. As a result, import price reached the peak level of $264 per ton. From 2022 to 2023, the average import prices failed to regain momentum.
There were significant differences in the average prices amongst the major importing countries. In 2023, amid the top importers, the country with the highest price was South Korea ($321 per ton), while Thailand ($140 per ton) was amongst the lowest.
From 2013 to 2023, the most notable rate of growth in terms of prices was attained by South Korea (+3.5%), while the other global leaders experienced more modest paces of growth.
Exports
World Exports of Cassava
In 2023, shipments abroad of cassava decreased by -16.9% to 7.9M tons for the first time since 2019, thus ending a three-year rising trend. Overall, exports saw a mild slump. The pace of growth was the most pronounced in 2020 with an increase of 59% against the previous year. Over the period under review, the global exports attained the peak figure at 11M tons in 2015; however, from 2016 to 2023, the exports stood at a somewhat lower figure.
In value terms, cassava exports declined sharply to $2.9B in 2023. Over the period under review, exports, however, enjoyed a notable increase. The most prominent rate of growth was recorded in 2021 with an increase of 65%. Over the period under review, the global exports hit record highs at $3.6B in 2022, and then fell markedly in the following year.
Exports By Country
In 2023, Thailand (4.5M tons) was the largest exporter of cassava, creating 57% of total exports. Cambodia (2.2M tons) took the second position in the ranking, distantly followed by Vietnam (806K tons). All these countries together took approx. 38% share of total exports. Lao People's Democratic Republic (187K tons) took a little share of total exports.
From 2013 to 2023, average annual rates of growth with regard to cassava exports from Thailand stood at -2.5%. At the same time, Lao People's Democratic Republic (+30.5%) and Cambodia (+2.5%) displayed positive paces of growth. Moreover, Lao People's Democratic Republic emerged as the fastest-growing exporter exported in the world, with a CAGR of +30.5% from 2013-2023. By contrast, Vietnam (-6.8%) illustrated a downward trend over the same period. From 2013 to 2023, the share of Cambodia and Lao People's Democratic Republic increased by +9.3 and +2.2 percentage points, respectively.
In value terms, the largest cassava supplying countries worldwide were Thailand ($1.2B), Cambodia ($1B) and Lao People's Democratic Republic ($278M), together comprising 85% of global exports.
Lao People's Democratic Republic, with a CAGR of +42.7%, saw the highest rates of growth with regard to the value of exports, in terms of the main exporting countries over the period under review, while shipments for the other global leaders experienced mixed trends in the exports figures.
Export Prices By Country
The average cassava export price stood at $369 per ton in 2023, reducing by -2.4% against the previous year. Overall, export price indicated a resilient expansion from 2013 to 2023: its price increased at an average annual rate of +5.2% over the last decade. The trend pattern, however, indicated some noticeable fluctuations being recorded throughout the analyzed period. Based on 2023 figures, cassava export price increased by +11.1% against 2019 indices. The growth pace was the most rapid in 2019 when the average export price increased by 34% against the previous year. The global export price peaked at $378 per ton in 2022, and then contracted modestly in the following year.
Prices varied noticeably by country of origin: amid the top suppliers, the country with the highest price was Lao People's Democratic Republic ($1,488 per ton), while Thailand ($258 per ton) was amongst the lowest.
From 2013 to 2023, the most notable rate of growth in terms of prices was attained by Lao People's Democratic Republic (+12.6%), while the other global leaders experienced more modest paces of growth.
This report provides an in-depth analysis of the global cassava market. Within it, you will discover the latest data on market trends and opportunities by country, consumption, production and price developments, as well as the global trade (imports and exports). The forecast exhibits the market prospects through 2030.
Product coverage:
- FCL 125 - Cassava
Country coverage:
Worldwide - the report contains statistical data for 200 countries and includes detailed profiles of the 50 largest consuming countries:
- USA
- China
- Japan
- Germany
- United Kingdom
- France
- Brazil
- Italy
- Russian Federation
- India
- Canada
- Australia
- Republic of Korea
- Spain
- Mexico
- Indonesia
- Netherlands
- Turkey
- Saudi Arabia
- Switzerland
- Sweden
- Nigeria
- Poland
- Belgium
- Argentina
- Norway
- Austria
- Thailand
- United Arab Emirates
- Colombia
- Denmark
- South Africa
- Malaysia
- Israel
- Singapore
- Egypt
- Philippines
- Finland
- Chile
- Ireland
- Pakistan
- Greece
- Portugal
- Kazakhstan
- Algeria
- Czech Republic
- Qatar
- Peru
- Romania
- Vietnam
+ the largest producing countries
Data coverage:
- Global market volume and value
- Per Capita consumption
- Forecast of the market dynamics in the medium term
- Global production, split by region and country
- Global trade (exports and imports)
- Export and import prices
- Market trends, drivers and restraints
- Key market players and their profiles
Reasons to buy this report:
- Take advantage of the latest data
- Find deeper insights into current market developments
- Discover vital success factors affecting the market
This report is designed for manufacturers, distributors, importers, and wholesalers, as well as for investors, consultants and advisors.
In this report, you can find information that helps you to make informed decisions on the following issues:
- How to diversify your business and benefit from new market opportunities
- How to load your idle production capacity
- How to boost your sales on overseas markets
- How to increase your profit margins
- How to make your supply chain more sustainable
- How to reduce your production and supply chain costs
- How to outsource production to other countries
- How to prepare your business for global expansion
While doing this research, we combine the accumulated expertise of our analysts and the capabilities of artificial intelligence. The AI-based platform, developed by our data scientists, constitutes the key working tool for business analysts, empowering them to discover deep insights and ideas from the marketing data.
-
1. INTRODUCTION
Making Data-Driven Decisions to Grow Your Business
- REPORT DESCRIPTION
- RESEARCH METHODOLOGY AND AI PLATFORM
- DATA-DRIVEN DECISIONS FOR YOUR BUSINESS
- GLOSSARY AND SPECIFIC TERMS
-
2. EXECUTIVE SUMMARY
A Quick Overview of Market Performance
- KEY FINDINGS
- MARKET TRENDS This Chapter is Available Only for the Professional Edition PRO
-
3. MARKET OVERVIEW
Understanding the Current State of The Market and Its Prospects
- MARKET SIZE
- CONSUMPTION BY COUNTRY
- MARKET FORECAST TO 2030
-
4. MOST PROMISING PRODUCT
Finding New Products to Diversify Your Business
This Chapter is Available Only for the Professional Edition PRO- TOP PRODUCTS TO DIVERSIFY YOUR BUSINESS
- BEST-SELLING PRODUCTS
- MOST CONSUMED PRODUCT
- MOST TRADED PRODUCT
- MOST PROFITABLE PRODUCT FOR EXPORT
-
5. MOST PROMISING SUPPLYING COUNTRIES
Choosing the Best Countries to Establish Your Sustainable Supply Chain
This Chapter is Available Only for the Professional Edition PRO- TOP COUNTRIES TO SOURCE YOUR PRODUCT
- TOP PRODUCING COUNTRIES
- COUNTRIES WITH TOP YIELDS
- TOP EXPORTING COUNTRIES
- LOW-COST EXPORTING COUNTRIES
-
6. MOST PROMISING OVERSEAS MARKETS
Choosing the Best Countries to Boost Your Exports
This Chapter is Available Only for the Professional Edition PRO- TOP OVERSEAS MARKETS FOR EXPORTING YOUR PRODUCT
- TOP CONSUMING MARKETS
- UNSATURATED MARKETS
- TOP IMPORTING MARKETS
- MOST PROFITABLE MARKETS
7. GLOBAL PRODUCTION
The Latest Trends and Insights into The Industry
- PRODUCTION VOLUME AND VALUE
- PRODUCTION BY COUNTRY
- HARVESTED AREA AND YIELD BY COUNTRY
8. GLOBAL IMPORTS
The Largest Importers on The Market and How They Succeed
- IMPORTS FROM 2012–2023
- IMPORTS BY COUNTRY
- IMPORT PRICES BY COUNTRY
9. GLOBAL EXPORTS
The Largest Exporters on The Market and How They Succeed
- EXPORTS FROM 2012–2023
- EXPORTS BY COUNTRY
- EXPORT PRICES BY COUNTRY
-
10. PROFILES OF MAJOR PRODUCERS
The Largest Producers on The Market and Their Profiles
This Chapter is Available Only for the Professional Edition PRO -
11. COUNTRY PROFILES
The Largest Markets And Their Profiles
This Chapter is Available Only for the Professional Edition PRO- United States
- China
- Japan
- Germany
- United Kingdom
- France
- Brazil
- Italy
- Russian Federation
- India
- Canada
- Australia
- Republic of Korea
- Spain
- Mexico
- Indonesia
- Netherlands
- Turkey
- Saudi Arabia
- Switzerland
- Sweden
- Nigeria
- Poland
- Belgium
- Argentina
- Norway
- Austria
- Thailand
- United Arab Emirates
- Colombia
- Denmark
- South Africa
- Malaysia
- Israel
- Singapore
- Egypt
- Philippines
- Finland
- Chile
- Ireland
- Pakistan
- Greece
- Portugal
- Kazakhstan
- Algeria
- Czech Republic
- Qatar
- Peru
- Romania
- Vietnam
-
LIST OF TABLES
- Key Findings In 2023
- Market Volume, In Physical Terms, 2012–2023
- Market Value, 2012–2023
- Per Capita Consumption, By Country, 2018–2023
- Production, In Physical Terms, By Country, 2012–2023
- Harvested Area, By Country, 2012-2023
- Yield, By Country, 2012-2023
- Imports, In Physical Terms, By Country, 2012–2023
- Imports, In Value Terms, By Country, 2012–2023
- Import Prices, By Country Of Destination, 2012–2023
- Exports, In Physical Terms, By Country, 2012–2023
- Exports, In Value Terms, By Country, 2012–2023
- Export Prices, By Country Of Origin, 2012–2023
-
LIST OF FIGURES
- Market Volume, In Physical Terms, 2012–2023
- Market Value, 2012–2023
- Consumption, By Country, 2023
- Market Volume Forecast to 2030
- Market Value Forecast to 2030
- Products: Market Size And Growth, By Type
- Products: Average Per Capita Consumption, By Type
- Products: Exports And Growth, By Type
- Products: Export Prices And Growth, By Type
- Production Volume And Growth
- Yield And Growth
- Exports And Growth
- Export Prices And Growth
- Market Size And Growth
- Per Capita Consumption
- Imports And Growth
- Import Prices
- Production, In Physical Terms, 2012–2023
- Production, In Value Terms, 2012–2023
- Area Harvested, 2012–2023
- Yield, 2012–2023
- Production, By Country, 2023
- Production, In Physical Terms, By Country, 2012–2023
- Harvested Area, By Country, 2023
- Harvested Area, By Country, 2012-2023
- Yield, By Country, 2012-2023
- Imports, In Physical Terms, 2012–2023
- Imports, In Value Terms, 2012–2023
- Imports, In Physical Terms, By Country, 2023
- Imports, In Physical Terms, By Country, 2012–2023
- Imports, In Value Terms, By Country, 2012–2023
- Import Prices, By Country, 2012–2023
- Exports, In Physical Terms, 2012–2023
- Exports, In Value Terms, 2012–2023
- Exports, In Physical Terms, By Country, 2023
- Exports, In Physical Terms, By Country, 2012–2023
- Exports, In Value Terms, By Country, 2012–2023
- Export Prices, 2012–2023


