World - Cauliflower And Broccoli - Market Analysis, Forecast, Size, Trends and Insights
Get instant access to more than 2 million reports, dashboards, and datasets on the IndexBox Platform.
View PricingGlobal Cauliflower and Broccoli Market to Expand with an Accelerated CAGR of +2.3% through 2030, Reaching 30M Tons
IndexBox has just published a new report: World - Cauliflower And Broccoli - Market Analysis, Forecast, Size, Trends and Insights.
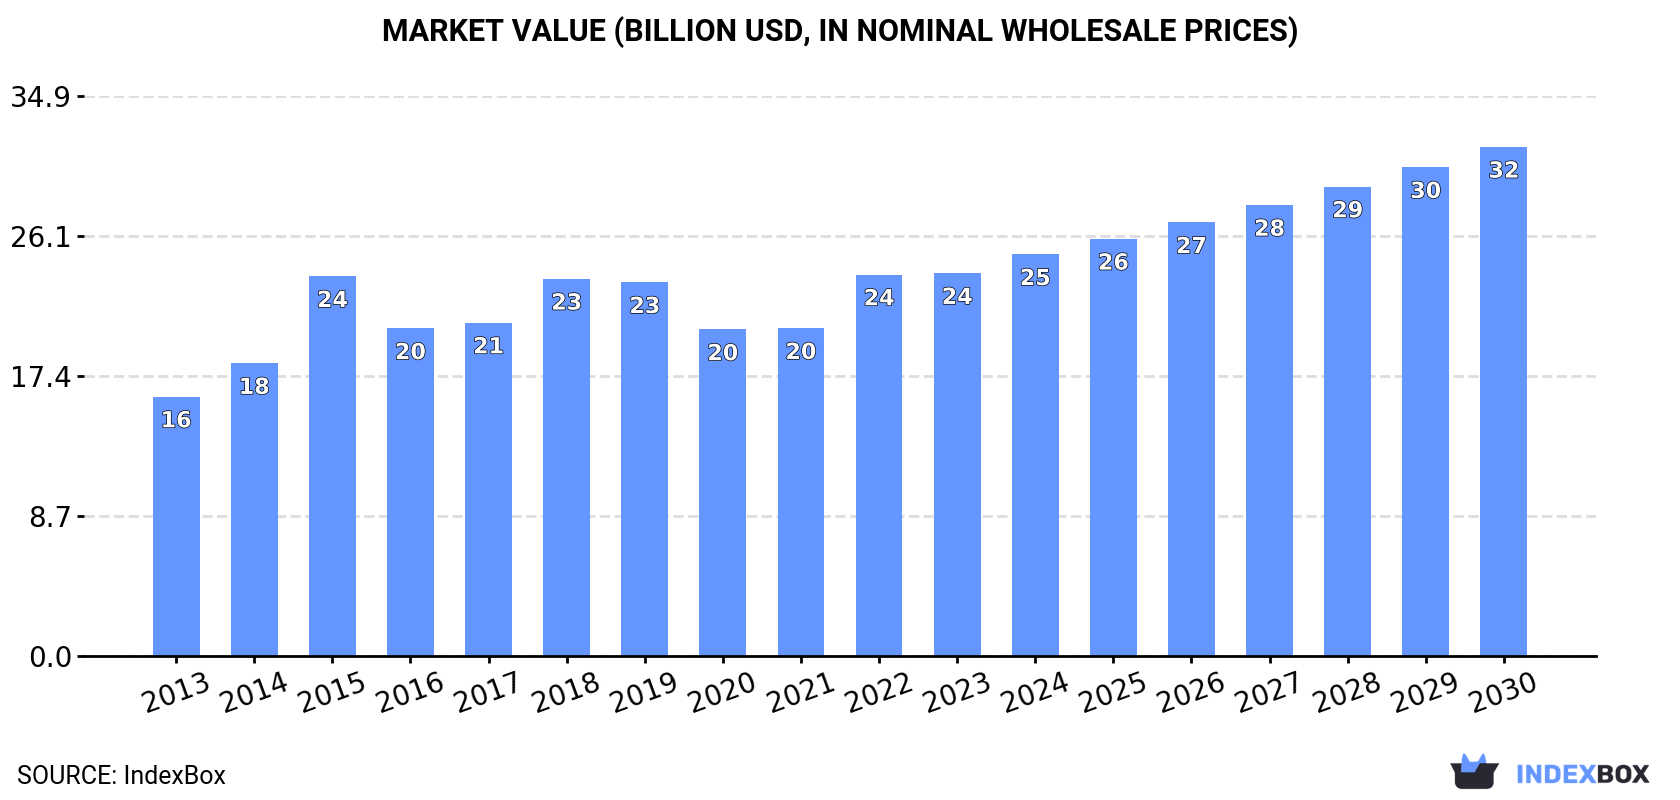
The cauliflower and broccoli market is expected to see significant growth in the coming years driven by increasing global demand. Market performance is forecasted to accelerate with a CAGR of +2.3% in volume and +4.2% in value from 2023 to 2030, reaching a market volume of 30M tons and a value of $31.7B by the end of 2030.
Market Forecast
Driven by increasing demand for cauliflower and broccoli worldwide, the market is expected to continue an upward consumption trend over the next seven-year period. Market performance is forecast to accelerate, expanding with an anticipated CAGR of +2.3% for the period from 2023 to 2030, which is projected to bring the market volume to 30M tons by the end of 2030.
In value terms, the market is forecast to increase with an anticipated CAGR of +4.2% for the period from 2023 to 2030, which is projected to bring the market value to $31.7B (in nominal wholesale prices) by the end of 2030.
Consumption
World Consumption of Cauliflower And Broccoli
In 2023, consumption of cauliflower and broccoli decreased by -0.3% to 26M tons, falling for the second consecutive year after six years of growth. The total consumption volume increased at an average annual rate of +1.0% over the period from 2013 to 2023; the trend pattern remained relatively stable, with somewhat noticeable fluctuations being recorded throughout the analyzed period. Global consumption peaked at 26M tons in 2021; however, from 2022 to 2023, consumption failed to regain momentum.
The global cauliflower and broccoli market size stood at $23.8B in 2023, remaining stable against the previous year. This figure reflects the total revenues of producers and importers (excluding logistics costs, retail marketing costs, and retailers' margins, which will be included in the final consumer price). The market value increased at an average annual rate of +4.0% over the period from 2013 to 2023; the trend pattern indicated some noticeable fluctuations being recorded throughout the analyzed period. Over the period under review, the global market attained the maximum level in 2023 and is likely to see steady growth in the near future.
Consumption By Country
The countries with the highest volumes of consumption in 2023 were India (9.4M tons), China (9.3M tons) and the United States (870K tons), with a combined 77% share of global consumption. Spain lagged somewhat behind, accounting for a further 1.6%.
From 2013 to 2023, the biggest increases were recorded for Spain (with a CAGR of +17.1%), while consumption for the other global leaders experienced more modest paces of growth.
In value terms, China ($9.9B) led the market, alone. The second position in the ranking was held by India ($3.9B). It was followed by the United States.
From 2013 to 2023, the average annual growth rate of value in China totaled +4.4%. In the other countries, the average annual rates were as follows: India (+1.0% per year) and the United States (+2.1% per year).
The countries with the highest levels of cauliflower and broccoli per capita consumption in 2023 were Spain (8.6 kg per person), India (6.6 kg per person) and China (6.6 kg per person).
From 2013 to 2023, the most notable rate of growth in terms of consumption, amongst the main consuming countries, was attained by Spain (with a CAGR of +17.0%), while consumption for the other global leaders experienced more modest paces of growth.
Production
World Production of Cauliflower And Broccoli
After two years of growth, production of cauliflower and broccoli decreased by -1.6% to 26M tons in 2023. The total output volume increased at an average annual rate of +1.1% over the period from 2013 to 2023; the trend pattern remained relatively stable, with only minor fluctuations throughout the analyzed period. The pace of growth was the most pronounced in 2014 with an increase of 4.3%. Global production peaked at 27M tons in 2022, and then fell in the following year. The general positive trend in terms output was largely conditioned by a mild expansion of the harvested area and a relatively flat trend pattern in yield figures.
In value terms, cauliflower and broccoli production amounted to $24.3B in 2023 estimated in export price. The total output value increased at an average annual rate of +3.8% from 2013 to 2023; the trend pattern indicated some noticeable fluctuations being recorded in certain years. The pace of growth appeared the most rapid in 2015 when the production volume increased by 28% against the previous year. As a result, production reached the peak level of $25.1B. From 2016 to 2023, global production growth remained at a lower figure.
Production By Country
The countries with the highest volumes of production in 2023 were China (9.6M tons), India (9.4M tons) and the United States (950K tons), together accounting for 76% of global production. Mexico and Spain lagged somewhat behind, together comprising a further 6.1%.
From 2013 to 2023, the most notable rate of growth in terms of production, amongst the main producing countries, was attained by Mexico (with a CAGR of +5.4%), while production for the other global leaders experienced more modest paces of growth.
Yield
The global average cauliflower and broccoli yield declined to 19 tons per ha in 2023, which is down by -1.7% compared with the year before. In general, the yield continues to indicate a relatively flat trend pattern. The growth pace was the most rapid in 2022 with an increase of 1.6%. As a result, the yield reached the peak level of 19 tons per ha, and then dropped slightly in the following year.
Harvested Area
The global cauliflower and broccoli harvested area was estimated at 1.4M ha in 2023, stabilizing at 2022. The harvested area increased at an average annual rate of +1.1% from 2013 to 2023; the trend pattern remained consistent, with only minor fluctuations throughout the analyzed period. The most prominent rate of growth was recorded in 2017 with an increase of 4.5%. The global harvested area peaked at 1.4M ha in 2021; afterwards, it flattened through to 2023.
Imports
World Imports of Cauliflower And Broccoli
In 2023, global cauliflower and broccoli imports reduced to 1.6M tons, which is down by -2.1% compared with 2022 figures. Over the period under review, imports saw a relatively flat trend pattern. The growth pace was the most rapid in 2021 when imports increased by 15% against the previous year. Global imports peaked at 2.1M tons in 2019; however, from 2020 to 2023, imports failed to regain momentum.
In value terms, cauliflower and broccoli imports expanded notably to $2.7B in 2023. The total import value increased at an average annual rate of +3.4% from 2013 to 2023; however, the trend pattern indicated some noticeable fluctuations being recorded in certain years. The pace of growth was the most pronounced in 2022 when imports increased by 19% against the previous year. Global imports peaked in 2023 and are expected to retain growth in years to come.
Imports By Country
In 2023, Canada (317K tons), distantly followed by the UK (125K tons), Germany (84K tons), the United States (80K tons) and Malaysia (74K tons) were the main importers of cauliflower and broccoli, together mixing up 43% of total imports. France (60K tons), the Netherlands (54K tons), Thailand (44K tons), Hong Kong SAR (44K tons), Singapore (42K tons), Switzerland (41K tons), El Salvador (37K tons) and Poland (36K tons) took a little share of total imports.
Imports into Canada increased at an average annual rate of +6.4% from 2013 to 2023. At the same time, Hong Kong SAR (+12.6%), Switzerland (+8.0%), the United States (+7.3%), El Salvador (+3.3%), Malaysia (+2.8%) and Singapore (+1.9%) displayed positive paces of growth. Moreover, Hong Kong SAR emerged as the fastest-growing importer imported in the world, with a CAGR of +12.6% from 2013-2023. Poland experienced a relatively flat trend pattern. By contrast, Thailand (-3.2%), France (-4.6%), Germany (-4.6%), the Netherlands (-5.2%) and the UK (-10.2%) illustrated a downward trend over the same period. Canada (+10 p.p.), the United States (+2.8 p.p.) and Hong Kong SAR (+2 p.p.) significantly strengthened its position in terms of the global imports, while France, the Netherlands, Germany and the UK saw its share reduced by -1.7%, -1.9%, -2.5% and -13.1% from 2013 to 2023, respectively. The shares of the other countries remained relatively stable throughout the analyzed period.
In value terms, the largest cauliflower and broccoli importing markets worldwide were the UK ($609M), Canada ($507M) and Germany ($156M), with a combined 47% share of global imports. Malaysia, the United States, Switzerland, France, the Netherlands, Singapore, Poland, Hong Kong SAR, Thailand and El Salvador lagged somewhat behind, together accounting for a further 27%.
Hong Kong SAR, with a CAGR of +18.9%, recorded the highest rates of growth with regard to the value of imports, among the main importing countries over the period under review, while purchases for the other global leaders experienced more modest paces of growth.
Import Prices By Country
The average cauliflower and broccoli import price stood at $1,709 per ton in 2023, growing by 13% against the previous year. Overall, import price indicated measured growth from 2013 to 2023: its price increased at an average annual rate of +4.4% over the last decade. The trend pattern, however, indicated some noticeable fluctuations being recorded throughout the analyzed period. Based on 2023 figures, cauliflower and broccoli import price increased by +67.4% against 2015 indices. The pace of growth was the most pronounced in 2022 when the average import price increased by 20% against the previous year. Over the period under review, average import prices hit record highs in 2023 and is expected to retain growth in years to come.
Prices varied noticeably by country of destination: amid the top importers, the country with the highest price was the UK ($4,886 per ton), while El Salvador ($188 per ton) was amongst the lowest.
From 2013 to 2023, the most notable rate of growth in terms of prices was attained by the UK (+15.2%), while the other global leaders experienced more modest paces of growth.
Exports
World Exports of Cauliflower And Broccoli
After two years of growth, shipments abroad of cauliflower and broccoli decreased by -14.1% to 2.2M tons in 2023. Overall, exports, however, showed a relatively flat trend pattern. The pace of growth was the most pronounced in 2022 when exports increased by 26% against the previous year. Over the period under review, the global exports hit record highs at 2.6M tons in 2019; however, from 2020 to 2023, the exports failed to regain momentum.
In value terms, cauliflower and broccoli exports surged to $3B in 2023. The total export value increased at an average annual rate of +2.7% from 2013 to 2023; however, the trend pattern indicated some noticeable fluctuations being recorded in certain years. The global exports peaked at $3B in 2019; afterwards, it flattened through to 2023.
Exports By Country
Mexico represented the main exporter of cauliflower and broccoli in the world, with the volume of exports recording 734K tons, which was approx. 33% of total exports in 2023. Spain (376K tons) ranks second in terms of the total exports with a 17% share, followed by China (12%), the United States (7.2%) and France (4.9%). Guatemala (87K tons), Italy (83K tons), Iran (60K tons), the Netherlands (50K tons), Canada (47K tons) and Uzbekistan (40K tons) held a little share of total exports.
From 2013 to 2023, the most notable rate of growth in terms of shipments, amongst the key exporting countries, was attained by Iran (with a CAGR of +45.4%), while the other global leaders experienced more modest paces of growth.
In value terms, the largest cauliflower and broccoli supplying countries worldwide were Mexico ($917M), Spain ($703M) and China ($291M), with a combined 63% share of global exports. The United States, Italy, France, the Netherlands, Guatemala, Canada, Uzbekistan and Iran lagged somewhat behind, together comprising a further 28%.
Uzbekistan, with a CAGR of +41.8%, recorded the highest rates of growth with regard to the value of exports, among the main exporting countries over the period under review, while shipments for the other global leaders experienced more modest paces of growth.
Export Prices By Country
In 2023, the average cauliflower and broccoli export price amounted to $1,355 per ton, jumping by 35% against the previous year. Over the last decade, it increased at an average annual rate of +2.5%. As a result, the export price reached the peak level and is likely to continue growth in the immediate term.
Prices varied noticeably by country of origin: amid the top suppliers, the country with the highest price was the Netherlands ($2,162 per ton), while Iran ($228 per ton) was amongst the lowest.
From 2013 to 2023, the most notable rate of growth in terms of prices was attained by Italy (+7.8%), while the other global leaders experienced more modest paces of growth.
This report provides an in-depth analysis of the global cauliflower and broccoli market. Within it, you will discover the latest data on market trends and opportunities by country, consumption, production and price developments, as well as the global trade (imports and exports). The forecast exhibits the market prospects through 2030.
Product coverage:
- FCL 393 - Cauliflowers and broccoli
Country coverage:
Worldwide - the report contains statistical data for 200 countries and includes detailed profiles of the 50 largest consuming countries:
- USA
- China
- Japan
- Germany
- United Kingdom
- France
- Brazil
- Italy
- Russian Federation
- India
- Canada
- Australia
- Republic of Korea
- Spain
- Mexico
- Indonesia
- Netherlands
- Turkey
- Saudi Arabia
- Switzerland
- Sweden
- Nigeria
- Poland
- Belgium
- Argentina
- Norway
- Austria
- Thailand
- United Arab Emirates
- Colombia
- Denmark
- South Africa
- Malaysia
- Israel
- Singapore
- Egypt
- Philippines
- Finland
- Chile
- Ireland
- Pakistan
- Greece
- Portugal
- Kazakhstan
- Algeria
- Czech Republic
- Qatar
- Peru
- Romania
- Vietnam
+ the largest producing countries
Data coverage:
- Global market volume and value
- Per Capita consumption
- Forecast of the market dynamics in the medium term
- Global production, split by region and country
- Global trade (exports and imports)
- Export and import prices
- Market trends, drivers and restraints
- Key market players and their profiles
Reasons to buy this report:
- Take advantage of the latest data
- Find deeper insights into current market developments
- Discover vital success factors affecting the market
This report is designed for manufacturers, distributors, importers, and wholesalers, as well as for investors, consultants and advisors.
In this report, you can find information that helps you to make informed decisions on the following issues:
- How to diversify your business and benefit from new market opportunities
- How to load your idle production capacity
- How to boost your sales on overseas markets
- How to increase your profit margins
- How to make your supply chain more sustainable
- How to reduce your production and supply chain costs
- How to outsource production to other countries
- How to prepare your business for global expansion
While doing this research, we combine the accumulated expertise of our analysts and the capabilities of artificial intelligence. The AI-based platform, developed by our data scientists, constitutes the key working tool for business analysts, empowering them to discover deep insights and ideas from the marketing data.
-
1. INTRODUCTION
Making Data-Driven Decisions to Grow Your Business
- REPORT DESCRIPTION
- RESEARCH METHODOLOGY AND AI PLATFORM
- DATA-DRIVEN DECISIONS FOR YOUR BUSINESS
- GLOSSARY AND SPECIFIC TERMS
-
2. EXECUTIVE SUMMARY
A Quick Overview of Market Performance
- KEY FINDINGS
- MARKET TRENDS This Chapter is Available Only for the Professional Edition PRO
-
3. MARKET OVERVIEW
Understanding the Current State of The Market and Its Prospects
- MARKET SIZE
- CONSUMPTION BY COUNTRY
- MARKET FORECAST TO 2030
-
4. MOST PROMISING PRODUCT
Finding New Products to Diversify Your Business
This Chapter is Available Only for the Professional Edition PRO- TOP PRODUCTS TO DIVERSIFY YOUR BUSINESS
- BEST-SELLING PRODUCTS
- MOST CONSUMED PRODUCT
- MOST TRADED PRODUCT
- MOST PROFITABLE PRODUCT FOR EXPORT
-
5. MOST PROMISING SUPPLYING COUNTRIES
Choosing the Best Countries to Establish Your Sustainable Supply Chain
This Chapter is Available Only for the Professional Edition PRO- TOP COUNTRIES TO SOURCE YOUR PRODUCT
- TOP PRODUCING COUNTRIES
- COUNTRIES WITH TOP YIELDS
- TOP EXPORTING COUNTRIES
- LOW-COST EXPORTING COUNTRIES
-
6. MOST PROMISING OVERSEAS MARKETS
Choosing the Best Countries to Boost Your Exports
This Chapter is Available Only for the Professional Edition PRO- TOP OVERSEAS MARKETS FOR EXPORTING YOUR PRODUCT
- TOP CONSUMING MARKETS
- UNSATURATED MARKETS
- TOP IMPORTING MARKETS
- MOST PROFITABLE MARKETS
7. GLOBAL PRODUCTION
The Latest Trends and Insights into The Industry
- PRODUCTION VOLUME AND VALUE
- PRODUCTION BY COUNTRY
- HARVESTED AREA AND YIELD BY COUNTRY
8. GLOBAL IMPORTS
The Largest Importers on The Market and How They Succeed
- IMPORTS FROM 2012–2023
- IMPORTS BY COUNTRY
- IMPORT PRICES BY COUNTRY
9. GLOBAL EXPORTS
The Largest Exporters on The Market and How They Succeed
- EXPORTS FROM 2012–2023
- EXPORTS BY COUNTRY
- EXPORT PRICES BY COUNTRY
-
10. PROFILES OF MAJOR PRODUCERS
The Largest Producers on The Market and Their Profiles
This Chapter is Available Only for the Professional Edition PRO -
11. COUNTRY PROFILES
The Largest Markets And Their Profiles
This Chapter is Available Only for the Professional Edition PRO- United States
- China
- Japan
- Germany
- United Kingdom
- France
- Brazil
- Italy
- Russian Federation
- India
- Canada
- Australia
- Republic of Korea
- Spain
- Mexico
- Indonesia
- Netherlands
- Turkey
- Saudi Arabia
- Switzerland
- Sweden
- Nigeria
- Poland
- Belgium
- Argentina
- Norway
- Austria
- Thailand
- United Arab Emirates
- Colombia
- Denmark
- South Africa
- Malaysia
- Israel
- Singapore
- Egypt
- Philippines
- Finland
- Chile
- Ireland
- Pakistan
- Greece
- Portugal
- Kazakhstan
- Algeria
- Czech Republic
- Qatar
- Peru
- Romania
- Vietnam
-
LIST OF TABLES
- Key Findings In 2023
- Market Volume, In Physical Terms, 2012–2023
- Market Value, 2012–2023
- Per Capita Consumption, By Country, 2018–2023
- Production, In Physical Terms, By Country, 2012–2023
- Harvested Area, By Country, 2012-2023
- Yield, By Country, 2012-2023
- Imports, In Physical Terms, By Country, 2012–2023
- Imports, In Value Terms, By Country, 2012–2023
- Import Prices, By Country Of Destination, 2012–2023
- Exports, In Physical Terms, By Country, 2012–2023
- Exports, In Value Terms, By Country, 2012–2023
- Export Prices, By Country Of Origin, 2012–2023
-
LIST OF FIGURES
- Market Volume, In Physical Terms, 2012–2023
- Market Value, 2012–2023
- Consumption, By Country, 2023
- Market Volume Forecast to 2030
- Market Value Forecast to 2030
- Products: Market Size And Growth, By Type
- Products: Average Per Capita Consumption, By Type
- Products: Exports And Growth, By Type
- Products: Export Prices And Growth, By Type
- Production Volume And Growth
- Yield And Growth
- Exports And Growth
- Export Prices And Growth
- Market Size And Growth
- Per Capita Consumption
- Imports And Growth
- Import Prices
- Production, In Physical Terms, 2012–2023
- Production, In Value Terms, 2012–2023
- Area Harvested, 2012–2023
- Yield, 2012–2023
- Production, By Country, 2023
- Production, In Physical Terms, By Country, 2012–2023
- Harvested Area, By Country, 2023
- Harvested Area, By Country, 2012-2023
- Yield, By Country, 2012-2023
- Imports, In Physical Terms, 2012–2023
- Imports, In Value Terms, 2012–2023
- Imports, In Physical Terms, By Country, 2023
- Imports, In Physical Terms, By Country, 2012–2023
- Imports, In Value Terms, By Country, 2012–2023
- Import Prices, By Country, 2012–2023
- Exports, In Physical Terms, 2012–2023
- Exports, In Value Terms, 2012–2023
- Exports, In Physical Terms, By Country, 2023
- Exports, In Physical Terms, By Country, 2012–2023
- Exports, In Value Terms, By Country, 2012–2023
- Export Prices, 2012–2023


