World - Cement Clinker - Market Analysis, Forecast, Size, Trends And Insights
Get instant access to more than 2 million reports, dashboards, and datasets on the IndexBox Platform.
View PricingGlobal Cement Clinker Market to Grow at a CAGR of +3.1% from 2023 to 2030, Reaching 4,863M tons
IndexBox has just published a new report: World - Cement Clinker - Market Analysis, Forecast, Size, Trends And Insights.
Driven by increasing global demand, the market for cement clinker is expected to see significant growth in the coming years. With a forecasted CAGR of 3.1% in volume and 5.4% in value, the market is projected to expand, reaching 4,863M tons and $392.9B by 2030.
Market Forecast
Driven by increasing demand for cement clinker worldwide, the market is expected to continue an upward consumption trend over the next seven-year period. Market performance is forecast to accelerate, expanding with an anticipated CAGR of +3.1% for the period from 2023 to 2030, which is projected to bring the market volume to 4,863M tons by the end of 2030.
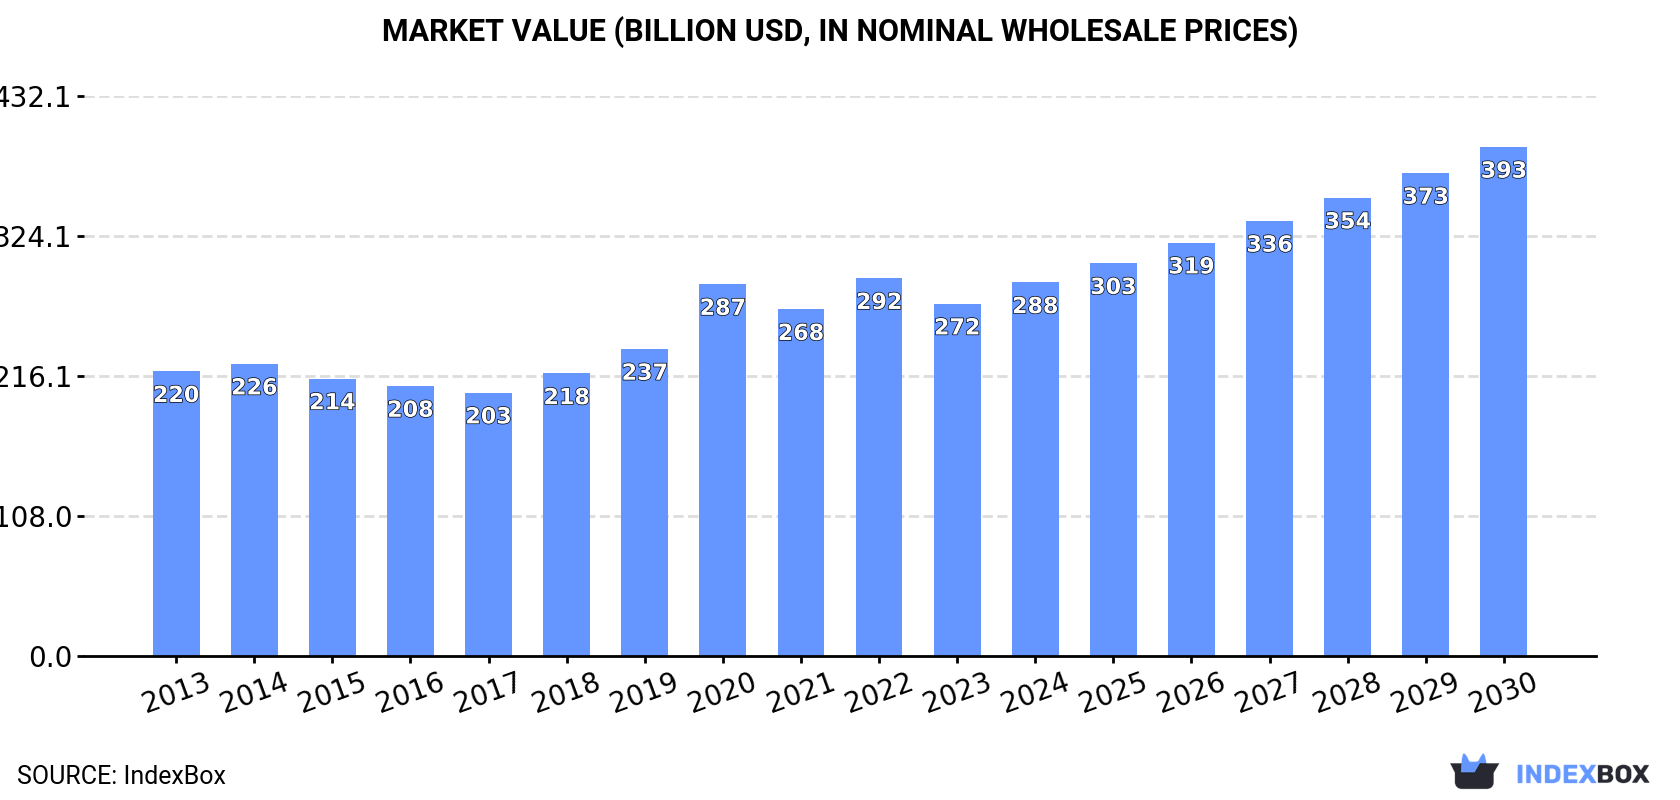
In value terms, the market is forecast to increase with an anticipated CAGR of +5.4% for the period from 2023 to 2030, which is projected to bring the market value to $392.9B (in nominal wholesale prices) by the end of 2030.
Consumption
World Consumption of Cement Clinker
In 2023, approx. 3,917M tons of cement clinker were consumed worldwide; growing by 3.4% on the previous year's figure. In general, consumption recorded a relatively flat trend pattern. Global consumption peaked at 4,044M tons in 2021; however, from 2022 to 2023, consumption failed to regain momentum.
The global cement clinker market value fell to $271.8B in 2023, dropping by -6.7% against the previous year. This figure reflects the total revenues of producers and importers (excluding logistics costs, retail marketing costs, and retailers' margins, which will be included in the final consumer price). The market value increased at an average annual rate of +2.2% over the period from 2013 to 2023; the trend pattern indicated some noticeable fluctuations being recorded in certain years. Over the period under review, the global market reached the peak level at $291.5B in 2022, and then contracted in the following year.
Consumption By Country
The country with the largest volume of cement clinker consumption was China (2,137M tons), comprising approx. 55% of total volume. Moreover, cement clinker consumption in China exceeded the figures recorded by the second-largest consumer, India (343M tons), sixfold. The third position in this ranking was held by the United States (89M tons), with a 2.3% share.
From 2013 to 2023, the average annual growth rate of volume in China was relatively modest. The remaining consuming countries recorded the following average annual rates of consumption growth: India (+2.6% per year) and the United States (+1.9% per year).
In value terms, China ($160.7B) led the market, alone. The second position in the ranking was taken by India ($17.9B). It was followed by Brazil.
From 2013 to 2023, the average annual rate of growth in terms of value in China totaled +2.5%. The remaining consuming countries recorded the following average annual rates of market growth: India (+4.3% per year) and Brazil (-1.9% per year).
The countries with the highest levels of cement clinker per capita consumption in 2023 were China (1,502 kg per person), Turkey (1,001 kg per person) and Iran (677 kg per person).
From 2013 to 2023, the most notable rate of growth in terms of consumption, amongst the leading consuming countries, was attained by Vietnam (with a CAGR of +4.5%), while consumption for the other global leaders experienced more modest paces of growth.
Production
World Production of Cement Clinker
In 2023, the amount of cement clinker produced worldwide rose modestly to 3,909M tons, increasing by 3.4% against the previous year's figure. Over the period under review, production saw a relatively flat trend pattern. Over the period under review, global production attained the peak volume at 4,037M tons in 2021; however, from 2022 to 2023, production remained at a lower figure.
In value terms, cement clinker production reduced to $288.1B in 2023 estimated in export price. In general, the total production indicated a notable expansion from 2013 to 2023: its value increased at an average annual rate of +2.9% over the last decade. The trend pattern, however, indicated some noticeable fluctuations being recorded throughout the analyzed period. Based on 2023 figures, production increased by +49.9% against 2017 indices. The pace of growth appeared the most rapid in 2020 when the production volume increased by 31% against the previous year. Over the period under review, global production attained the maximum level at $323B in 2022, and then shrank in the following year.
Production By Country
The country with the largest volume of cement clinker production was China (2,120M tons), accounting for 54% of total volume. Moreover, cement clinker production in China exceeded the figures recorded by the second-largest producer, India (342M tons), sixfold. Turkey (90M tons) ranked third in terms of total production with a 2.3% share.
In China, cement clinker production remained relatively stable over the period from 2013-2023. In the other countries, the average annual rates were as follows: India (+2.5% per year) and Turkey (+2.6% per year).
Imports
World Imports of Cement Clinker
In 2023, the amount of cement clinker imported worldwide rose sharply to 100M tons, with an increase of 11% compared with the previous year's figure. Over the period under review, total imports indicated resilient growth from 2013 to 2023: its volume increased at an average annual rate of +5.5% over the last decade. The trend pattern, however, indicated some noticeable fluctuations being recorded throughout the analyzed period. Based on 2023 figures, imports decreased by -17.5% against 2021 indices. The most prominent rate of growth was recorded in 2018 when imports increased by 26%. Global imports peaked at 121M tons in 2021; however, from 2022 to 2023, imports failed to regain momentum.
In value terms, cement clinker imports rose remarkably to $5B in 2023. In general, total imports indicated moderate growth from 2013 to 2023: its value increased at an average annual rate of +4.1% over the last decade. The trend pattern, however, indicated some noticeable fluctuations being recorded throughout the analyzed period. Based on 2023 figures, imports decreased by -5.0% against 2021 indices. The most prominent rate of growth was recorded in 2018 with an increase of 28% against the previous year. Global imports peaked at $5.3B in 2021; however, from 2022 to 2023, imports remained at a lower figure.
Imports By Country
In 2023, China (18M tons) and Bangladesh (15M tons) represented the main importers of cement clinkeracross the globe, together amounting to approx. 33% of total imports. Cote d'Ivoire (5M tons) ranks next in terms of the total imports with a 5% share, followed by Ghana (4.7%). The following importers - Australia (4.1M tons), the Philippines (3M tons), Burkina Faso (2.7M tons), Cameroon (2.5M tons), Sri Lanka (2.4M tons), France (2.1M tons), Kuwait (2M tons), Taiwan (Chinese) (1.9M tons) and Oman (1.9M tons) - together made up 23% of total imports.
From 2013 to 2023, the biggest increases were recorded for China (with a CAGR of +53.2%), while purchases for the other global leaders experienced more modest paces of growth.
In value terms, the largest cement clinker importing markets worldwide were China ($720M), Bangladesh ($681M) and Australia ($242M), together accounting for 33% of global imports.
Among the main importing countries, China, with a CAGR of +52.3%, recorded the highest growth rate of the value of imports, over the period under review, while purchases for the other global leaders experienced more modest paces of growth.
Import Prices By Country
In 2023, the average cement clinker import price amounted to $50 per ton, increasing by 2.5% against the previous year. Over the period under review, the import price, however, saw a slight decline. The pace of growth appeared the most rapid in 2022 when the average import price increased by 12%. Over the period under review, average import prices reached the peak figure at $61 per ton in 2014; however, from 2015 to 2023, import prices remained at a lower figure.
Prices varied noticeably by country of destination: amid the top importers, the country with the highest price was France ($86 per ton), while Kuwait ($33 per ton) was amongst the lowest.
From 2013 to 2023, the most notable rate of growth in terms of prices was attained by Australia (+4.0%), while the other global leaders experienced mixed trends in the import price figures.
Exports
World Exports of Cement Clinker
In 2023, the amount of cement clinker exported worldwide rose significantly to 92M tons, with an increase of 10% compared with the year before. In general, total exports indicated temperate growth from 2013 to 2023: its volume increased at an average annual rate of +4.2% over the last decade. The trend pattern, however, indicated some noticeable fluctuations being recorded throughout the analyzed period. Based on 2023 figures, exports decreased by -19.6% against 2021 indices. The pace of growth appeared the most rapid in 2017 with an increase of 21% against the previous year. The global exports peaked at 115M tons in 2021; however, from 2022 to 2023, the exports remained at a lower figure.
In value terms, cement clinker exports rose remarkably to $4.5B in 2023. Over the period under review, total exports indicated noticeable growth from 2013 to 2023: its value increased at an average annual rate of +3.3% over the last decade. The trend pattern, however, indicated some noticeable fluctuations being recorded throughout the analyzed period. Based on 2023 figures, exports decreased by -12.1% against 2021 indices. The pace of growth was the most pronounced in 2018 with an increase of 37%. The global exports peaked at $5.1B in 2021; however, from 2022 to 2023, the exports failed to regain momentum.
Exports By Country
In 2023, Vietnam (21M tons), distantly followed by Egypt (10M tons), the United Arab Emirates (9.8M tons), Indonesia (8.4M tons), Thailand (4.9M tons) and Turkey (4.4M tons) represented the main exporters of cement clinker, together committing 63% of total exports. South Korea (3.7M tons), Morocco (3.6M tons), Iran (3.5M tons), Pakistan (2.8M tons), Japan (2.7M tons), Saudi Arabia (2.5M tons) and Algeria (2.2M tons) held a minor share of total exports.
Exports from Vietnam increased at an average annual rate of +6.8% from 2013 to 2023. At the same time, Pakistan (+96.2%), Egypt (+58.6%), Algeria (+49.8%), Indonesia (+27.6%), Morocco (+14.7%), Saudi Arabia (+11.8%), the United Arab Emirates (+8.3%), Turkey (+7.3%), Thailand (+7.2%) and Iran (+1.1%) displayed positive paces of growth. Moreover, Pakistan emerged as the fastest-growing exporter exported in the world, with a CAGR of +96.2% from 2013-2023. By contrast, Japan (-2.7%) and South Korea (-4.0%) illustrated a downward trend over the same period. While the share of Egypt (+11 p.p.), Indonesia (+7.9 p.p.), Vietnam (+5 p.p.), the United Arab Emirates (+3.4 p.p.), Pakistan (+3 p.p.), Morocco (+2.4 p.p.) and Algeria (+2.3 p.p.) increased significantly in terms of the global exports from 2013-2023, the share of Japan (-2.9 p.p.) and South Korea (-5.1 p.p.) displayed negative dynamics. The shares of the other countries remained relatively stable throughout the analyzed period.
In value terms, Vietnam ($894M), Egypt ($479M) and the United Arab Emirates ($411M) were the countries with the highest levels of exports in 2023, together accounting for 40% of global exports. Indonesia, Turkey, Iran, Thailand, Morocco, Algeria, South Korea, Japan, Saudi Arabia and Pakistan lagged somewhat behind, together comprising a further 39%.
Pakistan, with a CAGR of +90.2%, saw the highest rates of growth with regard to the value of exports, in terms of the main exporting countries over the period under review, while shipments for the other global leaders experienced more modest paces of growth.
Export Prices By Country
In 2023, the average cement clinker export price amounted to $48 per ton, stabilizing at the previous year. Over the period under review, the export price, however, saw a relatively flat trend pattern. The pace of growth appeared the most rapid in 2021 when the average export price increased by 17% against the previous year. The global export price peaked at $53 per ton in 2013; however, from 2014 to 2023, the export prices remained at a lower figure.
There were significant differences in the average prices amongst the major exporting countries. In 2023, amid the top suppliers, the country with the highest price was Algeria ($62 per ton), while Indonesia ($35 per ton) was amongst the lowest.
From 2013 to 2023, the most notable rate of growth in terms of prices was attained by Iran (+3.8%), while the other global leaders experienced more modest paces of growth.
This report provides an in-depth analysis of the global cement clinker market. Within it, you will discover the latest data on market trends and opportunities by country, consumption, production and price developments, as well as the global trade (imports and exports). The forecast exhibits the market prospects through 2030.
Product coverage:
- Prodcom 23511100 - Cement clinker
Country coverage:
Worldwide - the report contains statistical data for 200 countries and includes detailed profiles of the 50 largest consuming countries:
- USA
- China
- Japan
- Germany
- United Kingdom
- France
- Brazil
- Italy
- Russian Federation
- India
- Canada
- Australia
- Republic of Korea
- Spain
- Mexico
- Indonesia
- Netherlands
- Turkey
- Saudi Arabia
- Switzerland
- Sweden
- Nigeria
- Poland
- Belgium
- Argentina
- Norway
- Austria
- Thailand
- United Arab Emirates
- Colombia
- Denmark
- South Africa
- Malaysia
- Israel
- Singapore
- Egypt
- Philippines
- Finland
- Chile
- Ireland
- Pakistan
- Greece
- Portugal
- Kazakhstan
- Algeria
- Czech Republic
- Qatar
- Peru
- Romania
- Vietnam
+ the largest producing countries
Data coverage:
- Global market volume and value
- Per Capita consumption
- Forecast of the market dynamics in the medium term
- Global production, split by region and country
- Global trade (exports and imports)
- Export and import prices
- Market trends, drivers and restraints
- Key market players and their profiles
Company coverage:
Reasons to buy this report:
- Take advantage of the latest data
- Find deeper insights into current market developments
- Discover vital success factors affecting the market
This report is designed for manufacturers, distributors, importers, and wholesalers, as well as for investors, consultants and advisors.
In this report, you can find information that helps you to make informed decisions on the following issues:
- How to diversify your business and benefit from new market opportunities
- How to load your idle production capacity
- How to boost your sales on overseas markets
- How to increase your profit margins
- How to make your supply chain more sustainable
- How to reduce your production and supply chain costs
- How to outsource production to other countries
- How to prepare your business for global expansion
While doing this research, we combine the accumulated expertise of our analysts and the capabilities of artificial intelligence. The AI-based platform, developed by our data scientists, constitutes the key working tool for business analysts, empowering them to discover deep insights and ideas from the marketing data.
-
1. INTRODUCTION
Making Data-Driven Decisions to Grow Your Business
- REPORT DESCRIPTION
- RESEARCH METHODOLOGY AND AI PLATFORM
- DATA-DRIVEN DECISIONS FOR YOUR BUSINESS
- GLOSSARY AND SPECIFIC TERMS
-
2. EXECUTIVE SUMMARY
A Quick Overview of Market Performance
- KEY FINDINGS
- MARKET TRENDS This Chapter is Available Only for the Professional Edition PRO
-
3. MARKET OVERVIEW
Understanding the Current State of The Market and Its Prospects
- MARKET SIZE
- CONSUMPTION BY COUNTRY
- MARKET FORECAST TO 2030
-
4. MOST PROMISING PRODUCT
Finding New Products to Diversify Your Business
This Chapter is Available Only for the Professional Edition PRO- TOP PRODUCTS TO DIVERSIFY YOUR BUSINESS
- BEST-SELLING PRODUCTS
- MOST CONSUMED PRODUCT
- MOST TRADED PRODUCT
- MOST PROFITABLE PRODUCT FOR EXPORT
-
5. MOST PROMISING SUPPLYING COUNTRIES
Choosing the Best Countries to Establish Your Sustainable Supply Chain
This Chapter is Available Only for the Professional Edition PRO- TOP COUNTRIES TO SOURCE YOUR PRODUCT
- TOP PRODUCING COUNTRIES
- TOP EXPORTING COUNTRIES
- LOW-COST EXPORTING COUNTRIES
-
6. MOST PROMISING OVERSEAS MARKETS
Choosing the Best Countries to Boost Your Exports
This Chapter is Available Only for the Professional Edition PRO- TOP OVERSEAS MARKETS FOR EXPORTING YOUR PRODUCT
- TOP CONSUMING MARKETS
- UNSATURATED MARKETS
- TOP IMPORTING MARKETS
- MOST PROFITABLE MARKETS
7. GLOBAL PRODUCTION
The Latest Trends and Insights into The Industry
- PRODUCTION VOLUME AND VALUE
- PRODUCTION BY COUNTRY
8. GLOBAL IMPORTS
The Largest Importers on The Market and How They Succeed
- IMPORTS FROM 2012–2023
- IMPORTS BY COUNTRY
- IMPORT PRICES BY COUNTRY
9. GLOBAL EXPORTS
The Largest Exporters on The Market and How They Succeed
- EXPORTS FROM 2012–2023
- EXPORTS BY COUNTRY
- EXPORT PRICES BY COUNTRY
-
10. PROFILES OF MAJOR PRODUCERS
The Largest Producers on The Market and Their Profiles
This Chapter is Available Only for the Professional Edition PRO -
11. COUNTRY PROFILES
The Largest Markets And Their Profiles
This Chapter is Available Only for the Professional Edition PRO- United States
- China
- Japan
- Germany
- United Kingdom
- France
- Brazil
- Italy
- Russian Federation
- India
- Canada
- Australia
- Republic of Korea
- Spain
- Mexico
- Indonesia
- Netherlands
- Turkey
- Saudi Arabia
- Switzerland
- Sweden
- Nigeria
- Poland
- Belgium
- Argentina
- Norway
- Austria
- Thailand
- United Arab Emirates
- Colombia
- Denmark
- South Africa
- Malaysia
- Israel
- Singapore
- Egypt
- Philippines
- Finland
- Chile
- Ireland
- Pakistan
- Greece
- Portugal
- Kazakhstan
- Algeria
- Czech Republic
- Qatar
- Peru
- Romania
- Vietnam
-
LIST OF TABLES
- Key Findings In 2023
- Market Volume, In Physical Terms, 2012–2023
- Market Value, 2012–2023
- Per Capita Consumption, By Country, 2018–2023
- Production, In Physical Terms, By Country, 2012–2023
- Imports, In Physical Terms, By Country, 2012–2023
- Imports, In Value Terms, By Country, 2012–2023
- Import Prices, By Country Of Destination, 2012–2023
- Exports, In Physical Terms, By Country, 2012–2023
- Exports, In Value Terms, By Country, 2012–2023
- Export Prices, By Country Of Origin, 2012–2023
-
LIST OF FIGURES
- Market Volume, In Physical Terms, 2012–2023
- Market Value, 2012–2023
- Consumption, By Country, 2023
- Market Volume Forecast to 2030
- Market Value Forecast to 2030
- Products: Market Size And Growth, By Type
- Products: Average Per Capita Consumption, By Type
- Products: Exports And Growth, By Type
- Products: Export Prices And Growth, By Type
- Production Volume And Growth
- Exports And Growth
- Export Prices And Growth
- Market Size And Growth
- Per Capita Consumption
- Imports And Growth
- Import Prices
- Production, In Physical Terms, 2012–2023
- Production, In Value Terms, 2012–2023
- Production, By Country, 2023
- Production, In Physical Terms, By Country, 2012–2023
- Imports, In Physical Terms, 2012–2023
- Imports, In Value Terms, 2012–2023
- Imports, In Physical Terms, By Country, 2023
- Imports, In Physical Terms, By Country, 2012–2023
- Imports, In Value Terms, By Country, 2012–2023
- Import Prices, By Country, 2012–2023
- Exports, In Physical Terms, 2012–2023
- Exports, In Value Terms, 2012–2023
- Exports, In Physical Terms, By Country, 2023
- Exports, In Physical Terms, By Country, 2012–2023
- Exports, In Value Terms, By Country, 2012–2023
- Export Prices, 2012–2023


