
World - Chilies And Peppers (Green) - Market Analysis, Forecast, Size, Trends and Insights
Get instant access to more than 2 million reports, dashboards, and datasets on the IndexBox Platform.
View PricingWorldwide Green Chilies and Peppers Market Expected to Reach $63.5B by 2030
IndexBox has just published a new report: World - Chilies And Peppers (Green) - Market Analysis, Forecast, Size, Trends and Insights.
The global market for chilies and peppers (green) is expected to experience steady growth driven by increasing demand worldwide. Projections indicate a CAGR of +2.3% in volume, reaching 41M tons by 2030, and a CAGR of +4.5% in value, with the market value set to rise to $63.5B. These forecasts highlight a promising outlook for the market over the next seven years.
Market Forecast
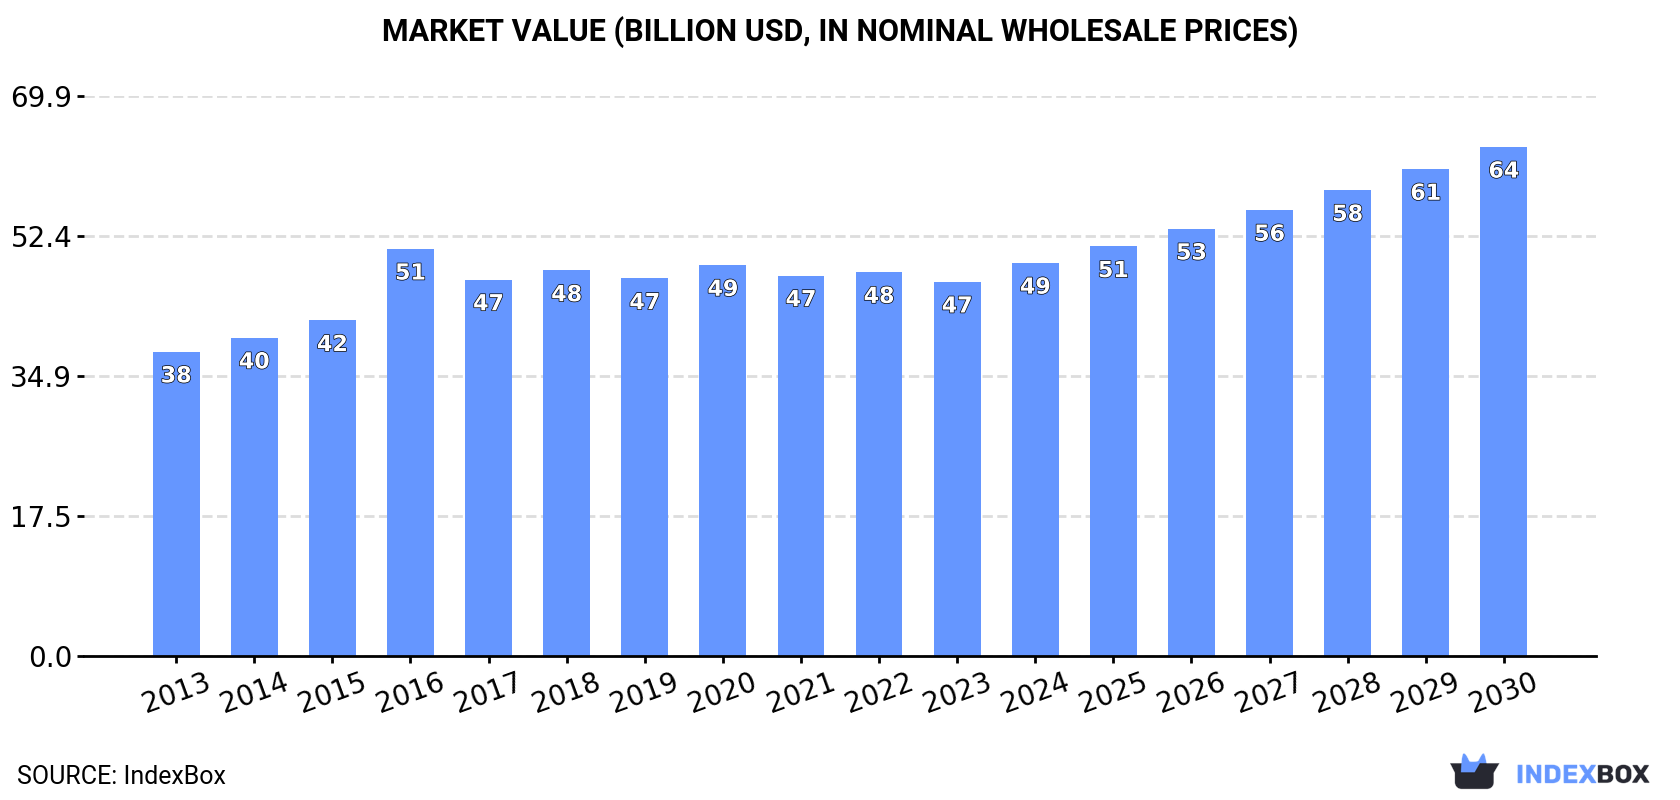
Driven by increasing demand for chilies and peppers (green) worldwide, the market is expected to continue an upward consumption trend over the next seven-year period. Market performance is forecast to accelerate, expanding with an anticipated CAGR of +2.3% for the period from 2023 to 2030, which is projected to bring the market volume to 41M tons by the end of 2030.
In value terms, the market is forecast to increase with an anticipated CAGR of +4.5% for the period from 2023 to 2030, which is projected to bring the market value to $63.5B (in nominal wholesale prices) by the end of 2030.
Consumption
World Consumption of Chilies And Peppers (Green)
In 2023, the amount of chilies and peppers (green) consumed worldwide contracted slightly to 35M tons, waning by -3.8% on the previous year's figure. The total consumption volume increased at an average annual rate of +1.1% over the period from 2013 to 2023; the trend pattern remained relatively stable, with somewhat noticeable fluctuations throughout the analyzed period. The most prominent rate of growth was recorded in 2017 with an increase of 4.6% against the previous year. Global consumption peaked at 37M tons in 2022, and then dropped slightly in the following year.
The global chili and pepper market value shrank modestly to $46.7B in 2023, falling by -2.5% against the previous year. This figure reflects the total revenues of producers and importers (excluding logistics costs, retail marketing costs, and retailers' margins, which will be included in the final consumer price). The market value increased at an average annual rate of +2.1% from 2013 to 2023; the trend pattern remained consistent, with only minor fluctuations being recorded throughout the analyzed period. As a result, consumption attained the peak level of $50.8B. From 2017 to 2023, the growth of the global market failed to regain momentum.
Consumption By Country
The country with the largest volume of chili and pepper consumption was China (17M tons), comprising approx. 47% of total volume. Moreover, chili and pepper consumption in China exceeded the figures recorded by the second-largest consumer, Indonesia (2.9M tons), sixfold. Turkey (2.9M tons) ranked third in terms of total consumption with an 8.1% share.
From 2013 to 2023, the average annual growth rate of volume in China was relatively modest. The remaining consuming countries recorded the following average annual rates of consumption growth: Indonesia (+5.2% per year) and Turkey (+3.2% per year).
In value terms, China ($13.9B) led the market, alone. The second position in the ranking was taken by Indonesia ($4.9B). It was followed by Turkey.
From 2013 to 2023, the average annual rate of growth in terms of value in China amounted to +3.6%. In the other countries, the average annual rates were as follows: Indonesia (+6.7% per year) and Turkey (+1.6% per year).
The countries with the highest levels of chili and pepper per capita consumption in 2023 were Turkey (33 kg per person), Spain (18 kg per person) and Mexico (13 kg per person).
From 2013 to 2023, the most notable rate of growth in terms of consumption, amongst the main consuming countries, was attained by Spain (with a CAGR of +6.9%), while consumption for the other global leaders experienced more modest paces of growth.
Production
World Production of Chilies And Peppers (Green)
In 2023, the amount of chilies and peppers (green) produced worldwide dropped modestly to 37M tons, remaining constant against the previous year. The total output volume increased at an average annual rate of +1.4% over the period from 2013 to 2023; the trend pattern remained consistent, with somewhat noticeable fluctuations being observed throughout the analyzed period. The most prominent rate of growth was recorded in 2017 when the production volume increased by 4.5%. Global production peaked at 37M tons in 2022, and then reduced modestly in the following year. The general positive trend in terms output was largely conditioned by a modest increase of the harvested area and slight growth in yield figures.
In value terms, chili and pepper production dropped slightly to $46.2B in 2023 estimated in export price. In general, production, however, showed a relatively flat trend pattern. The pace of growth was the most pronounced in 2016 when the production volume increased by 44% against the previous year. As a result, production reached the peak level of $58.9B. From 2017 to 2023, global production growth remained at a somewhat lower figure.
Production By Country
China (17M tons) remains the largest chili and pepper producing country worldwide, comprising approx. 46% of total volume. Moreover, chili and pepper production in China exceeded the figures recorded by the second-largest producer, Turkey (3.1M tons), sixfold. Indonesia (2.9M tons) ranked third in terms of total production with a 7.9% share.
In China, chili and pepper production remained relatively stable over the period from 2013-2023. In the other countries, the average annual rates were as follows: Turkey (+3.5% per year) and Indonesia (+5.2% per year).
Yield
The global average chili and pepper yield shrank slightly to 18 tons per ha in 2023, reducing by -4.1% compared with the previous year. The yield figure increased at an average annual rate of +1.1% over the period from 2013 to 2023; the trend pattern remained consistent, with somewhat noticeable fluctuations throughout the analyzed period. The pace of growth appeared the most rapid in 2022 when the yield increased by 8.9%. As a result, the yield reached the peak level of 18 tons per ha, and then declined in the following year.
Harvested Area
In 2023, the total area harvested in terms of chilies and peppers (green) production worldwide expanded modestly to 2.1M ha, growing by 2.9% compared with the year before. In general, the harvested area saw a relatively flat trend pattern. The global harvested area peaked at 2.1M ha in 2021; afterwards, it flattened through to 2023.
Imports
World Imports of Chilies And Peppers (Green)
In 2023, purchases abroad of chilies and peppers (green) decreased by -25.4% to 2.6M tons, falling for the second year in a row after six years of growth. Overall, imports showed a relatively flat trend pattern. The most prominent rate of growth was recorded in 2018 with an increase of 8.2%. Over the period under review, global imports hit record highs at 4M tons in 2021; however, from 2022 to 2023, imports failed to regain momentum.
In value terms, chili and pepper imports dropped to $5.4B in 2023. Over the period under review, imports, however, showed a relatively flat trend pattern. The most prominent rate of growth was recorded in 2016 when imports increased by 9.5%. Global imports peaked at $6.6B in 2021; however, from 2022 to 2023, imports failed to regain momentum.
Imports By Country
In 2023, Germany (380K tons), followed by the UK (231K tons), France (185K tons), Canada (152K tons), the United States (124K tons) and Russia (124K tons) were the largest importers of chilies and peppers (green), together making up 46% of total imports. The Netherlands (103K tons), Spain (85K tons), Malaysia (84K tons), Thailand (82K tons), Italy (81K tons), Poland (73K tons) and Austria (72K tons) held a relatively small share of total imports.
From 2013 to 2023, the biggest increases were recorded for Thailand (with a CAGR of +27.6%), while purchases for the other global leaders experienced more modest paces of growth.
In value terms, the largest chili and pepper importing markets worldwide were Germany ($1.1B), the UK ($590M) and France ($398M), with a combined 38% share of global imports. Canada, the Netherlands, the United States, Poland, Austria, Italy, Russia, Spain, Thailand and Malaysia lagged somewhat behind, together comprising a further 32%.
In terms of the main importing countries, Thailand, with a CAGR of +37.2%, saw the highest growth rate of the value of imports, over the period under review, while purchases for the other global leaders experienced more modest paces of growth.
Import Prices By Country
The average chili and pepper import price stood at $2,065 per ton in 2023, rising by 26% against the previous year. Over the period from 2013 to 2023, it increased at an average annual rate of +1.6%. As a result, import price reached the peak level and is likely to continue growth in the immediate term.
Prices varied noticeably by country of destination: amid the top importers, the country with the highest price was Germany ($2,855 per ton), while Malaysia ($574 per ton) was amongst the lowest.
From 2013 to 2023, the most notable rate of growth in terms of prices was attained by Thailand (+7.5%), while the other global leaders experienced more modest paces of growth.
Exports
World Exports of Chilies And Peppers (Green)
Global chili and pepper exports amounted to 3.9M tons in 2023, leveling off at 2022 figures. The total export volume increased at an average annual rate of +2.9% from 2013 to 2023; however, the trend pattern indicated some noticeable fluctuations being recorded throughout the analyzed period. The pace of growth was the most pronounced in 2021 with an increase of 13% against the previous year. As a result, the exports attained the peak of 4.1M tons. From 2022 to 2023, the growth of the global exports remained at a lower figure.
In value terms, chili and pepper exports skyrocketed to $7.4B in 2023. Overall, total exports indicated a perceptible increase from 2013 to 2023: its value increased at an average annual rate of +4.2% over the last decade. The trend pattern, however, indicated some noticeable fluctuations being recorded throughout the analyzed period. Based on 2023 figures, exports increased by +61.1% against 2015 indices. As a result, the exports attained the peak and are likely to continue growth in the immediate term.
Exports By Country
Mexico (1,115K tons) and Spain (748K tons) represented the main exporters of chilies and peppers (green) in 2023, finishing at approx. 29% and 19% of total exports, respectively. The Netherlands (421K tons) ranks next in terms of the total exports with an 11% share, followed by Turkey (4.8%) and Canada (4.6%). The following exporters - Morocco (170K tons), China (159K tons), the United States (126K tons), India (85K tons), Iran (61K tons) and France (60K tons) - together made up 17% of total exports.
From 2013 to 2023, the biggest increases were recorded for Iran (with a CAGR of +24.3%), while shipments for the other global leaders experienced more modest paces of growth.
In value terms, Spain ($1.8B), Mexico ($1.6B) and the Netherlands ($1.2B) appeared to be the countries with the highest levels of exports in 2023, with a combined 63% share of global exports. Canada, the United States, Turkey, Morocco, China, France, India and Iran lagged somewhat behind, together accounting for a further 23%.
In terms of the main exporting countries, Iran, with a CAGR of +24.4%, recorded the highest rates of growth with regard to the value of exports, over the period under review, while shipments for the other global leaders experienced more modest paces of growth.
Export Prices By Country
The average chili and pepper export price stood at $1,886 per ton in 2023, with an increase of 15% against the previous year. Over the period from 2013 to 2023, it increased at an average annual rate of +1.3%. As a result, the export price attained the peak level and is likely to continue growth in the immediate term.
Prices varied noticeably by country of origin: amid the top suppliers, the country with the highest price was Canada ($2,922 per ton), while Iran ($449 per ton) was amongst the lowest.
From 2013 to 2023, the most notable rate of growth in terms of prices was attained by China (+9.2%), while the other global leaders experienced more modest paces of growth.
This report provides an in-depth analysis of the global chili and pepper market. Within it, you will discover the latest data on market trends and opportunities by country, consumption, production and price developments, as well as the global trade (imports and exports). The forecast exhibits the market prospects through 2030.
Product coverage:
- FCL 401 - Chillies and peppers (green)
Country coverage:
Worldwide - the report contains statistical data for 200 countries and includes detailed profiles of the 50 largest consuming countries:
- USA
- China
- Japan
- Germany
- United Kingdom
- France
- Brazil
- Italy
- Russian Federation
- India
- Canada
- Australia
- Republic of Korea
- Spain
- Mexico
- Indonesia
- Netherlands
- Turkey
- Saudi Arabia
- Switzerland
- Sweden
- Nigeria
- Poland
- Belgium
- Argentina
- Norway
- Austria
- Thailand
- United Arab Emirates
- Colombia
- Denmark
- South Africa
- Malaysia
- Israel
- Singapore
- Egypt
- Philippines
- Finland
- Chile
- Ireland
- Pakistan
- Greece
- Portugal
- Kazakhstan
- Algeria
- Czech Republic
- Qatar
- Peru
- Romania
- Vietnam
+ the largest producing countries
Data coverage:
- Global market volume and value
- Per Capita consumption
- Forecast of the market dynamics in the medium term
- Global production, split by region and country
- Global trade (exports and imports)
- Export and import prices
- Market trends, drivers and restraints
- Key market players and their profiles
Reasons to buy this report:
- Take advantage of the latest data
- Find deeper insights into current market developments
- Discover vital success factors affecting the market
This report is designed for manufacturers, distributors, importers, and wholesalers, as well as for investors, consultants and advisors.
In this report, you can find information that helps you to make informed decisions on the following issues:
- How to diversify your business and benefit from new market opportunities
- How to load your idle production capacity
- How to boost your sales on overseas markets
- How to increase your profit margins
- How to make your supply chain more sustainable
- How to reduce your production and supply chain costs
- How to outsource production to other countries
- How to prepare your business for global expansion
While doing this research, we combine the accumulated expertise of our analysts and the capabilities of artificial intelligence. The AI-based platform, developed by our data scientists, constitutes the key working tool for business analysts, empowering them to discover deep insights and ideas from the marketing data.
-
1. INTRODUCTION
Making Data-Driven Decisions to Grow Your Business
- REPORT DESCRIPTION
- RESEARCH METHODOLOGY AND AI PLATFORM
- DATA-DRIVEN DECISIONS FOR YOUR BUSINESS
- GLOSSARY AND SPECIFIC TERMS
-
2. EXECUTIVE SUMMARY
A Quick Overview of Market Performance
- KEY FINDINGS
- MARKET TRENDS This Chapter is Available Only for the Professional Edition PRO
-
3. MARKET OVERVIEW
Understanding the Current State of The Market and Its Prospects
- MARKET SIZE
- CONSUMPTION BY COUNTRY
- MARKET FORECAST TO 2030
-
4. MOST PROMISING PRODUCT
Finding New Products to Diversify Your Business
This Chapter is Available Only for the Professional Edition PRO- TOP PRODUCTS TO DIVERSIFY YOUR BUSINESS
- BEST-SELLING PRODUCTS
- MOST CONSUMED PRODUCT
- MOST TRADED PRODUCT
- MOST PROFITABLE PRODUCT FOR EXPORT
-
5. MOST PROMISING SUPPLYING COUNTRIES
Choosing the Best Countries to Establish Your Sustainable Supply Chain
This Chapter is Available Only for the Professional Edition PRO- TOP COUNTRIES TO SOURCE YOUR PRODUCT
- TOP PRODUCING COUNTRIES
- COUNTRIES WITH TOP YIELDS
- TOP EXPORTING COUNTRIES
- LOW-COST EXPORTING COUNTRIES
-
6. MOST PROMISING OVERSEAS MARKETS
Choosing the Best Countries to Boost Your Exports
This Chapter is Available Only for the Professional Edition PRO- TOP OVERSEAS MARKETS FOR EXPORTING YOUR PRODUCT
- TOP CONSUMING MARKETS
- UNSATURATED MARKETS
- TOP IMPORTING MARKETS
- MOST PROFITABLE MARKETS
7. GLOBAL PRODUCTION
The Latest Trends and Insights into The Industry
- PRODUCTION VOLUME AND VALUE
- PRODUCTION BY COUNTRY
- HARVESTED AREA AND YIELD BY COUNTRY
8. GLOBAL IMPORTS
The Largest Importers on The Market and How They Succeed
- IMPORTS FROM 2012–2023
- IMPORTS BY COUNTRY
- IMPORT PRICES BY COUNTRY
9. GLOBAL EXPORTS
The Largest Exporters on The Market and How They Succeed
- EXPORTS FROM 2012–2023
- EXPORTS BY COUNTRY
- EXPORT PRICES BY COUNTRY
-
10. PROFILES OF MAJOR PRODUCERS
The Largest Producers on The Market and Their Profiles
This Chapter is Available Only for the Professional Edition PRO -
11. COUNTRY PROFILES
The Largest Markets And Their Profiles
This Chapter is Available Only for the Professional Edition PRO- United States
- China
- Japan
- Germany
- United Kingdom
- France
- Brazil
- Italy
- Russian Federation
- India
- Canada
- Australia
- Republic of Korea
- Spain
- Mexico
- Indonesia
- Netherlands
- Turkey
- Saudi Arabia
- Switzerland
- Sweden
- Nigeria
- Poland
- Belgium
- Argentina
- Norway
- Austria
- Thailand
- United Arab Emirates
- Colombia
- Denmark
- South Africa
- Malaysia
- Israel
- Singapore
- Egypt
- Philippines
- Finland
- Chile
- Ireland
- Pakistan
- Greece
- Portugal
- Kazakhstan
- Algeria
- Czech Republic
- Qatar
- Peru
- Romania
- Vietnam
-
LIST OF TABLES
- Key Findings In 2023
- Market Volume, In Physical Terms, 2012–2023
- Market Value, 2012–2023
- Per Capita Consumption, By Country, 2018–2023
- Production, In Physical Terms, By Country, 2012–2023
- Harvested Area, By Country, 2012-2023
- Yield, By Country, 2012-2023
- Imports, In Physical Terms, By Country, 2012–2023
- Imports, In Value Terms, By Country, 2012–2023
- Import Prices, By Country Of Destination, 2012–2023
- Exports, In Physical Terms, By Country, 2012–2023
- Exports, In Value Terms, By Country, 2012–2023
- Export Prices, By Country Of Origin, 2012–2023
-
LIST OF FIGURES
- Market Volume, In Physical Terms, 2012–2023
- Market Value, 2012–2023
- Consumption, By Country, 2023
- Market Volume Forecast to 2030
- Market Value Forecast to 2030
- Products: Market Size And Growth, By Type
- Products: Average Per Capita Consumption, By Type
- Products: Exports And Growth, By Type
- Products: Export Prices And Growth, By Type
- Production Volume And Growth
- Yield And Growth
- Exports And Growth
- Export Prices And Growth
- Market Size And Growth
- Per Capita Consumption
- Imports And Growth
- Import Prices
- Production, In Physical Terms, 2012–2023
- Production, In Value Terms, 2012–2023
- Area Harvested, 2012–2023
- Yield, 2012–2023
- Production, By Country, 2023
- Production, In Physical Terms, By Country, 2012–2023
- Harvested Area, By Country, 2023
- Harvested Area, By Country, 2012-2023
- Yield, By Country, 2012-2023
- Imports, In Physical Terms, 2012–2023
- Imports, In Value Terms, 2012–2023
- Imports, In Physical Terms, By Country, 2023
- Imports, In Physical Terms, By Country, 2012–2023
- Imports, In Value Terms, By Country, 2012–2023
- Import Prices, By Country, 2012–2023
- Exports, In Physical Terms, 2012–2023
- Exports, In Value Terms, 2012–2023
- Exports, In Physical Terms, By Country, 2023
- Exports, In Physical Terms, By Country, 2012–2023
- Exports, In Value Terms, By Country, 2012–2023
- Export Prices, 2012–2023


