
China - Knives, Scissors And Blades - Market Analysis, Forecast, Size, Trends and Insights
Get instant access to more than 2 million reports, dashboards, and datasets on the IndexBox Platform.
View PricingChina's Knife and Scissors Export Plummets to $185M in June 2023
China Knife And Scissors Exports
After three months of growth, shipments abroad of knives, scissors and blades decreased by -1.3% to 192M units in June 2023. In general, exports showed a slight slump. The most prominent rate of growth was recorded in March 2023 when exports increased by 117% m-o-m. Over the period under review, the exports attained the maximum at 229M units in June 2022; however, from July 2022 to June 2023, the exports failed to regain momentum.
In value terms, knife and scissors exports fell to $185M (IndexBox estimates) in June 2023. Overall, exports recorded a pronounced decrease. The most prominent rate of growth was recorded in March 2023 when exports increased by 127% against the previous month. Over the period under review, the exports reached the maximum at 240M units in June 2022; however, from July 2022 to June 2023, the exports stood at a somewhat lower figure. 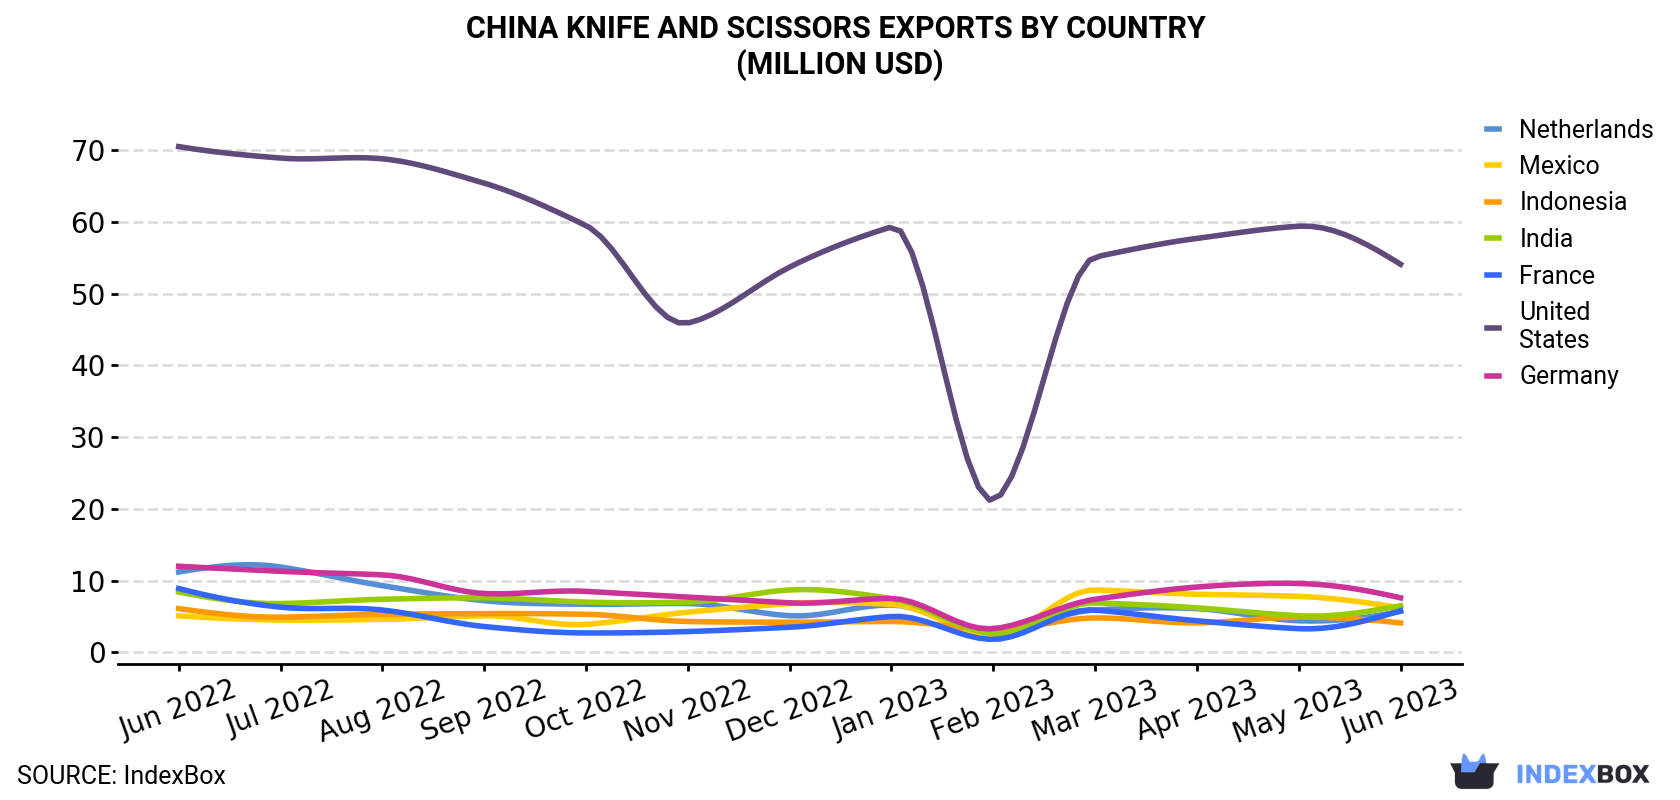
| COUNTRY | Export Value of Knife And Scissors in China (million USD) | ||||||||||||
|---|---|---|---|---|---|---|---|---|---|---|---|---|---|
| Jun 2022 | Jul 2022 | Aug 2022 | Sep 2022 | Oct 2022 | Nov 2022 | Dec 2022 | Jan 2023 | Feb 2023 | Mar 2023 | Apr 2023 | May 2023 | Jun 2023 | |
| United States | 70.5 | 68.9 | 68.8 | 65.4 | 59.5 | 45.9 | 53.7 | 59.3 | 21.2 | 55.1 | 57.7 | 59.4 | 54.1 |
| Germany | 12.0 | 11.3 | 10.8 | 8.2 | 8.5 | 7.7 | 6.9 | 7.5 | 3.3 | 7.4 | 9.1 | 9.6 | 7.6 |
| India | 8.4 | 6.8 | 7.4 | 7.6 | 7.0 | 7.0 | 8.7 | 7.5 | 2.6 | 6.9 | 6.2 | 5.1 | 6.5 |
| Mexico | 5.1 | 4.5 | 4.6 | 5.1 | 3.9 | 5.6 | 6.8 | 6.7 | 2.3 | 8.7 | 8.1 | 7.8 | 6.2 |
| France | 8.9 | 6.3 | 5.9 | 3.6 | 2.7 | 2.9 | 3.5 | 5.0 | 1.8 | 5.9 | 4.4 | 3.3 | 5.8 |
| Netherlands | 11.2 | 11.9 | 9.3 | 7.2 | 6.7 | 6.8 | 5.1 | 6.6 | 3.0 | 5.9 | 6.1 | 4.4 | 5.7 |
| Indonesia | 6.1 | 4.9 | 5.3 | 5.4 | 5.3 | 4.3 | 4.2 | 4.3 | 3.2 | 4.8 | 4.1 | 4.9 | 4.1 |
| Others | 118 | 116 | 108 | 117 | 102 | 114 | 114 | 110 | 54.4 | 114 | 113 | 105 | 95.0 |
| Total | 240 | 231 | 221 | 219 | 195 | 194 | 203 | 207 | 91.8 | 208 | 209 | 200 | 185 |
Exports by Country
The United States (30M units) was the main destination for knife and scissors exports from China, with a 16% share of total exports. Moreover, knife and scissors exports to the United States exceeded the volume sent to the second major destination, India (8.7M units), threefold. The third position in this ranking was taken by Mexico (7.4M units), with a 3.8% share.
From June 2022 to June 2023, the average monthly rate of growth in terms of volume to the United States stood at -4.3%. Exports to the other major destinations recorded the following average monthly rates of exports growth: India (-1.2% per month) and Mexico (+0.6% per month).
In value terms, the United States ($54M) remains the key foreign market for knife and scissors exports from China, comprising 29% of total exports. The second position in the ranking was taken by Germany ($7.6M), with a 4.1% share of total exports. It was followed by India, with a 3.5% share.
From June 2022 to June 2023, the average monthly growth rate of value to the United States totaled -2.2%. Exports to the other major destinations recorded the following average monthly rates of exports growth: Germany (-3.7% per month) and India (-2.2% per month).
Exports by Type
Scissors and tailor shears (73M units), knives having fixed cutting blades (50M units) and clasp knives (28M units) were the main products of knife and scissors exports from China, together accounting for 79% of total exports. These products were followed by table knives, blades; cutting, serrated or not, excluding those of heading no. 8208, knives with cutting blades, serrated or not (including pruning knives) and knives; with handles of base metal, which together accounted for a further 21%.
From June 2022 to June 2023, the biggest increases were in knives; with handles of base metal (with a CAGR of +8.7%), while shipments for the other products experienced mixed trend patterns.
In value terms, scissors and tailor shears ($64M), knives having fixed cutting blades ($43M) and knives with cutting blades, serrated or not (including pruning knives) ($36M) were the most exported types of knives, scissors and blades from China worldwide, together accounting for 78% of total exports. These products were followed by clasp knives, table knives, blades; cutting, serrated or not, excluding those of heading no. 8208 and knives; with handles of base metal, which together accounted for a further 22%.
Knives; with handles of base metal, with a CAGR of +4.5%, recorded the highest growth rate of the value of exports, in terms of the main product categories over the period under review, while shipments for the other products experienced a decline.
Export Prices by Country
In June 2023, the knife and scissors price stood at $963 per thousand units (FOB, China), declining by -6.2% against the previous month. In general, the export price showed a relatively flat trend pattern. The growth pace was the most rapid in August 2022 when the average export price increased by 11% against the previous month. The export price peaked at $1.2 per unit in October 2022; however, from November 2022 to June 2023, the export prices remained at a lower figure.
Prices varied noticeably by the country of destination: the country with the highest price was the United States ($1.8 per unit), while the average price for exports to the United Arab Emirates ($454 per thousand units) was amongst the lowest.
From June 2022 to June 2023, the most notable rate of growth in terms of prices was recorded for supplies to the United States (+2.2%), while the prices for the other major destinations experienced more modest paces of growth.
This report provides an in-depth analysis of the knife and scissors market in China. Within it, you will discover the latest data on market trends and opportunities by country, consumption, production and price developments, as well as the global trade (imports and exports). The forecast exhibits the market prospects through 2030.
Product coverage:
- Prodcom 25711115 -
- Prodcom 25711130 -
- Prodcom 25711145 - Knives with fixed blades of base metal including pruning knives (excluding fish, butter/ table knives with fixed blades, k nives and cutting blades for machines/mechanical appliances)
- Prodcom 25711160 - Clasp knives
- Prodcom 25711175 - Blades and handles of base metal for table knives, pocket knives, including pruning knives (excluding fish and butter knives, knives/cutting blades for machines or mechanical appliances)
- Prodcom 25711190 - Scissors, tailors
Country coverage:
Data coverage:
- Market volume and value
- Per Capita consumption
- Forecast of the market dynamics in the medium term
- Trade (exports and imports) in China
- Export and import prices
- Market trends, drivers and restraints
- Key market players and their profiles
Reasons to buy this report:
- Take advantage of the latest data
- Find deeper insights into current market developments
- Discover vital success factors affecting the market
This report is designed for manufacturers, distributors, importers, and wholesalers, as well as for investors, consultants and advisors.
In this report, you can find information that helps you to make informed decisions on the following issues:
- How to diversify your business and benefit from new market opportunities
- How to load your idle production capacity
- How to boost your sales on overseas markets
- How to increase your profit margins
- How to make your supply chain more sustainable
- How to reduce your production and supply chain costs
- How to outsource production to other countries
- How to prepare your business for global expansion
While doing this research, we combine the accumulated expertise of our analysts and the capabilities of artificial intelligence. The AI-based platform, developed by our data scientists, constitutes the key working tool for business analysts, empowering them to discover deep insights and ideas from the marketing data.
-
1. INTRODUCTION
Making Data-Driven Decisions to Grow Your Business
- REPORT DESCRIPTION
- RESEARCH METHODOLOGY AND AI PLATFORM
- DATA-DRIVEN DECISIONS FOR YOUR BUSINESS
- GLOSSARY AND SPECIFIC TERMS
-
2. EXECUTIVE SUMMARY
A Quick Overview of Market Performance
- KEY FINDINGS
- MARKET TRENDS This Chapter is Available Only for the Professional Edition PRO
-
3. MARKET OVERVIEW
Understanding the Current State of The Market and Its Prospects
- MARKET SIZE
- MARKET STRUCTURE
- TRADE BALANCE
- PER CAPITA CONSUMPTION
- MARKET FORECAST TO 2030
-
4. MOST PROMISING PRODUCT
Finding New Products to Diversify Your Business
This Chapter is Available Only for the Professional Edition PRO- TOP PRODUCTS TO DIVERSIFY YOUR BUSINESS
- BEST-SELLING PRODUCTS
- MOST CONSUMED PRODUCT
- MOST TRADED PRODUCT
- MOST PROFITABLE PRODUCT FOR EXPORT
-
5. MOST PROMISING SUPPLYING COUNTRIES
Choosing the Best Countries to Establish Your Sustainable Supply Chain
This Chapter is Available Only for the Professional Edition PRO- TOP COUNTRIES TO SOURCE YOUR PRODUCT
- TOP PRODUCING COUNTRIES
- TOP EXPORTING COUNTRIES
- LOW-COST EXPORTING COUNTRIES
-
6. MOST PROMISING OVERSEAS MARKETS
Choosing the Best Countries to Boost Your Exports
This Chapter is Available Only for the Professional Edition PRO- TOP OVERSEAS MARKETS FOR EXPORTING YOUR PRODUCT
- TOP CONSUMING MARKETS
- UNSATURATED MARKETS
- TOP IMPORTING MARKETS
- MOST PROFITABLE MARKETS
7. PRODUCTION
The Latest Trends and Insights into The Industry
- PRODUCTION VOLUME AND VALUE
8. IMPORTS
The Largest Import Supplying Countries
- IMPORTS FROM 2012–2023
- IMPORTS BY COUNTRY
- IMPORT PRICES BY COUNTRY
9. EXPORTS
The Largest Destinations for Exports
- EXPORTS FROM 2012–2023
- EXPORTS BY COUNTRY
- EXPORT PRICES BY COUNTRY
-
10. PROFILES OF MAJOR PRODUCERS
The Largest Producers on The Market and Their Profiles
This Chapter is Available Only for the Professional Edition PRO -
LIST OF TABLES
- Key Findings In 2023
- Market Volume, In Physical Terms, 2012–2023
- Market Value, 2012–2023
- Per Capita Consumption In 2012-2023
- Imports, In Physical Terms, By Country, 2012–2023
- Imports, In Value Terms, By Country, 2012–2023
- Import Prices, By Country Of Origin, 2012–2023
- Exports, In Physical Terms, By Country, 2012–2023
- Exports, In Value Terms, By Country, 2012–2023
- Export Prices, By Country Of Destination, 2012–2023
-
LIST OF FIGURES
- Market Volume, In Physical Terms, 2012–2023
- Market Value, 2012–2023
- Market Structure – Domestic Supply vs. Imports, In Physical Terms, 2012-2023
- Market Structure – Domestic Supply vs. Imports, In Value Terms, 2012-2023
- Trade Balance, In Physical Terms, 2012-2023
- Trade Balance, In Value Terms, 2012-2023
- Per Capita Consumption, 2012-2023
- Market Volume Forecast to 2030
- Market Value Forecast to 2030
- Products: Market Size And Growth, By Type
- Products: Average Per Capita Consumption, By Type
- Products: Exports And Growth, By Type
- Products: Export Prices And Growth, By Type
- Production Volume And Growth
- Exports And Growth
- Export Prices And Growth
- Market Size And Growth
- Per Capita Consumption
- Imports And Growth
- Import Prices
- Production, In Physical Terms, 2012–2023
- Production, In Value Terms, 2012–2023
- Imports, In Physical Terms, 2012–2023
- Imports, In Value Terms, 2012–2023
- Imports, In Physical Terms, By Country, 2023
- Imports, In Physical Terms, By Country, 2012–2023
- Imports, In Value Terms, By Country, 2012–2023
- Import Prices, By Country Of Origin, 2012–2023
- Exports, In Physical Terms, 2012–2023
- Exports, In Value Terms, 2012–2023
- Exports, In Physical Terms, By Country, 2023
- Exports, In Physical Terms, By Country, 2012–2023
- Exports, In Value Terms, By Country, 2012–2023
- Export Prices, By Country Of Destination, 2012–2023


