China - Saturated Acyclic Monocarboxylic Acids - Market Analysis, Forecast, Size, Trends and Insights
Get instant access to more than 2 million reports, dashboards, and datasets on the IndexBox Platform.
View PricingChina's Export of Saturated Acyclic Monocarboxylic Acids Drops 13% to $2.9B in 2023
China Saturated Acyclic Monocarboxylic Acids Exports
Saturated acyclic monocarboxylic acids exports from China rose sharply to 3.5M tons in 2023, growing by 15% compared with the year before. Over the period under review, exports continue to indicate a remarkable increase. The most prominent rate of growth was recorded in 2021 when exports increased by 89%. As a result, the exports reached the peak of 3.5M tons; afterwards, it flattened through to 2023.
In value terms, saturated acyclic monocarboxylic acids exports contracted to $2.9B (IndexBox estimates) in 2023. Overall, exports enjoyed a remarkable increase. The most prominent rate of growth was recorded in 2021 when exports increased by 108% against the previous year. The exports peaked at $3.3B in 2022, and then fell in the following year.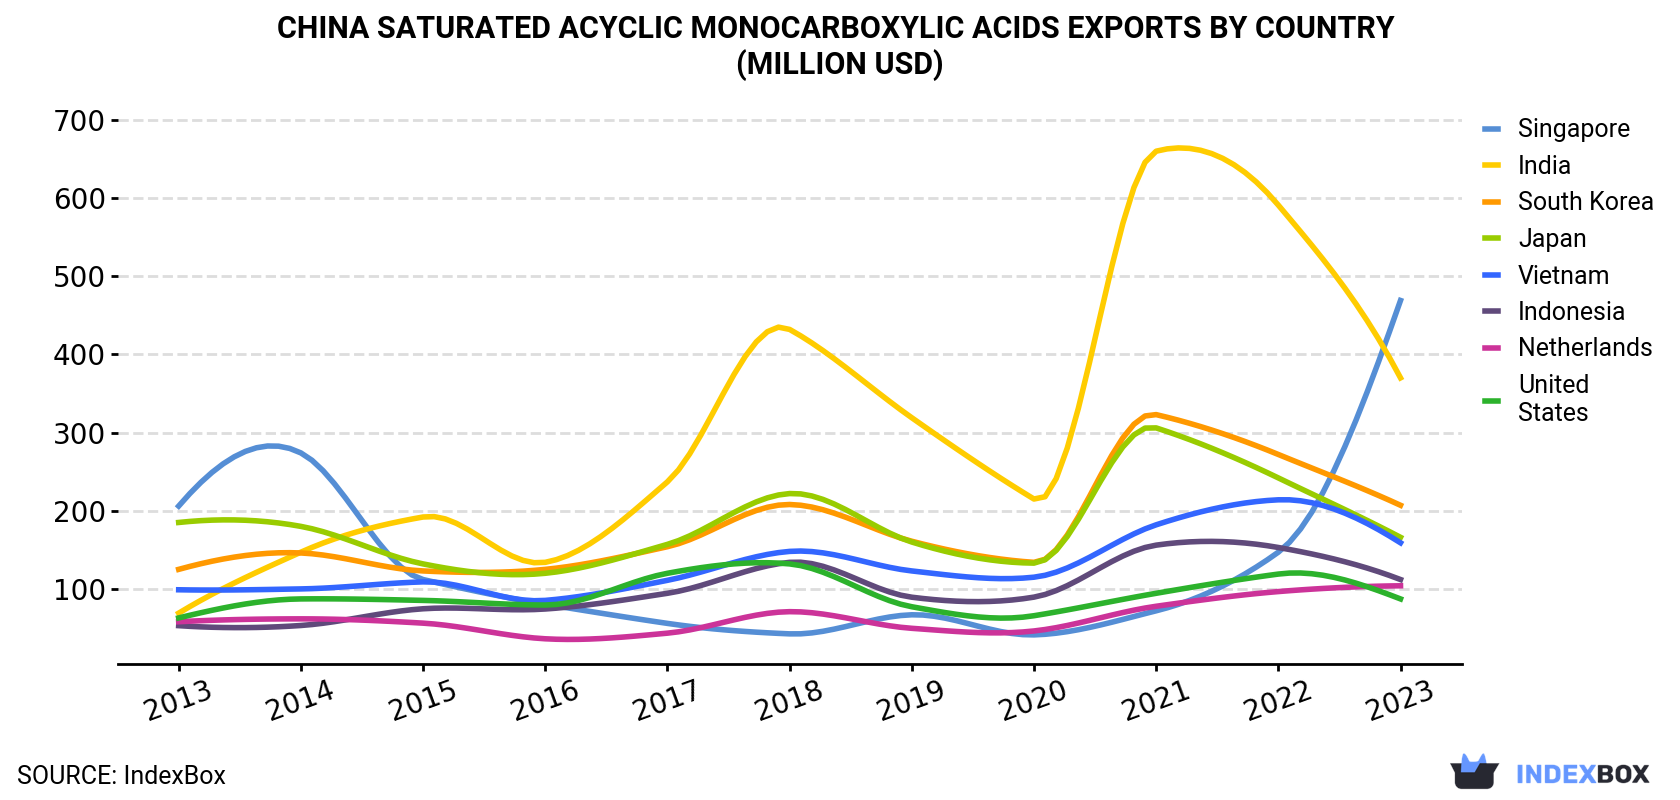
| COUNTRY | Export Value of Saturated Acyclic Monocarboxylic Acids in China (million USD) | ||||||||||
|---|---|---|---|---|---|---|---|---|---|---|---|
| 2013 | 2014 | 2015 | 2016 | 2017 | 2018 | 2019 | 2020 | 2021 | 2022 | 2023 | |
| Singapore | 206 | 274 | 112 | 80.4 | 55.9 | 42.5 | 66.9 | 41.2 | 72.0 | 147 | 469 |
| India | 69.0 | 147 | 192 | 134 | 237 | 432 | 319 | 215 | 660 | 591 | 370 |
| South Korea | 125 | 146 | 123 | 125 | 154 | 208 | 161 | 134 | 323 | 272 | 207 |
| Japan | 185 | 180 | 132 | 120 | 157 | 222 | 160 | 133 | 306 | 242 | 166 |
| Vietnam | 98.9 | 100 | 109 | 85.3 | 111 | 148 | 123 | 115 | 182 | 214 | 159 |
| Indonesia | 53.0 | 53.2 | 74.6 | 74.3 | 94.4 | 134 | 89.4 | 89.5 | 156 | 153 | 112 |
| Netherlands | 58.0 | 61.7 | 56.2 | 36.2 | 43.4 | 70.9 | 49.6 | 46.2 | 77.8 | 96.6 | 104 |
| United States | 62.9 | 87.2 | 85.3 | 79.4 | 120 | 132 | 77.2 | 65.7 | 94.4 | 119 | 87.2 |
| Others | 641 | 836 | 694 | 659 | 760 | 1,148 | 948 | 757 | 1,454 | 1,501 | 1,212 |
| Total | 1,499 | 1,884 | 1,578 | 1,395 | 1,733 | 2,537 | 1,993 | 1,596 | 3,323 | 3,335 | 2,886 |
Exports by Country
Singapore (707K tons), India (623K tons) and South Korea (212K tons) were the main destinations of saturated acyclic monocarboxylic acids exports from China, with a combined 44% share of total exports.
From 2013 to 2023, the most notable rate of growth in terms of shipments, amongst the main countries of destination, was attained by India (with a CAGR of +27.2%), while the other leaders experienced more modest paces of growth.
In value terms, the largest markets for saturated acyclic monocarboxylic acids exported from China were Singapore ($469M), India ($370M) and South Korea ($207M), with a combined 36% share of total exports.
India, with a CAGR of +18.3%, saw the highest rates of growth with regard to the value of exports, among the main countries of destination over the period under review, while shipments for the other leaders experienced more modest paces of growth.
Exports by Type
Esters of acetic acid (excluding ethyl acetate) (1.3M tons), acetic acid (868K tons) and formic acid, its salts and esters (552K tons) were the main products of saturated acyclic monocarboxylic acids exports from China, with a combined 77% share of total exports.
From 2013 to 2023, the biggest increases were recorded for acetic acid (with a CAGR of +16.9%), while shipments for the other products experienced more modest paces of growth.
In value terms, esters of acetic acid (excluding ethyl acetate) ($1.2B) remains the largest type of saturated acyclic monocarboxylic acids exported from China, comprising 42% of total exports. The second position in the ranking was taken by ethyl acetate ($365M), with a 13% share of total exports. It was followed by acetic acid, with a 12% share.
From 2013 to 2023, the average annual rate of growth in terms of the value of esters of acetic acid (excluding ethyl acetate) exports stood at +8.5%. With regard to the other exported products, the following average annual rates of growth were recorded: ethyl acetate (-0.0% per year) and acetic acid (+15.6% per year).
Export Prices by Country
In 2023, the saturated acyclic monocarboxylic acids price stood at $829 per ton (FOB, China), reducing by -24.8% against the previous year. In general, the export price continues to indicate a noticeable downturn. The most prominent rate of growth was recorded in 2018 when the average export price increased by 27%. The export price peaked at $1,102 per ton in 2022, and then dropped significantly in the following year.
There were significant differences in the average prices for the major export markets. In 2023, amid the top suppliers, the country with the highest price was Indonesia ($1,038 per ton), while the average price for exports to India ($595 per ton) was amongst the lowest.
From 2013 to 2023, the most notable rate of growth in terms of prices was recorded for supplies to Russia (+4.2%), while the prices for the other major destinations experienced more modest paces of growth.
This report provides an in-depth analysis of the market for saturated acyclic monocarboxylic acids in China. Within it, you will discover the latest data on market trends and opportunities by country, consumption, production and price developments, as well as the global trade (imports and exports). The forecast exhibits the market prospects through 2030.
Product coverage:
- Prodcom 20143215 - Ethyl acetate
- Prodcom 20143219 - Esters of acetic acid (excluding ethyl acetate)
- Prodcom 20143220 - Mono-, di- or tri-chloroacetic acids, propionic, butanoic and pentanoic acids, their salts and esters
- Prodcom 20143230 -
- Prodcom 20143240 -
- Prodcom 20143250 - Formic acid, its salts and esters
- Prodcom 20143271 - Acetic acid
- Prodcom 20143278 - Salts of acetic acid
- Prodcom 20143280 - Lauric acid and others, salts and esters
Country coverage:
Data coverage:
- Market volume and value
- Per Capita consumption
- Forecast of the market dynamics in the medium term
- Trade (exports and imports) in China
- Export and import prices
- Market trends, drivers and restraints
- Key market players and their profiles
Reasons to buy this report:
- Take advantage of the latest data
- Find deeper insights into current market developments
- Discover vital success factors affecting the market
This report is designed for manufacturers, distributors, importers, and wholesalers, as well as for investors, consultants and advisors.
In this report, you can find information that helps you to make informed decisions on the following issues:
- How to diversify your business and benefit from new market opportunities
- How to load your idle production capacity
- How to boost your sales on overseas markets
- How to increase your profit margins
- How to make your supply chain more sustainable
- How to reduce your production and supply chain costs
- How to outsource production to other countries
- How to prepare your business for global expansion
While doing this research, we combine the accumulated expertise of our analysts and the capabilities of artificial intelligence. The AI-based platform, developed by our data scientists, constitutes the key working tool for business analysts, empowering them to discover deep insights and ideas from the marketing data.
-
1. INTRODUCTION
Making Data-Driven Decisions to Grow Your Business
- REPORT DESCRIPTION
- RESEARCH METHODOLOGY AND AI PLATFORM
- DATA-DRIVEN DECISIONS FOR YOUR BUSINESS
- GLOSSARY AND SPECIFIC TERMS
-
2. EXECUTIVE SUMMARY
A Quick Overview of Market Performance
- KEY FINDINGS
- MARKET TRENDS This Chapter is Available Only for the Professional Edition PRO
-
3. MARKET OVERVIEW
Understanding the Current State of The Market and Its Prospects
- MARKET SIZE
- MARKET STRUCTURE
- TRADE BALANCE
- PER CAPITA CONSUMPTION
- MARKET FORECAST TO 2030
-
4. MOST PROMISING PRODUCT
Finding New Products to Diversify Your Business
This Chapter is Available Only for the Professional Edition PRO- TOP PRODUCTS TO DIVERSIFY YOUR BUSINESS
- BEST-SELLING PRODUCTS
- MOST CONSUMED PRODUCT
- MOST TRADED PRODUCT
- MOST PROFITABLE PRODUCT FOR EXPORT
-
5. MOST PROMISING SUPPLYING COUNTRIES
Choosing the Best Countries to Establish Your Sustainable Supply Chain
This Chapter is Available Only for the Professional Edition PRO- TOP COUNTRIES TO SOURCE YOUR PRODUCT
- TOP PRODUCING COUNTRIES
- TOP EXPORTING COUNTRIES
- LOW-COST EXPORTING COUNTRIES
-
6. MOST PROMISING OVERSEAS MARKETS
Choosing the Best Countries to Boost Your Exports
This Chapter is Available Only for the Professional Edition PRO- TOP OVERSEAS MARKETS FOR EXPORTING YOUR PRODUCT
- TOP CONSUMING MARKETS
- UNSATURATED MARKETS
- TOP IMPORTING MARKETS
- MOST PROFITABLE MARKETS
7. PRODUCTION
The Latest Trends and Insights into The Industry
- PRODUCTION VOLUME AND VALUE
8. IMPORTS
The Largest Import Supplying Countries
- IMPORTS FROM 2012–2023
- IMPORTS BY COUNTRY
- IMPORT PRICES BY COUNTRY
9. EXPORTS
The Largest Destinations for Exports
- EXPORTS FROM 2012–2023
- EXPORTS BY COUNTRY
- EXPORT PRICES BY COUNTRY
-
10. PROFILES OF MAJOR PRODUCERS
The Largest Producers on The Market and Their Profiles
This Chapter is Available Only for the Professional Edition PRO -
LIST OF TABLES
- Key Findings In 2023
- Market Volume, In Physical Terms, 2012–2023
- Market Value, 2012–2023
- Per Capita Consumption In 2012-2023
- Imports, In Physical Terms, By Country, 2012–2023
- Imports, In Value Terms, By Country, 2012–2023
- Import Prices, By Country Of Origin, 2012–2023
- Exports, In Physical Terms, By Country, 2012–2023
- Exports, In Value Terms, By Country, 2012–2023
- Export Prices, By Country Of Destination, 2012–2023
-
LIST OF FIGURES
- Market Volume, In Physical Terms, 2012–2023
- Market Value, 2012–2023
- Market Structure – Domestic Supply vs. Imports, In Physical Terms, 2012-2023
- Market Structure – Domestic Supply vs. Imports, In Value Terms, 2012-2023
- Trade Balance, In Physical Terms, 2012-2023
- Trade Balance, In Value Terms, 2012-2023
- Per Capita Consumption, 2012-2023
- Market Volume Forecast to 2030
- Market Value Forecast to 2030
- Products: Market Size And Growth, By Type
- Products: Average Per Capita Consumption, By Type
- Products: Exports And Growth, By Type
- Products: Export Prices And Growth, By Type
- Production Volume And Growth
- Exports And Growth
- Export Prices And Growth
- Market Size And Growth
- Per Capita Consumption
- Imports And Growth
- Import Prices
- Production, In Physical Terms, 2012–2023
- Production, In Value Terms, 2012–2023
- Imports, In Physical Terms, 2012–2023
- Imports, In Value Terms, 2012–2023
- Imports, In Physical Terms, By Country, 2023
- Imports, In Physical Terms, By Country, 2012–2023
- Imports, In Value Terms, By Country, 2012–2023
- Import Prices, By Country Of Origin, 2012–2023
- Exports, In Physical Terms, 2012–2023
- Exports, In Value Terms, 2012–2023
- Exports, In Physical Terms, By Country, 2023
- Exports, In Physical Terms, By Country, 2012–2023
- Exports, In Value Terms, By Country, 2012–2023
- Export Prices, By Country Of Destination, 2012–2023


