World - Copper Ores And Concentrates - Market Analysis, Forecast, Size, Trends And Insights
Get instant access to more than 2 million reports, dashboards, and datasets on the IndexBox Platform.
View PricingGlobal Copper Ores and Concentrates Market to Reach 254M Tons in Volume and $529.7B in Value by 2030
IndexBox has just published a new report: World - Copper Ores And Concentrates - Market Analysis, Forecast, Size, Trends And Insights.
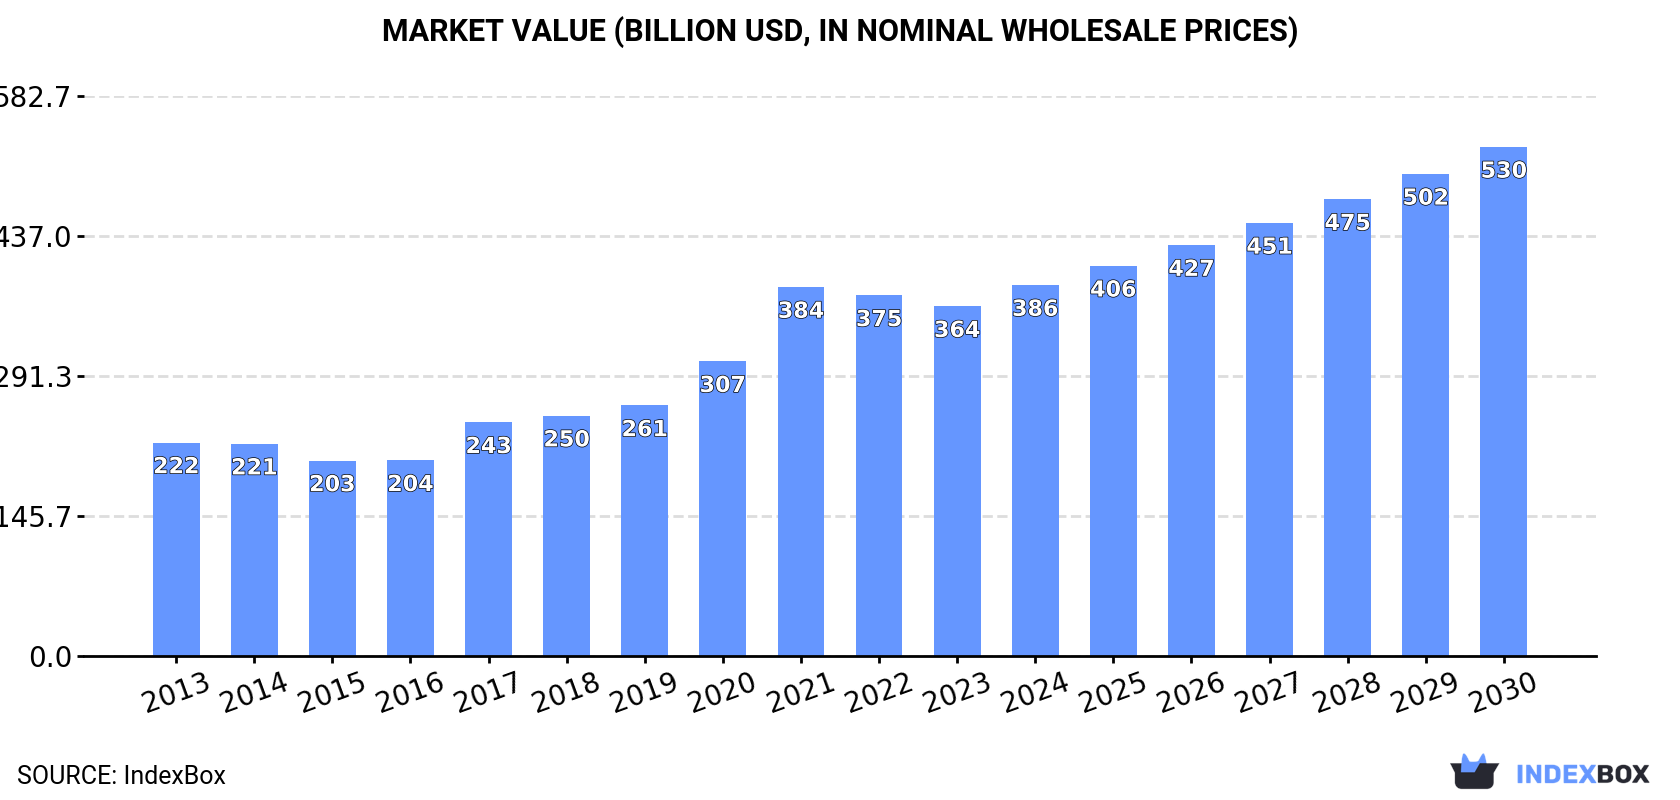
Driven by rising demand worldwide, the market for copper ores and concentrates is forecasted to continue growing with a CAGR of +4.0% in volume and +5.5% in value terms from 2023 to 2030. By the end of 2030, the market volume is expected to reach 254M tons, with a market value of $529.7B in nominal prices.
Market Forecast
Driven by increasing demand for copper ores and concentrates worldwide, the market is expected to continue an upward consumption trend over the next seven-year period. Market performance is forecast to decelerate, expanding with an anticipated CAGR of +4.0% for the period from 2023 to 2030, which is projected to bring the market volume to 254M tons by the end of 2030.
In value terms, the market is forecast to increase with an anticipated CAGR of +5.5% for the period from 2023 to 2030, which is projected to bring the market value to $529.7B (in nominal wholesale prices) by the end of 2030.
Consumption
World Consumption of Copper Ores And Concentrates
In 2023, global consumption of copper ores and concentrates expanded slightly to 193M tons, with an increase of 2.1% compared with the previous year's figure. Overall, the total consumption indicated perceptible growth from 2013 to 2023: its volume increased at an average annual rate of +4.9% over the last decade. The trend pattern, however, indicated some noticeable fluctuations being recorded throughout the analyzed period. Based on 2023 figures, consumption decreased by -0.8% against 2021 indices. The pace of growth appeared the most rapid in 2020 when the consumption volume increased by 8.2%. Over the period under review, global consumption attained the maximum volume at 195M tons in 2021; however, from 2022 to 2023, consumption remained at a lower figure.
The global copper ores and concentrates market value reduced modestly to $363.9B in 2023, which is down by -3% against the previous year. This figure reflects the total revenues of producers and importers (excluding logistics costs, retail marketing costs, and retailers' margins, which will be included in the final consumer price). Over the period under review, the total consumption indicated buoyant growth from 2013 to 2023: its value increased at an average annual rate of +5.1% over the last decade. The trend pattern, however, indicated some noticeable fluctuations being recorded throughout the analyzed period. Based on 2023 figures, consumption decreased by -5.2% against 2021 indices. As a result, consumption attained the peak level of $383.9B. From 2022 to 2023, the growth of the global market remained at a somewhat lower figure.
Consumption By Country
The countries with the highest volumes of consumption in 2023 were Kazakhstan (76M tons), Serbia (51M tons) and China (28M tons), together accounting for 80% of global consumption.
From 2013 to 2023, the most notable rate of growth in terms of consumption, amongst the leading consuming countries, was attained by Serbia (with a CAGR of +11.8%), while consumption for the other global leaders experienced more modest paces of growth.
In value terms, Kazakhstan ($104.4B), Serbia ($65B) and China ($57.6B) were the countries with the highest levels of market value in 2023, together comprising 62% of the global market.
Serbia, with a CAGR of +11.9%, recorded the highest rates of growth with regard to market size in terms of the main consuming countries over the period under review, while market for the other global leaders experienced more modest paces of growth.
The countries with the highest levels of copper ores and concentrates per capita consumption in 2023 were Serbia (7.5 ton per person), Kazakhstan (3.9 ton per person) and North Macedonia (2.5 ton per person).
From 2013 to 2023, the most notable rate of growth in terms of consumption, amongst the leading consuming countries, was attained by Serbia (with a CAGR of +12.4%), while consumption for the other global leaders experienced more modest paces of growth.
Production
World Production of Copper Ores And Concentrates
Global copper ores and concentrates production rose slightly to 183M tons in 2023, with an increase of 2% on 2022. Overall, the total production indicated a prominent expansion from 2013 to 2023: its volume increased at an average annual rate of +5.0% over the last decade. The trend pattern, however, indicated some noticeable fluctuations being recorded throughout the analyzed period. Based on 2023 figures, production decreased by -1.2% against 2021 indices. The pace of growth appeared the most rapid in 2021 with an increase of 8.3% against the previous year. As a result, production attained the peak volume of 185M tons. From 2022 to 2023, global production growth remained at a somewhat lower figure.
In value terms, copper ores and concentrates production contracted modestly to $362B in 2023 estimated in export price. In general, production posted a buoyant increase. The pace of growth appeared the most rapid in 2021 with an increase of 28% against the previous year. As a result, production reached the peak level of $394.6B. From 2022 to 2023, global production growth remained at a lower figure.
Production By Country
The countries with the highest volumes of production in 2023 were Kazakhstan (78M tons), Serbia (52M tons) and Chile (11M tons), with a combined 77% share of global production.
From 2013 to 2023, the most notable rate of growth in terms of production, amongst the leading producing countries, was attained by Serbia (with a CAGR of +12.1%), while production for the other global leaders experienced more modest paces of growth.
Imports
World Imports of Copper Ores And Concentrates
For the eleventh year in a row, the global market recorded growth in supplies from abroad of copper ores and concentrates, which increased by 3.2% to 43M tons in 2023. Overall, total imports indicated a temperate expansion from 2013 to 2023: its volume increased at an average annual rate of +4.7% over the last decade. The trend pattern, however, indicated some noticeable fluctuations being recorded throughout the analyzed period. Based on 2023 figures, imports increased by +59.0% against 2013 indices. The growth pace was the most rapid in 2017 with an increase of 12%. Global imports peaked in 2023 and are likely to continue growth in the immediate term.
In value terms, copper ores and concentrates imports expanded to $100B in 2023. In general, imports showed a prominent expansion. The most prominent rate of growth was recorded in 2021 when imports increased by 48%. Global imports peaked in 2023 and are likely to continue growth in years to come.
Imports By Country
China was the major importer of copper ores and concentrates in the world, with the volume of imports finishing at 28M tons, which was near 64% of total imports in 2023. Japan (4.8M tons) ranks second in terms of the total imports with an 11% share, followed by South Korea (5.2%). The following importers - Germany (1.2M tons), Spain (1.1M tons), India (1M tons) and Bulgaria (0.9M tons) - together made up 10% of total imports.
China was also the fastest-growing in terms of the copper ores and concentrates imports, with a CAGR of +10.6% from 2013 to 2023. At the same time, South Korea (+2.8%) and Germany (+2.0%) displayed positive paces of growth. Japan experienced a relatively flat trend pattern. By contrast, Bulgaria (-1.1%), Spain (-3.0%) and India (-10.4%) illustrated a downward trend over the same period. China (+27 p.p.) significantly strengthened its position in terms of the global imports, while Bulgaria, Spain, Japan and India saw its share reduced by -1.6%, -3.1%, -7.3% and -8.9% from 2013 to 2023, respectively. The shares of the other countries remained relatively stable throughout the analyzed period.
In value terms, China ($60.1B) constitutes the largest market for imported copper ores and concentrates worldwide, comprising 60% of global imports. The second position in the ranking was taken by Japan ($11.7B), with a 12% share of global imports. It was followed by South Korea, with a 6.3% share.
From 2013 to 2023, the average annual growth rate of value in China stood at +11.9%. In the other countries, the average annual rates were as follows: Japan (+1.0% per year) and South Korea (+4.8% per year).
Import Prices By Country
In 2023, the average copper ores and concentrates import price amounted to $2,334 per ton, approximately reflecting the previous year. Overall, import price indicated a slight expansion from 2013 to 2023: its price increased at an average annual rate of +1.0% over the last decade. The trend pattern, however, indicated some noticeable fluctuations being recorded throughout the analyzed period. Based on 2023 figures, copper ores and concentrates import price decreased by -5.7% against 2021 indices. The growth pace was the most rapid in 2021 an increase of 41%. As a result, import price reached the peak level of $2,474 per ton. From 2022 to 2023, the average import prices remained at a somewhat lower figure.
Average prices varied somewhat amongst the major importing countries. In 2023, major importing countries recorded the following prices: in India ($3,092 per ton) and South Korea ($2,826 per ton), while China ($2,183 per ton) and Bulgaria ($2,216 per ton) were amongst the lowest.
From 2013 to 2023, the most notable rate of growth in terms of prices was attained by India (+2.3%), while the other global leaders experienced more modest paces of growth.
Exports
World Exports of Copper Ores And Concentrates
In 2023, overseas shipments of copper ores and concentrates increased by 3.1% to 32M tons, rising for the third year in a row after two years of decline. Over the period under review, total exports indicated strong growth from 2013 to 2023: its volume increased at an average annual rate of +5.2% over the last decade. The trend pattern, however, indicated some noticeable fluctuations being recorded throughout the analyzed period. Based on 2023 figures, exports increased by +26.6% against 2020 indices. The growth pace was the most rapid in 2016 with an increase of 24%. Over the period under review, the global exports hit record highs in 2023 and are expected to retain growth in years to come.
In value terms, copper ores and concentrates exports declined to $88B in 2023. In general, exports posted a resilient increase. The growth pace was the most rapid in 2021 when exports increased by 50% against the previous year. As a result, the exports attained the peak of $92.5B. From 2022 to 2023, the growth of the global exports failed to regain momentum.
Exports By Country
In 2023, Peru (6.6M tons), distantly followed by Chile (3M tons), Mexico (2.7M tons), Indonesia (2.7M tons) and Kazakhstan (2M tons) were the major exporters of copper ores and concentrates, together comprising 53% of total exports. Australia (1.4M tons), Mongolia (1.4M tons), Brazil (1.4M tons), Panama (1.2M tons), Serbia (1.1M tons), Spain (0.6M tons), Russia (0.6M tons) and South Korea (0.6M tons) followed a long way behind the leaders.
Exports from Peru increased at an average annual rate of +5.7% from 2013 to 2023. At the same time, Panama (+101.4%), Serbia (+74.0%), South Korea (+46.3%), Russia (+36.1%), Mexico (+14.8%), Kazakhstan (+14.1%), Mongolia (+9.2%), Indonesia (+6.3%), Brazil (+4.7%) and Chile (+1.8%) displayed positive paces of growth. Moreover, Panama emerged as the fastest-growing exporter exported in the world, with a CAGR of +101.4% from 2013-2023. By contrast, Spain (-1.5%) and Australia (-4.3%) illustrated a downward trend over the same period. While the share of Mexico (+5 p.p.), Panama (+3.6 p.p.), Kazakhstan (+3.5 p.p.), Serbia (+3.3 p.p.), Russia (+1.7 p.p.) and South Korea (+1.7 p.p.) increased significantly in terms of the global exports from 2013-2023, the share of Spain (-1.8 p.p.), Chile (-3.8 p.p.) and Australia (-6.9 p.p.) displayed negative dynamics. The shares of the other countries remained relatively stable throughout the analyzed period.
In value terms, Chile ($24.3B), Peru ($14.3B) and Indonesia ($7.3B) constituted the countries with the highest levels of exports in 2023, together comprising 52% of global exports. Australia, Mexico, Brazil, Kazakhstan, Mongolia, Panama, Serbia, Russia, South Korea and Spain lagged somewhat behind, together accounting for a further 28%.
Panama, with a CAGR of +114.0%, saw the highest growth rate of the value of exports, in terms of the main exporting countries over the period under review, while shipments for the other global leaders experienced more modest paces of growth.
Export Prices By Country
The average copper ores and concentrates export price stood at $2,746 per ton in 2023, reducing by -3% against the previous year. In general, the export price showed a relatively flat trend pattern. The most prominent rate of growth was recorded in 2021 when the average export price increased by 33% against the previous year. As a result, the export price attained the peak level of $3,230 per ton. From 2022 to 2023, the average export prices remained at a lower figure.
Prices varied noticeably by country of origin: amid the top suppliers, the country with the highest price was Chile ($8,019 per ton), while Mexico ($1,361 per ton) was amongst the lowest.
From 2013 to 2023, the most notable rate of growth in terms of prices was attained by South Korea (+9.3%), while the other global leaders experienced more modest paces of growth.
This report provides an in-depth analysis of the global market for copper ores and concentrates. Within it, you will discover the latest data on market trends and opportunities by country, consumption, production and price developments, as well as the global trade (imports and exports). The forecast exhibits the market prospects through 2030.
Product coverage:
- Prodcom 07291100 - Copper ores and concentrates
Country coverage:
Worldwide - the report contains statistical data for 200 countries and includes detailed profiles of the 50 largest consuming countries:
- USA
- China
- Japan
- Germany
- United Kingdom
- France
- Brazil
- Italy
- Russian Federation
- India
- Canada
- Australia
- Republic of Korea
- Spain
- Mexico
- Indonesia
- Netherlands
- Turkey
- Saudi Arabia
- Switzerland
- Sweden
- Nigeria
- Poland
- Belgium
- Argentina
- Norway
- Austria
- Thailand
- United Arab Emirates
- Colombia
- Denmark
- South Africa
- Malaysia
- Israel
- Singapore
- Egypt
- Philippines
- Finland
- Chile
- Ireland
- Pakistan
- Greece
- Portugal
- Kazakhstan
- Algeria
- Czech Republic
- Qatar
- Peru
- Romania
- Vietnam
+ the largest producing countries
Data coverage:
- Global market volume and value
- Per Capita consumption
- Forecast of the market dynamics in the medium term
- Global production, split by region and country
- Global trade (exports and imports)
- Export and import prices
- Market trends, drivers and restraints
- Key market players and their profiles
Reasons to buy this report:
- Take advantage of the latest data
- Find deeper insights into current market developments
- Discover vital success factors affecting the market
This report is designed for manufacturers, distributors, importers, and wholesalers, as well as for investors, consultants and advisors.
In this report, you can find information that helps you to make informed decisions on the following issues:
- How to diversify your business and benefit from new market opportunities
- How to load your idle production capacity
- How to boost your sales on overseas markets
- How to increase your profit margins
- How to make your supply chain more sustainable
- How to reduce your production and supply chain costs
- How to outsource production to other countries
- How to prepare your business for global expansion
While doing this research, we combine the accumulated expertise of our analysts and the capabilities of artificial intelligence. The AI-based platform, developed by our data scientists, constitutes the key working tool for business analysts, empowering them to discover deep insights and ideas from the marketing data.
-
1. INTRODUCTION
Making Data-Driven Decisions to Grow Your Business
- REPORT DESCRIPTION
- RESEARCH METHODOLOGY AND AI PLATFORM
- DATA-DRIVEN DECISIONS FOR YOUR BUSINESS
- GLOSSARY AND SPECIFIC TERMS
-
2. EXECUTIVE SUMMARY
A Quick Overview of Market Performance
- KEY FINDINGS
- MARKET TRENDS This Chapter is Available Only for the Professional Edition PRO
-
3. MARKET OVERVIEW
Understanding the Current State of The Market and Its Prospects
- MARKET SIZE
- CONSUMPTION BY COUNTRY
- MARKET FORECAST TO 2030
-
4. MOST PROMISING PRODUCT
Finding New Products to Diversify Your Business
This Chapter is Available Only for the Professional Edition PRO- TOP PRODUCTS TO DIVERSIFY YOUR BUSINESS
- BEST-SELLING PRODUCTS
- MOST CONSUMED PRODUCT
- MOST TRADED PRODUCT
- MOST PROFITABLE PRODUCT FOR EXPORT
-
5. MOST PROMISING SUPPLYING COUNTRIES
Choosing the Best Countries to Establish Your Sustainable Supply Chain
This Chapter is Available Only for the Professional Edition PRO- TOP COUNTRIES TO SOURCE YOUR PRODUCT
- TOP PRODUCING COUNTRIES
- TOP EXPORTING COUNTRIES
- LOW-COST EXPORTING COUNTRIES
-
6. MOST PROMISING OVERSEAS MARKETS
Choosing the Best Countries to Boost Your Exports
This Chapter is Available Only for the Professional Edition PRO- TOP OVERSEAS MARKETS FOR EXPORTING YOUR PRODUCT
- TOP CONSUMING MARKETS
- UNSATURATED MARKETS
- TOP IMPORTING MARKETS
- MOST PROFITABLE MARKETS
7. GLOBAL PRODUCTION
The Latest Trends and Insights into The Industry
- PRODUCTION VOLUME AND VALUE
- PRODUCTION BY COUNTRY
8. GLOBAL IMPORTS
The Largest Importers on The Market and How They Succeed
- IMPORTS FROM 2012–2023
- IMPORTS BY COUNTRY
- IMPORT PRICES BY COUNTRY
9. GLOBAL EXPORTS
The Largest Exporters on The Market and How They Succeed
- EXPORTS FROM 2012–2023
- EXPORTS BY COUNTRY
- EXPORT PRICES BY COUNTRY
-
10. PROFILES OF MAJOR PRODUCERS
The Largest Producers on The Market and Their Profiles
This Chapter is Available Only for the Professional Edition PRO -
11. COUNTRY PROFILES
The Largest Markets And Their Profiles
This Chapter is Available Only for the Professional Edition PRO- United States
- China
- Japan
- Germany
- United Kingdom
- France
- Brazil
- Italy
- Russian Federation
- India
- Canada
- Australia
- Republic of Korea
- Spain
- Mexico
- Indonesia
- Netherlands
- Turkey
- Saudi Arabia
- Switzerland
- Sweden
- Nigeria
- Poland
- Belgium
- Argentina
- Norway
- Austria
- Thailand
- United Arab Emirates
- Colombia
- Denmark
- South Africa
- Malaysia
- Israel
- Singapore
- Egypt
- Philippines
- Finland
- Chile
- Ireland
- Pakistan
- Greece
- Portugal
- Kazakhstan
- Algeria
- Czech Republic
- Qatar
- Peru
- Romania
- Vietnam
-
LIST OF TABLES
- Key Findings In 2023
- Market Volume, In Physical Terms, 2012–2023
- Market Value, 2012–2023
- Per Capita Consumption, By Country, 2018–2023
- Production, In Physical Terms, By Country, 2012–2023
- Imports, In Physical Terms, By Country, 2012–2023
- Imports, In Value Terms, By Country, 2012–2023
- Import Prices, By Country Of Destination, 2012–2023
- Exports, In Physical Terms, By Country, 2012–2023
- Exports, In Value Terms, By Country, 2012–2023
- Export Prices, By Country Of Origin, 2012–2023
-
LIST OF FIGURES
- Market Volume, In Physical Terms, 2012–2023
- Market Value, 2012–2023
- Consumption, By Country, 2023
- Market Volume Forecast to 2030
- Market Value Forecast to 2030
- Products: Market Size And Growth, By Type
- Products: Average Per Capita Consumption, By Type
- Products: Exports And Growth, By Type
- Products: Export Prices And Growth, By Type
- Production Volume And Growth
- Exports And Growth
- Export Prices And Growth
- Market Size And Growth
- Per Capita Consumption
- Imports And Growth
- Import Prices
- Production, In Physical Terms, 2012–2023
- Production, In Value Terms, 2012–2023
- Production, By Country, 2023
- Production, In Physical Terms, By Country, 2012–2023
- Imports, In Physical Terms, 2012–2023
- Imports, In Value Terms, 2012–2023
- Imports, In Physical Terms, By Country, 2023
- Imports, In Physical Terms, By Country, 2012–2023
- Imports, In Value Terms, By Country, 2012–2023
- Import Prices, By Country, 2012–2023
- Exports, In Physical Terms, 2012–2023
- Exports, In Value Terms, 2012–2023
- Exports, In Physical Terms, By Country, 2023
- Exports, In Physical Terms, By Country, 2012–2023
- Exports, In Value Terms, By Country, 2012–2023
- Export Prices, 2012–2023


