
World - Cartons, Boxes And Cases Of Corrugated Paper Or Paperboard - Market Analysis, Forecast, Size, Trends And Insights
Get instant access to more than 2 million reports, dashboards, and datasets on the IndexBox Platform.
View PricingGlobal Corrugated Paper and Paperboard Market to See Continued Growth with Market Volume Reaching 192M Tons
IndexBox has just published a new report: World - Cartons, Boxes And Cases Of Corrugated Paper Or Paperboard - Market Analysis, Forecast, Size, Trends And Insights.
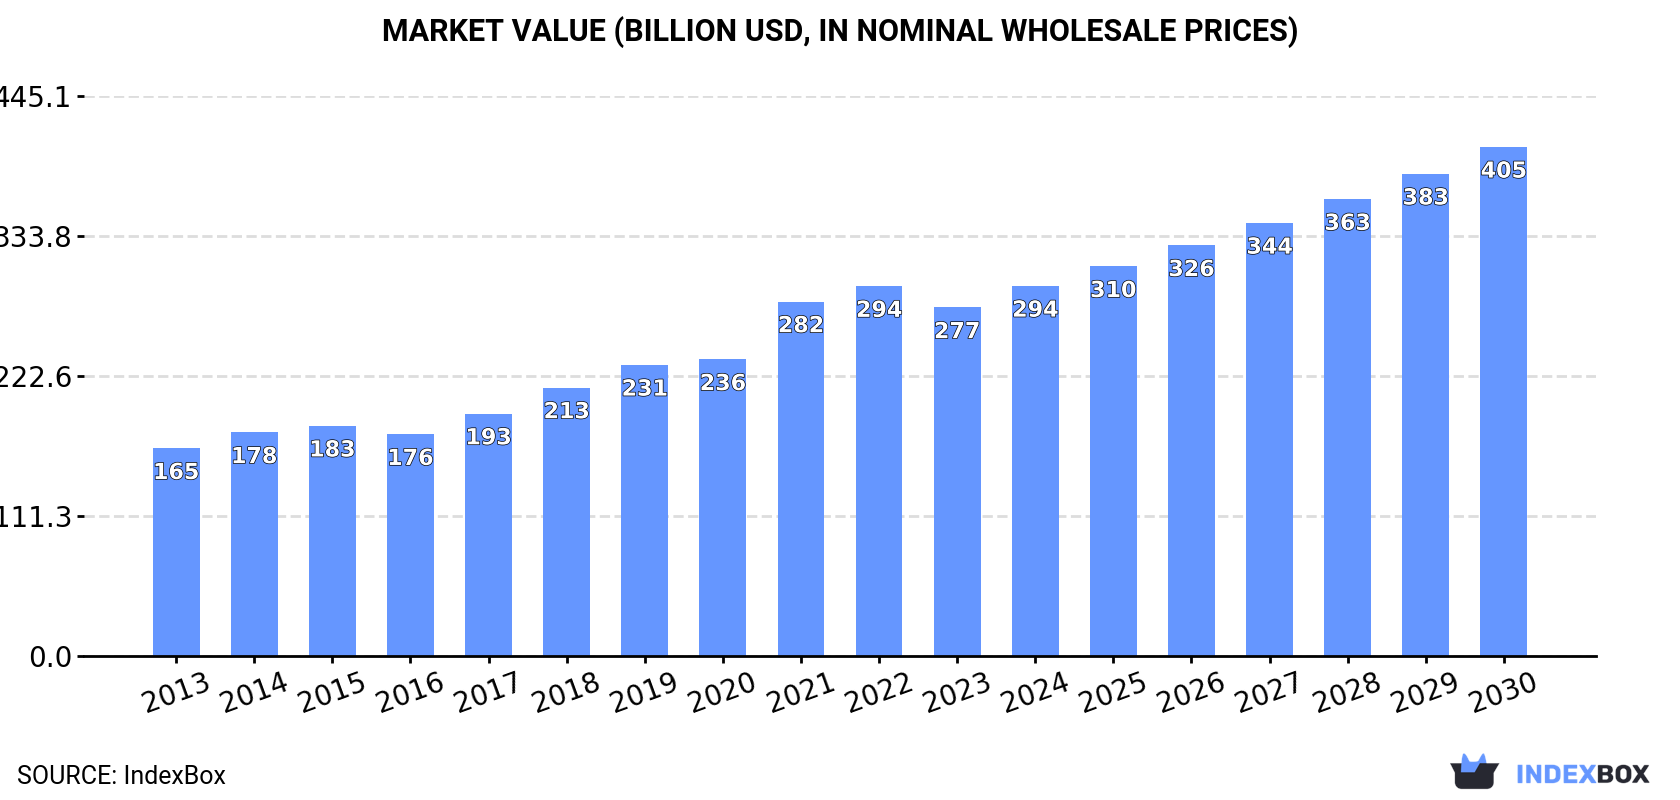
The demand for cartons, boxes, and cases made from corrugated paper or paperboard is on the rise globally, leading to an expected increase in market consumption over the next seven years. With a projected CAGR of +3.3% in volume and +5.6% in value, the market is set to reach 192M tons and $404.6B by 2030.
Market Forecast
Driven by increasing demand for cartons, boxes and cases of corrugated paper or paperboard worldwide, the market is expected to continue an upward consumption trend over the next seven years. Market performance is forecast to decelerate, expanding with an anticipated CAGR of +3.3% for the period from 2023 to 2030, which is projected to bring the market volume to 192M tons by the end of 2030.
In value terms, the market is forecast to increase with an anticipated CAGR of +5.6% for the period from 2023 to 2030, which is projected to bring the market value to $404.6B (in nominal wholesale prices) by the end of 2030.
Consumption
World Consumption of Cartons, Boxes And Cases Of Corrugated Paper Or Paperboard
In 2023, global consumption of cartons, boxes and cases of corrugated paper or paperboard totaled 153M tons, with an increase of 2.1% on the year before. The total consumption volume increased at an average annual rate of +4.4% over the period from 2013 to 2023; however, the trend pattern indicated some noticeable fluctuations being recorded throughout the analyzed period. As a result, consumption reached the peak volume of 155M tons. From 2022 to 2023, the growth of the global consumption remained at a lower figure.
The global corrugated paper box market size dropped to $277B in 2023, shrinking by -5.8% against the previous year. This figure reflects the total revenues of producers and importers (excluding logistics costs, retail marketing costs, and retailers' margins, which will be included in the final consumer price). Over the period under review, the total consumption indicated strong growth from 2013 to 2023: its value increased at an average annual rate of +5.3% over the last decade. The trend pattern, however, indicated some noticeable fluctuations being recorded throughout the analyzed period. Over the period under review, the global market reached the peak level at $294B in 2022, and then reduced in the following year.
Consumption By Country
The country with the largest volume of corrugated paper box consumption was China (37M tons), comprising approx. 24% of total volume. Moreover, corrugated paper box consumption in China exceeded the figures recorded by the second-largest consumer, the United States (16M tons), twofold. India (12M tons) ranked third in terms of total consumption with a 7.8% share.
From 2013 to 2023, the average annual growth rate of volume in China amounted to +4.8%. In the other countries, the average annual rates were as follows: the United States (+7.7% per year) and India (+6.4% per year).
In value terms, China ($85.4B) led the market, alone. The second position in the ranking was held by the United States ($31.5B). It was followed by India.
In China, the corrugated paper box market expanded at an average annual rate of +5.8% over the period from 2013-2023. In the other countries, the average annual rates were as follows: the United States (+8.9% per year) and India (+5.4% per year).
The countries with the highest levels of corrugated paper box per capita consumption in 2023 were Spain (83 kg per person), Italy (81 kg per person) and Germany (60 kg per person).
From 2013 to 2023, the most notable rate of growth in terms of consumption, amongst the leading consuming countries, was attained by Russia (with a CAGR of +8.8%), while consumption for the other global leaders experienced more modest paces of growth.
Production
World Production of Cartons, Boxes And Cases Of Corrugated Paper Or Paperboard
In 2023, the amount of cartons, boxes and cases of corrugated paper or paperboard produced worldwide was estimated at 153M tons, rising by 2% on 2022. The total output volume increased at an average annual rate of +4.4% from 2013 to 2023; however, the trend pattern indicated some noticeable fluctuations being recorded throughout the analyzed period. The pace of growth appeared the most rapid in 2021 when the production volume increased by 13% against the previous year. As a result, production attained the peak volume of 156M tons. From 2022 to 2023, global production growth remained at a somewhat lower figure.
In value terms, corrugated paper box production contracted to $283.2B in 2023 estimated in export price. Over the period under review, the total production indicated resilient growth from 2013 to 2023: its value increased at an average annual rate of +5.4% over the last decade. The trend pattern, however, indicated some noticeable fluctuations being recorded throughout the analyzed period. The pace of growth appeared the most rapid in 2021 with an increase of 20% against the previous year. Over the period under review, global production attained the maximum level at $307.2B in 2022, and then reduced in the following year.
Production By Country
China (37M tons) remains the largest corrugated paper box producing country worldwide, accounting for 24% of total volume. Moreover, corrugated paper box production in China exceeded the figures recorded by the second-largest producer, the United States (16M tons), twofold. The third position in this ranking was held by India (12M tons), with a 7.7% share.
In China, corrugated paper box production expanded at an average annual rate of +4.7% over the period from 2013-2023. The remaining producing countries recorded the following average annual rates of production growth: the United States (+7.3% per year) and India (+6.4% per year).
Imports
World Imports of Cartons, Boxes And Cases Of Corrugated Paper Or Paperboard
In 2023, after two years of growth, there was significant decline in supplies from abroad of cartons, boxes and cases of corrugated paper or paperboard, when their volume decreased by -6.2% to 5.8M tons. The total import volume increased at an average annual rate of +3.4% from 2013 to 2023; however, the trend pattern indicated some noticeable fluctuations being recorded throughout the analyzed period. The growth pace was the most rapid in 2014 when imports increased by 11% against the previous year. Global imports peaked at 6.2M tons in 2022, and then declined in the following year.
In value terms, corrugated paper box imports dropped to $9.9B in 2023. Over the period under review, total imports indicated moderate growth from 2013 to 2023: its value increased at an average annual rate of +4.0% over the last decade. The trend pattern, however, indicated some noticeable fluctuations being recorded throughout the analyzed period. The pace of growth was the most pronounced in 2021 when imports increased by 24% against the previous year. Over the period under review, global imports attained the maximum at $10.6B in 2022, and then dropped in the following year.
Imports By Country
In 2023, the Netherlands (861K tons), distantly followed by Mexico (440K tons), Germany (405K tons), France (351K tons), the United States (287K tons) and Canada (263K tons) were the largest importers of cartons, boxes and cases of corrugated paper or paperboard, together constituting 45% of total imports. Belgium (241K tons), Slovakia (134K tons), Spain (130K tons), Switzerland (128K tons), Denmark (126K tons), the UK (110K tons) and the Czech Republic (108K tons) held a little share of total imports.
From 2013 to 2023, the biggest increases were recorded for Spain (with a CAGR of +16.9%), while purchases for the other global leaders experienced more modest paces of growth.
In value terms, the largest corrugated paper box importing markets worldwide were the Netherlands ($908M), Mexico ($775M) and Germany ($666M), together accounting for 24% of global imports. The United States, France, Canada, Belgium, the UK, Switzerland, Slovakia, the Czech Republic, Denmark and Spain lagged somewhat behind, together accounting for a further 35%.
Slovakia, with a CAGR of +6.8%, saw the highest growth rate of the value of imports, in terms of the main importing countries over the period under review, while purchases for the other global leaders experienced more modest paces of growth.
Import Prices By Country
The average corrugated paper box import price stood at $1,714 per ton in 2023, stabilizing at the previous year. In general, the import price saw a relatively flat trend pattern. The most prominent rate of growth was recorded in 2021 when the average import price increased by 14% against the previous year. Global import price peaked in 2023 and is expected to retain growth in the near future.
There were significant differences in the average prices amongst the major importing countries. In 2023, amid the top importers, the country with the highest price was the UK ($2,785 per ton), while Spain ($777 per ton) was amongst the lowest.
From 2013 to 2023, the most notable rate of growth in terms of prices was attained by the Czech Republic (+3.7%), while the other global leaders experienced more modest paces of growth.
Exports
World Exports of Cartons, Boxes And Cases Of Corrugated Paper Or Paperboard
In 2023, overseas shipments of cartons, boxes and cases of corrugated paper or paperboard decreased by -7% to 6.3M tons, falling for the second year in a row after nine years of growth. The total export volume increased at an average annual rate of +3.0% from 2013 to 2023; however, the trend pattern indicated some noticeable fluctuations being recorded in certain years. The growth pace was the most rapid in 2021 when exports increased by 14%. As a result, the exports reached the peak of 7.1M tons. From 2022 to 2023, the growth of the global exports remained at a somewhat lower figure.
In value terms, corrugated paper box exports contracted to $10.8B in 2023. Over the period under review, total exports indicated a measured increase from 2013 to 2023: its value increased at an average annual rate of +4.0% over the last decade. The trend pattern, however, indicated some noticeable fluctuations being recorded throughout the analyzed period. The most prominent rate of growth was recorded in 2021 when exports increased by 24% against the previous year. Over the period under review, the global exports attained the peak figure at $11.8B in 2022, and then shrank in the following year.
Exports By Country
In 2023, Germany (795K tons), the United States (673K tons), the Netherlands (604K tons), China (531K tons), Poland (383K tons), Italy (276K tons), Mexico (250K tons), Turkey (230K tons), Austria (224K tons), Spain (208K tons), Belgium (204K tons) and Guatemala (154K tons) was the main exporter of cartons, boxes and cases of corrugated paper or paperboard in the world, achieving 72% of total export. The Czech Republic (140K tons) took a relatively small share of total exports.
From 2013 to 2023, the most notable rate of growth in terms of shipments, amongst the leading exporting countries, was attained by the Netherlands (with a CAGR of +16.0%), while the other global leaders experienced more modest paces of growth.
In value terms, the largest corrugated paper box supplying countries worldwide were Germany ($1.4B), China ($1.4B) and the United States ($1.4B), together comprising 38% of global exports. Poland, Italy, Austria, the Netherlands, Spain, Belgium, Turkey, Mexico, the Czech Republic and Guatemala lagged somewhat behind, together comprising a further 34%.
Among the main exporting countries, Turkey, with a CAGR of +11.4%, recorded the highest growth rate of the value of exports, over the period under review, while shipments for the other global leaders experienced more modest paces of growth.
Export Prices By Country
The average corrugated paper box export price stood at $1,713 per ton in 2023, reducing by -2% against the previous year. Over the period from 2013 to 2023, it increased at an average annual rate of +1.0%. The most prominent rate of growth was recorded in 2021 an increase of 9.1%. The global export price peaked at $1,747 per ton in 2022, and then fell in the following year.
Prices varied noticeably by country of origin: amid the top suppliers, the country with the highest price was China ($2,572 per ton), while the Netherlands ($606 per ton) was amongst the lowest.
From 2013 to 2023, the most notable rate of growth in terms of prices was attained by Mexico (+4.0%), while the other global leaders experienced more modest paces of growth.
This report provides an in-depth analysis of the global corrugated paper box market. Within it, you will discover the latest data on market trends and opportunities by country, consumption, production and price developments, as well as the global trade (imports and exports). The forecast exhibits the market prospects through 2030.
Product coverage:
- Prodcom 17211300 - Cartons, boxes and cases, of corrugated paper or paperboard
Country coverage:
Worldwide - the report contains statistical data for 200 countries and includes detailed profiles of the 50 largest consuming countries:
- USA
- China
- Japan
- Germany
- United Kingdom
- France
- Brazil
- Italy
- Russian Federation
- India
- Canada
- Australia
- Republic of Korea
- Spain
- Mexico
- Indonesia
- Netherlands
- Turkey
- Saudi Arabia
- Switzerland
- Sweden
- Nigeria
- Poland
- Belgium
- Argentina
- Norway
- Austria
- Thailand
- United Arab Emirates
- Colombia
- Denmark
- South Africa
- Malaysia
- Israel
- Singapore
- Egypt
- Philippines
- Finland
- Chile
- Ireland
- Pakistan
- Greece
- Portugal
- Kazakhstan
- Algeria
- Czech Republic
- Qatar
- Peru
- Romania
- Vietnam
+ the largest producing countries
Data coverage:
- Global market volume and value
- Per Capita consumption
- Forecast of the market dynamics in the medium term
- Global production, split by region and country
- Global trade (exports and imports)
- Export and import prices
- Market trends, drivers and restraints
- Key market players and their profiles
Reasons to buy this report:
- Take advantage of the latest data
- Find deeper insights into current market developments
- Discover vital success factors affecting the market
This report is designed for manufacturers, distributors, importers, and wholesalers, as well as for investors, consultants and advisors.
In this report, you can find information that helps you to make informed decisions on the following issues:
- How to diversify your business and benefit from new market opportunities
- How to load your idle production capacity
- How to boost your sales on overseas markets
- How to increase your profit margins
- How to make your supply chain more sustainable
- How to reduce your production and supply chain costs
- How to outsource production to other countries
- How to prepare your business for global expansion
While doing this research, we combine the accumulated expertise of our analysts and the capabilities of artificial intelligence. The AI-based platform, developed by our data scientists, constitutes the key working tool for business analysts, empowering them to discover deep insights and ideas from the marketing data.
-
1. INTRODUCTION
Making Data-Driven Decisions to Grow Your Business
- REPORT DESCRIPTION
- RESEARCH METHODOLOGY AND AI PLATFORM
- DATA-DRIVEN DECISIONS FOR YOUR BUSINESS
- GLOSSARY AND SPECIFIC TERMS
-
2. EXECUTIVE SUMMARY
A Quick Overview of Market Performance
- KEY FINDINGS
- MARKET TRENDS This Chapter is Available Only for the Professional Edition PRO
-
3. MARKET OVERVIEW
Understanding the Current State of The Market and Its Prospects
- MARKET SIZE
- CONSUMPTION BY COUNTRY
- MARKET FORECAST TO 2030
-
4. MOST PROMISING PRODUCT
Finding New Products to Diversify Your Business
This Chapter is Available Only for the Professional Edition PRO- TOP PRODUCTS TO DIVERSIFY YOUR BUSINESS
- BEST-SELLING PRODUCTS
- MOST CONSUMED PRODUCT
- MOST TRADED PRODUCT
- MOST PROFITABLE PRODUCT FOR EXPORT
-
5. MOST PROMISING SUPPLYING COUNTRIES
Choosing the Best Countries to Establish Your Sustainable Supply Chain
This Chapter is Available Only for the Professional Edition PRO- TOP COUNTRIES TO SOURCE YOUR PRODUCT
- TOP PRODUCING COUNTRIES
- TOP EXPORTING COUNTRIES
- LOW-COST EXPORTING COUNTRIES
-
6. MOST PROMISING OVERSEAS MARKETS
Choosing the Best Countries to Boost Your Exports
This Chapter is Available Only for the Professional Edition PRO- TOP OVERSEAS MARKETS FOR EXPORTING YOUR PRODUCT
- TOP CONSUMING MARKETS
- UNSATURATED MARKETS
- TOP IMPORTING MARKETS
- MOST PROFITABLE MARKETS
7. GLOBAL PRODUCTION
The Latest Trends and Insights into The Industry
- PRODUCTION VOLUME AND VALUE
- PRODUCTION BY COUNTRY
8. GLOBAL IMPORTS
The Largest Importers on The Market and How They Succeed
- IMPORTS FROM 2012–2023
- IMPORTS BY COUNTRY
- IMPORT PRICES BY COUNTRY
9. GLOBAL EXPORTS
The Largest Exporters on The Market and How They Succeed
- EXPORTS FROM 2012–2023
- EXPORTS BY COUNTRY
- EXPORT PRICES BY COUNTRY
-
10. PROFILES OF MAJOR PRODUCERS
The Largest Producers on The Market and Their Profiles
This Chapter is Available Only for the Professional Edition PRO -
11. COUNTRY PROFILES
The Largest Markets And Their Profiles
This Chapter is Available Only for the Professional Edition PRO- United States
- China
- Japan
- Germany
- United Kingdom
- France
- Brazil
- Italy
- Russian Federation
- India
- Canada
- Australia
- Republic of Korea
- Spain
- Mexico
- Indonesia
- Netherlands
- Turkey
- Saudi Arabia
- Switzerland
- Sweden
- Nigeria
- Poland
- Belgium
- Argentina
- Norway
- Austria
- Thailand
- United Arab Emirates
- Colombia
- Denmark
- South Africa
- Malaysia
- Israel
- Singapore
- Egypt
- Philippines
- Finland
- Chile
- Ireland
- Pakistan
- Greece
- Portugal
- Kazakhstan
- Algeria
- Czech Republic
- Qatar
- Peru
- Romania
- Vietnam
-
LIST OF TABLES
- Key Findings In 2023
- Market Volume, In Physical Terms, 2012–2023
- Market Value, 2012–2023
- Per Capita Consumption, By Country, 2018–2023
- Production, In Physical Terms, By Country, 2012–2023
- Imports, In Physical Terms, By Country, 2012–2023
- Imports, In Value Terms, By Country, 2012–2023
- Import Prices, By Country Of Destination, 2012–2023
- Exports, In Physical Terms, By Country, 2012–2023
- Exports, In Value Terms, By Country, 2012–2023
- Export Prices, By Country Of Origin, 2012–2023
-
LIST OF FIGURES
- Market Volume, In Physical Terms, 2012–2023
- Market Value, 2012–2023
- Consumption, By Country, 2023
- Market Volume Forecast to 2030
- Market Value Forecast to 2030
- Products: Market Size And Growth, By Type
- Products: Average Per Capita Consumption, By Type
- Products: Exports And Growth, By Type
- Products: Export Prices And Growth, By Type
- Production Volume And Growth
- Exports And Growth
- Export Prices And Growth
- Market Size And Growth
- Per Capita Consumption
- Imports And Growth
- Import Prices
- Production, In Physical Terms, 2012–2023
- Production, In Value Terms, 2012–2023
- Production, By Country, 2023
- Production, In Physical Terms, By Country, 2012–2023
- Imports, In Physical Terms, 2012–2023
- Imports, In Value Terms, 2012–2023
- Imports, In Physical Terms, By Country, 2023
- Imports, In Physical Terms, By Country, 2012–2023
- Imports, In Value Terms, By Country, 2012–2023
- Import Prices, By Country, 2012–2023
- Exports, In Physical Terms, 2012–2023
- Exports, In Value Terms, 2012–2023
- Exports, In Physical Terms, By Country, 2023
- Exports, In Physical Terms, By Country, 2012–2023
- Exports, In Value Terms, By Country, 2012–2023
- Export Prices, 2012–2023


