
World - Derricks, Cranes, Mobile Lifting Frames, Straddle Carriers And Work Trucks Fitted With A Crane - Market Analysis, Forecast, Size, Trends and Insights
Get instant access to more than 2 million reports, dashboards, and datasets on the IndexBox Platform.
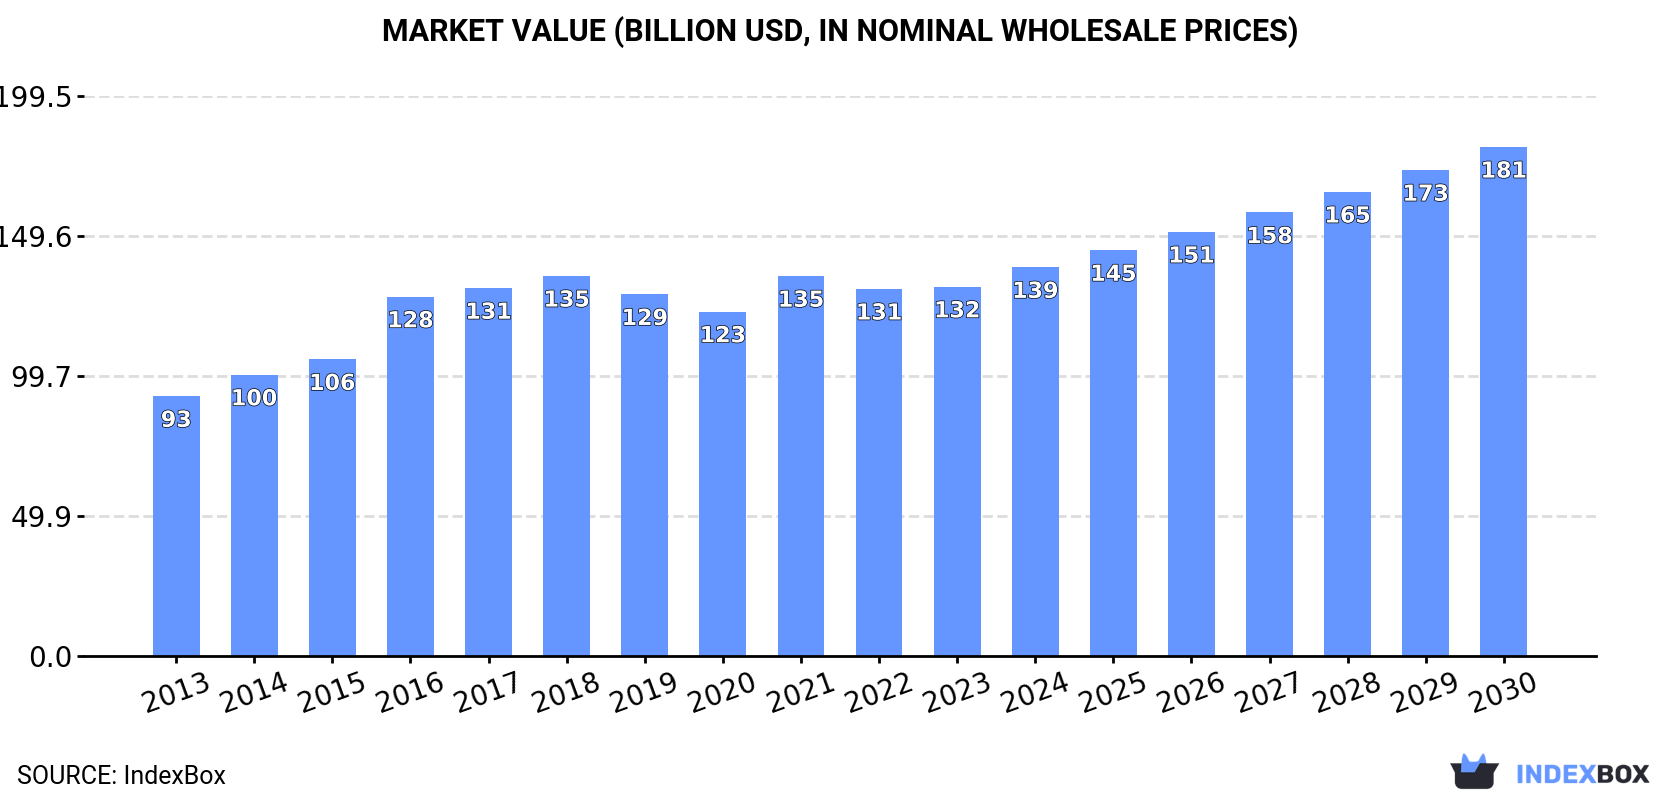
View PricingGlobal Crane Market to Grow at 4.7% CAGR, Reaching $181.4B by 2030
IndexBox has just published a new report: World - Derricks, Cranes, Mobile Lifting Frames, Straddle Carriers And Work Trucks Fitted With A Crane - Market Analysis, Forecast, Size, Trends and Insights.
The market for lifting equipment such as derricks and cranes is set to experience a steady rise over the next seven years, with a forecasted CAGR of +2.8% in volume and +4.7% in value from 2023 to 2030. This growth is driven by increasing demand worldwide for various lifting solutions, indicating promising opportunities for stakeholders in the industry.
Market Forecast
Driven by increasing demand for derricks, cranes, mobile lifting frames, straddle carriers and work trucks fitted with a crane worldwide, the market is expected to continue an upward consumption trend over the next seven-year period. Market performance is forecast to decelerate, expanding with an anticipated CAGR of +2.8% for the period from 2023 to 2030, which is projected to bring the market volume to 2.2M units by the end of 2030.
In value terms, the market is forecast to increase with an anticipated CAGR of +4.7% for the period from 2023 to 2030, which is projected to bring the market value to $181.4B (in nominal wholesale prices) by the end of 2030.
Consumption
World Consumption of Derricks, Cranes, Mobile Lifting Frames, Straddle Carriers And Work Trucks Fitted With A Crane
In 2023, approx. 1.8M units of derricks, cranes, mobile lifting frames, straddle carriers and work trucks fitted with a crane were consumed worldwide; with an increase of 4.1% on the previous year's figure. Overall, the total consumption indicated buoyant growth from 2013 to 2023: its volume increased at an average annual rate of +5.0% over the last decade. The trend pattern, however, indicated some noticeable fluctuations being recorded throughout the analyzed period. Based on 2023 figures, consumption decreased by -6.1% against 2021 indices. Over the period under review, global consumption reached the peak volume at 2M units in 2021; however, from 2022 to 2023, consumption stood at a somewhat lower figure.
The global crane market revenue was estimated at $131.6B in 2023, approximately mirroring the previous year. This figure reflects the total revenues of producers and importers (excluding logistics costs, retail marketing costs, and retailers' margins, which will be included in the final consumer price). The market value increased at an average annual rate of +3.6% from 2013 to 2023; however, the trend pattern indicated some noticeable fluctuations being recorded throughout the analyzed period. Global consumption peaked at $135.4B in 2018; however, from 2019 to 2023, consumption remained at a lower figure.
Consumption By Country
The countries with the highest volumes of consumption in 2023 were China (348K units), the United States (254K units) and Belgium (214K units), with a combined 44% share of global consumption. Italy, Japan, Denmark, Germany, South Korea, Canada, Saudi Arabia and Turkey lagged somewhat behind, together accounting for a further 26%.
From 2013 to 2023, the most notable rate of growth in terms of consumption, amongst the leading consuming countries, was attained by Denmark (with a CAGR of +20.9%), while consumption for the other global leaders experienced more modest paces of growth.
In value terms, the largest crane markets worldwide were the United States ($36.7B), China ($35.3B) and Canada ($6.2B), with a combined 59% share of the global market. South Korea, Turkey, Saudi Arabia, Japan, Italy, Germany, Belgium and Denmark lagged somewhat behind, together comprising a further 8.4%.
In terms of the main consuming countries, Italy, with a CAGR of +16.1%, recorded the highest rates of growth with regard to market size over the period under review, while market for the other global leaders experienced more modest paces of growth.
In 2023, the highest levels of crane per capita consumption was registered in Belgium (18 units per 1000 persons), followed by Denmark (8.5 units per 1000 persons), Italy (3.3 units per 1000 persons) and Saudi Arabia (0.8 units per 1000 persons), while the world average per capita consumption of crane was estimated at 0.2 units per 1000 persons.
In Belgium, crane per capita consumption expanded at an average annual rate of +6.8% over the period from 2013-2023. In the other countries, the average annual rates were as follows: Denmark (+20.4% per year) and Italy (+8.1% per year).
Production
World Production of Derricks, Cranes, Mobile Lifting Frames, Straddle Carriers And Work Trucks Fitted With A Crane
In 2023, the amount of derricks, cranes, mobile lifting frames, straddle carriers and work trucks fitted with a crane produced worldwide expanded slightly to 1.8M units, increasing by 4.8% on the previous year. Over the period under review, the total production indicated a buoyant increase from 2013 to 2023: its volume increased at an average annual rate of +5.0% over the last decade. The trend pattern, however, indicated some noticeable fluctuations being recorded throughout the analyzed period. Based on 2023 figures, production decreased by -5.6% against 2021 indices. The pace of growth was the most pronounced in 2017 with an increase of 20%. Over the period under review, global production attained the maximum volume at 1.9M units in 2021; however, from 2022 to 2023, production remained at a lower figure.
In value terms, crane production rose slightly to $127.7B in 2023 estimated in export price. The total output value increased at an average annual rate of +3.3% over the period from 2013 to 2023; however, the trend pattern indicated some noticeable fluctuations being recorded throughout the analyzed period. The growth pace was the most rapid in 2016 with an increase of 25%. Over the period under review, global production reached the peak level at $133.5B in 2018; however, from 2019 to 2023, production failed to regain momentum.
Production By Country
The countries with the highest volumes of production in 2023 were China (413K units), the United States (239K units) and Belgium (214K units), together comprising 47% of global production. Italy, Japan, Germany, Denmark, South Korea, Saudi Arabia and Canada lagged somewhat behind, together accounting for a further 25%.
From 2013 to 2023, the most notable rate of growth in terms of production, amongst the key producing countries, was attained by Denmark (with a CAGR of +21.0%), while production for the other global leaders experienced more modest paces of growth.
Imports
World Imports of Derricks, Cranes, Mobile Lifting Frames, Straddle Carriers And Work Trucks Fitted With A Crane
In 2023, the amount of derricks, cranes, mobile lifting frames, straddle carriers and work trucks fitted with a crane imported worldwide rose markedly to 159K units, growing by 15% on 2022 figures. The total import volume increased at an average annual rate of +3.5% over the period from 2013 to 2023; however, the trend pattern indicated some noticeable fluctuations being recorded in certain years. The pace of growth appeared the most rapid in 2021 with an increase of 18% against the previous year. Over the period under review, global imports attained the peak figure in 2023 and are expected to retain growth in the near future.
In value terms, crane imports skyrocketed to $16.2B in 2023. Over the period under review, imports saw a relatively flat trend pattern. As a result, imports attained the peak and are likely to continue growth in the immediate term.
Imports By Country
The United States was the main importing country with an import of about 37K units, which recorded 23% of total imports. Qatar (11K units) ranks second in terms of the total imports with a 6.8% share, followed by India (4.5%). The following importers - Turkey (6.8K units), Russia (6.5K units), Indonesia (5.5K units), the Netherlands (4.6K units), Thailand (4.3K units), South Korea (4.2K units), Germany (3.6K units), Singapore (3K units), Belgium (2.9K units) and Australia (2.7K units) - together made up 28% of total imports.
The United States was also the fastest-growing in terms of the derricks, cranes, mobile lifting frames, straddle carriers and work trucks fitted with a crane imports, with a CAGR of +19.8% from 2013 to 2023. At the same time, Qatar (+16.7%), India (+16.1%), Turkey (+9.9%), the Netherlands (+9.6%), Belgium (+8.4%), Thailand (+7.3%) and Russia (+1.6%) displayed positive paces of growth. Indonesia, South Korea, Germany and Australia experienced a relatively flat trend pattern. By contrast, Singapore (-7.8%) illustrated a downward trend over the same period. While the share of the United States (+18 p.p.), Qatar (+4.7 p.p.), India (+3.1 p.p.) and Turkey (+1.9 p.p.) increased significantly in terms of the global imports from 2013-2023, the share of Singapore (-4.1 p.p.) displayed negative dynamics. The shares of the other countries remained relatively stable throughout the analyzed period.
In value terms, the largest crane importing markets worldwide were the United States ($2.1B), India ($1.1B) and the Netherlands ($784M), with a combined 25% share of global imports.
India, with a CAGR of +18.3%, saw the highest rates of growth with regard to the value of imports, in terms of the main importing countries over the period under review, while purchases for the other global leaders experienced more modest paces of growth.
Import Prices By Country
In 2023, the average crane import price amounted to $101,527 per unit, therefore, remained relatively stable against the previous year. Overall, the import price, however, continues to indicate a pronounced reduction. The pace of growth was the most pronounced in 2018 when the average import price increased by 4.1% against the previous year. Global import price peaked at $137,381 per unit in 2013; however, from 2014 to 2023, import prices remained at a lower figure.
Prices varied noticeably by country of destination: amid the top importers, the country with the highest price was Germany ($185,426 per unit), while Qatar ($5,414 per unit) was amongst the lowest.
From 2013 to 2023, the most notable rate of growth in terms of prices was attained by Germany (+4.2%), while the other global leaders experienced more modest paces of growth.
Exports
World Exports of Derricks, Cranes, Mobile Lifting Frames, Straddle Carriers And Work Trucks Fitted With A Crane
In 2023, overseas shipments of derricks, cranes, mobile lifting frames, straddle carriers and work trucks fitted with a crane increased by 26% to 164K units, rising for the third year in a row after three years of decline. The total export volume increased at an average annual rate of +3.8% over the period from 2013 to 2023; however, the trend pattern indicated some noticeable fluctuations being recorded in certain years. As a result, the exports reached the peak and are likely to continue growth in the immediate term.
In value terms, crane exports soared to $17B in 2023. The total export value increased at an average annual rate of +1.0% over the period from 2013 to 2023; however, the trend pattern indicated some noticeable fluctuations being recorded in certain years. As a result, the exports reached the peak and are likely to continue growth in the immediate term.
Exports By Country
In 2023, China (67K units) was the main exporter of derricks, cranes, mobile lifting frames, straddle carriers and work trucks fitted with a crane, creating 41% of total exports. The United States (22K units) took a 13% share (based on physical terms) of total exports, which put it in second place, followed by Germany (6.7%), Japan (6%) and Italy (5.1%). Austria (5.1K units), the Netherlands (4.1K units), Spain (3.1K units), Poland (2.6K units) and France (2.5K units) held a little share of total exports.
From 2013 to 2023, average annual rates of growth with regard to crane exports from China stood at +8.6%. At the same time, the United States (+9.6%), Poland (+6.4%), the Netherlands (+5.0%), Austria (+4.7%) and France (+4.3%) displayed positive paces of growth. Moreover, the United States emerged as the fastest-growing exporter exported in the world, with a CAGR of +9.6% from 2013-2023. Germany and Japan experienced a relatively flat trend pattern. By contrast, Italy (-1.2%) and Spain (-5.7%) illustrated a downward trend over the same period. China (+15 p.p.) and the United States (+5.6 p.p.) significantly strengthened its position in terms of the global exports, while Spain, Italy, Japan and Germany saw its share reduced by -3.1%, -3.3%, -3.5% and -3.7% from 2013 to 2023, respectively. The shares of the other countries remained relatively stable throughout the analyzed period.
In value terms, China ($5.1B) remains the largest crane supplier worldwide, comprising 30% of global exports. The second position in the ranking was taken by Germany ($2B), with a 12% share of global exports. It was followed by Italy, with a 9.2% share.
From 2013 to 2023, the average annual rate of growth in terms of value in China stood at +3.1%. The remaining exporting countries recorded the following average annual rates of exports growth: Germany (-0.3% per year) and Italy (+1.7% per year).
Export Prices By Country
In 2023, the average crane export price amounted to $103,931 per unit, with a decrease of -2.3% against the previous year. In general, the export price continues to indicate a noticeable descent. The pace of growth appeared the most rapid in 2018 an increase of 8.8% against the previous year. The global export price peaked at $136,744 per unit in 2013; however, from 2014 to 2023, the export prices remained at a lower figure.
There were significant differences in the average prices amongst the major exporting countries. In 2023, amid the top suppliers, the country with the highest price was Poland ($245,346 per unit), while the United States ($23,346 per unit) was amongst the lowest.
From 2013 to 2023, the most notable rate of growth in terms of prices was attained by Spain (+4.7%), while the other global leaders experienced more modest paces of growth.
This report provides an in-depth analysis of the global crane market. Within it, you will discover the latest data on market trends and opportunities by country, consumption, production and price developments, as well as the global trade (imports and exports). The forecast exhibits the market prospects through 2030.
Product coverage:
- Prodcom 28221420 - Overhead travelling cranes on fixed support
- Prodcom 28221433 - Mobile lifting frames on tyres and straddle carriers
- Prodcom 28221435 - Transporter cranes, gantry cranes and bridge cranes
- Prodcom 28221440 - Tower cranes and portal or pedestal jib cranes
- Prodcom 28221450 - Self-propelled lifting equipment, of a kind mounted to run on rails in servicing building sites, quarries and the like
- Prodcom 28221460 - Lifting equipment designed for mounting on road vehicles
- Prodcom 28221470 - Lifting equipment (excluding overhead travelling cranes, t ower, transporter, gantry, portal, bridge or pedestal jib cranes, mobile lifting frames or straddle carriers, selfpropelled machinery)
Country coverage:
Worldwide - the report contains statistical data for 200 countries and includes detailed profiles of the 50 largest consuming countries:
- USA
- China
- Japan
- Germany
- United Kingdom
- France
- Brazil
- Italy
- Russian Federation
- India
- Canada
- Australia
- Republic of Korea
- Spain
- Mexico
- Indonesia
- Netherlands
- Turkey
- Saudi Arabia
- Switzerland
- Sweden
- Nigeria
- Poland
- Belgium
- Argentina
- Norway
- Austria
- Thailand
- United Arab Emirates
- Colombia
- Denmark
- South Africa
- Malaysia
- Israel
- Singapore
- Egypt
- Philippines
- Finland
- Chile
- Ireland
- Pakistan
- Greece
- Portugal
- Kazakhstan
- Algeria
- Czech Republic
- Qatar
- Peru
- Romania
- Vietnam
+ the largest producing countries
Data coverage:
- Global market volume and value
- Per Capita consumption
- Forecast of the market dynamics in the medium term
- Global production, split by region and country
- Global trade (exports and imports)
- Export and import prices
- Market trends, drivers and restraints
- Key market players and their profiles
Company coverage:
Reasons to buy this report:
- Take advantage of the latest data
- Find deeper insights into current market developments
- Discover vital success factors affecting the market
This report is designed for manufacturers, distributors, importers, and wholesalers, as well as for investors, consultants and advisors.
In this report, you can find information that helps you to make informed decisions on the following issues:
- How to diversify your business and benefit from new market opportunities
- How to load your idle production capacity
- How to boost your sales on overseas markets
- How to increase your profit margins
- How to make your supply chain more sustainable
- How to reduce your production and supply chain costs
- How to outsource production to other countries
- How to prepare your business for global expansion
While doing this research, we combine the accumulated expertise of our analysts and the capabilities of artificial intelligence. The AI-based platform, developed by our data scientists, constitutes the key working tool for business analysts, empowering them to discover deep insights and ideas from the marketing data.
-
1. INTRODUCTION
Making Data-Driven Decisions to Grow Your Business
- REPORT DESCRIPTION
- RESEARCH METHODOLOGY AND AI PLATFORM
- DATA-DRIVEN DECISIONS FOR YOUR BUSINESS
- GLOSSARY AND SPECIFIC TERMS
-
2. EXECUTIVE SUMMARY
A Quick Overview of Market Performance
- KEY FINDINGS
- MARKET TRENDS This Chapter is Available Only for the Professional Edition PRO
-
3. MARKET OVERVIEW
Understanding the Current State of The Market and Its Prospects
- MARKET SIZE
- CONSUMPTION BY COUNTRY
- MARKET FORECAST TO 2030
-
4. MOST PROMISING PRODUCT
Finding New Products to Diversify Your Business
This Chapter is Available Only for the Professional Edition PRO- TOP PRODUCTS TO DIVERSIFY YOUR BUSINESS
- BEST-SELLING PRODUCTS
- MOST CONSUMED PRODUCT
- MOST TRADED PRODUCT
- MOST PROFITABLE PRODUCT FOR EXPORT
-
5. MOST PROMISING SUPPLYING COUNTRIES
Choosing the Best Countries to Establish Your Sustainable Supply Chain
This Chapter is Available Only for the Professional Edition PRO- TOP COUNTRIES TO SOURCE YOUR PRODUCT
- TOP PRODUCING COUNTRIES
- TOP EXPORTING COUNTRIES
- LOW-COST EXPORTING COUNTRIES
-
6. MOST PROMISING OVERSEAS MARKETS
Choosing the Best Countries to Boost Your Exports
This Chapter is Available Only for the Professional Edition PRO- TOP OVERSEAS MARKETS FOR EXPORTING YOUR PRODUCT
- TOP CONSUMING MARKETS
- UNSATURATED MARKETS
- TOP IMPORTING MARKETS
- MOST PROFITABLE MARKETS
7. GLOBAL PRODUCTION
The Latest Trends and Insights into The Industry
- PRODUCTION VOLUME AND VALUE
- PRODUCTION BY COUNTRY
8. GLOBAL IMPORTS
The Largest Importers on The Market and How They Succeed
- IMPORTS FROM 2012–2023
- IMPORTS BY COUNTRY
- IMPORT PRICES BY COUNTRY
9. GLOBAL EXPORTS
The Largest Exporters on The Market and How They Succeed
- EXPORTS FROM 2012–2023
- EXPORTS BY COUNTRY
- EXPORT PRICES BY COUNTRY
-
10. PROFILES OF MAJOR PRODUCERS
The Largest Producers on The Market and Their Profiles
This Chapter is Available Only for the Professional Edition PRO -
11. COUNTRY PROFILES
The Largest Markets And Their Profiles
This Chapter is Available Only for the Professional Edition PRO- United States
- China
- Japan
- Germany
- United Kingdom
- France
- Brazil
- Italy
- Russian Federation
- India
- Canada
- Australia
- Republic of Korea
- Spain
- Mexico
- Indonesia
- Netherlands
- Turkey
- Saudi Arabia
- Switzerland
- Sweden
- Nigeria
- Poland
- Belgium
- Argentina
- Norway
- Austria
- Thailand
- United Arab Emirates
- Colombia
- Denmark
- South Africa
- Malaysia
- Israel
- Singapore
- Egypt
- Philippines
- Finland
- Chile
- Ireland
- Pakistan
- Greece
- Portugal
- Kazakhstan
- Algeria
- Czech Republic
- Qatar
- Peru
- Romania
- Vietnam
-
LIST OF TABLES
- Key Findings In 2023
- Market Volume, In Physical Terms, 2012–2023
- Market Value, 2012–2023
- Per Capita Consumption, By Country, 2018–2023
- Production, In Physical Terms, By Country, 2012–2023
- Imports, In Physical Terms, By Country, 2012–2023
- Imports, In Value Terms, By Country, 2012–2023
- Import Prices, By Country Of Destination, 2012–2023
- Exports, In Physical Terms, By Country, 2012–2023
- Exports, In Value Terms, By Country, 2012–2023
- Export Prices, By Country Of Origin, 2012–2023
-
LIST OF FIGURES
- Market Volume, In Physical Terms, 2012–2023
- Market Value, 2012–2023
- Consumption, By Country, 2023
- Market Volume Forecast to 2030
- Market Value Forecast to 2030
- Products: Market Size And Growth, By Type
- Products: Average Per Capita Consumption, By Type
- Products: Exports And Growth, By Type
- Products: Export Prices And Growth, By Type
- Production Volume And Growth
- Exports And Growth
- Export Prices And Growth
- Market Size And Growth
- Per Capita Consumption
- Imports And Growth
- Import Prices
- Production, In Physical Terms, 2012–2023
- Production, In Value Terms, 2012–2023
- Production, By Country, 2023
- Production, In Physical Terms, By Country, 2012–2023
- Imports, In Physical Terms, 2012–2023
- Imports, In Value Terms, 2012–2023
- Imports, In Physical Terms, By Country, 2023
- Imports, In Physical Terms, By Country, 2012–2023
- Imports, In Value Terms, By Country, 2012–2023
- Import Prices, By Country, 2012–2023
- Exports, In Physical Terms, 2012–2023
- Exports, In Value Terms, 2012–2023
- Exports, In Physical Terms, By Country, 2023
- Exports, In Physical Terms, By Country, 2012–2023
- Exports, In Value Terms, By Country, 2012–2023
- Export Prices, 2012–2023


