
World - Electricity Supply Or Production Meters - Market Analysis, Forecast, Size, Trends And Insights
Get instant access to more than 2 million reports, dashboards, and datasets on the IndexBox Platform.
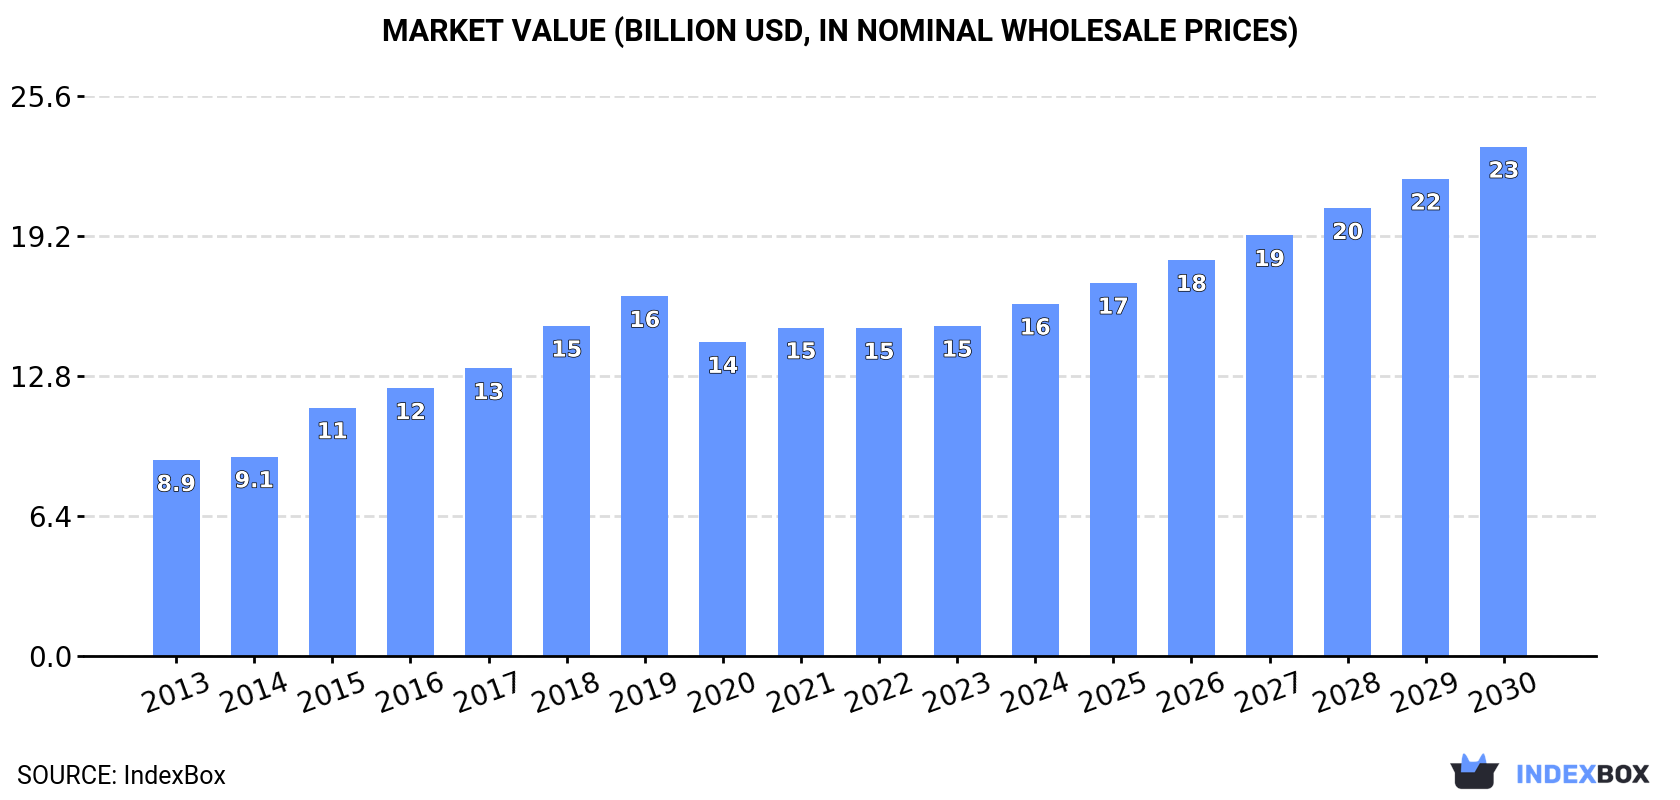
View PricingGlobal Electricity Supply Meters Market Expected to Grow at a CAGR of +4.2% between 2023-2030, Reaching $23.3B
IndexBox has just published a new report: World - Electricity Supply Or Production Meters - Market Analysis, Forecast, Size, Trends And Insights.
Driven by global demand, the electricity supply meter market is expected to see steady growth in both volume and value over the next seven years. With a projected increase in market volume to 409M units and market value to $23.3B by 2030, the industry is set for continued expansion.
Market Forecast
Driven by increasing demand for electricity supply or production meters worldwide, the market is expected to continue an upward consumption trend over the next seven years. Market performance is forecast to decelerate, expanding with an anticipated CAGR of +4.2% for the period from 2023 to 2030, which is projected to bring the market volume to 409M units by the end of 2030.
In value terms, the market is forecast to increase with an anticipated CAGR of +6.4% for the period from 2023 to 2030, which is projected to bring the market value to $23.3B (in nominal wholesale prices) by the end of 2030.
Consumption
World Consumption of Electricity Supply Or Production Meters
In 2023, after two years of growth, there was decline in consumption of electricity supply or production meters, when its volume decreased by -1.5% to 306M units. Overall, the total consumption indicated strong growth from 2013 to 2023: its volume increased at an average annual rate of +5.3% over the last decade. The trend pattern, however, indicated some noticeable fluctuations being recorded throughout the analyzed period. Global consumption peaked at 311M units in 2022, and then dropped in the following year.
The global electricity supply meter market revenue stood at $15.1B in 2023, remaining stable against the previous year. This figure reflects the total revenues of producers and importers (excluding logistics costs, retail marketing costs, and retailers' margins, which will be included in the final consumer price). In general, the total consumption indicated a remarkable increase from 2013 to 2023: its value increased at an average annual rate of +5.4% over the last decade. The trend pattern, however, indicated some noticeable fluctuations being recorded throughout the analyzed period. Based on 2023 figures, consumption increased by +5.2% against 2020 indices. Global consumption peaked at $16.4B in 2019; however, from 2020 to 2023, consumption failed to regain momentum.
Consumption By Country
The countries with the highest volumes of consumption in 2023 were China (44M units), the United States (29M units) and India (26M units), together comprising 32% of global consumption. Italy, Russia, Japan, Indonesia, Brazil, Germany, Canada, Thailand, South Korea and the Netherlands lagged somewhat behind, together accounting for a further 34%.
From 2013 to 2023, the most notable rate of growth in terms of consumption, amongst the key consuming countries, was attained by Italy (with a CAGR of +34.2%), while consumption for the other global leaders experienced more modest paces of growth.
In value terms, the United States ($3.1B) led the market, alone. The second position in the ranking was taken by India ($1.2B). It was followed by China.
From 2013 to 2023, the average annual rate of growth in terms of value in the United States stood at +9.7%. The remaining consuming countries recorded the following average annual rates of market growth: India (+5.5% per year) and China (+0.6% per year).
The countries with the highest levels of electricity supply meter per capita consumption in 2023 were Italy (357 units per 1000 persons), the Netherlands (333 units per 1000 persons) and Canada (187 units per 1000 persons).
From 2013 to 2023, the biggest increases were recorded for Italy (with a CAGR of +34.8%), while consumption for the other global leaders experienced more modest paces of growth.
Production
World Production of Electricity Supply Or Production Meters
In 2023, global electricity supply meter production was estimated at 332M units, approximately mirroring the year before. Overall, the total production indicated a pronounced increase from 2013 to 2023: its volume increased at an average annual rate of +4.8% over the last decade. The trend pattern, however, indicated some noticeable fluctuations being recorded throughout the analyzed period. Based on 2023 figures, production decreased by -1.0% against 2021 indices. The most prominent rate of growth was recorded in 2018 with an increase of 23% against the previous year. Over the period under review, global production reached the maximum volume at 335M units in 2021; however, from 2022 to 2023, production remained at a lower figure.
In value terms, electricity supply meter production amounted to $16.6B in 2023 estimated in export price. Over the period under review, the total production indicated a strong expansion from 2013 to 2023: its value increased at an average annual rate of +5.6% over the last decade. The trend pattern, however, indicated some noticeable fluctuations being recorded throughout the analyzed period. Based on 2023 figures, production decreased by -1.6% against 2019 indices. The growth pace was the most rapid in 2015 with an increase of 22%. Over the period under review, global production attained the peak level at $16.9B in 2019; however, from 2020 to 2023, production remained at a lower figure.
Production By Country
The country with the largest volume of electricity supply meter production was China (118M units), comprising approx. 36% of total volume. Moreover, electricity supply meter production in China exceeded the figures recorded by the second-largest producer, India (27M units), fourfold. The United States (19M units) ranked third in terms of total production with a 5.8% share.
From 2013 to 2023, the average annual rate of growth in terms of volume in China amounted to +5.9%. The remaining producing countries recorded the following average annual rates of production growth: India (+6.3% per year) and the United States (+10.9% per year).
Imports
World Imports of Electricity Supply Or Production Meters
For the eleventh consecutive year, the global market recorded growth in supplies from abroad of electricity supply or production meters, which increased by 12% to 105M units in 2023. Overall, imports enjoyed a strong expansion. The pace of growth appeared the most rapid in 2017 when imports increased by 23% against the previous year. Global imports peaked in 2023 and are likely to see steady growth in the immediate term.
In value terms, electricity supply meter imports surged to $4.4B in 2023. In general, total imports indicated prominent growth from 2013 to 2023: its value increased at an average annual rate of +7.5% over the last decade. The trend pattern, however, indicated some noticeable fluctuations being recorded throughout the analyzed period. Based on 2023 figures, imports increased by +31.5% against 2021 indices. As a result, imports reached the peak and are likely to continue growth in the immediate term.
Imports By Country
In 2023, the United States (12M units), followed by Italy (7.4M units), the Netherlands (6.7M units), France (6.6M units), Germany (6.5M units), the Philippines (5.5M units) and the UK (4.9M units) were the major importers of electricity supply or production meters, together making up 48% of total imports. Canada (3.5M units), Thailand (3.4M units), Poland (2.8M units), Austria (1.9M units), Bangladesh (1.8M units) and Sweden (1.6M units) followed a long way behind the leaders.
From 2013 to 2023, the most notable rate of growth in terms of purchases, amongst the leading importing countries, was attained by Austria (with a CAGR of +34.3%), while imports for the other global leaders experienced more modest paces of growth.
In value terms, the United States ($751M) constitutes the largest market for imported electricity supply or production meters worldwide, comprising 17% of global imports. The second position in the ranking was held by Italy ($300M), with a 6.9% share of global imports. It was followed by France, with a 6.7% share.
From 2013 to 2023, the average annual growth rate of value in the United States totaled +8.4%. In the other countries, the average annual rates were as follows: Italy (+18.2% per year) and France (+14.7% per year).
Import Prices By Country
The average electricity supply meter import price stood at $42 per unit in 2023, rising by 7.4% against the previous year. Over the period under review, the import price, however, saw a slight slump. The growth pace was the most rapid in 2018 an increase of 9.5%. Over the period under review, average import prices reached the peak figure at $50 per unit in 2019; however, from 2020 to 2023, import prices failed to regain momentum.
There were significant differences in the average prices amongst the major importing countries. In 2023, amid the top importers, the country with the highest price was Austria ($68 per unit), while the Philippines ($5.3 per unit) was amongst the lowest.
From 2013 to 2023, the most notable rate of growth in terms of prices was attained by France (+3.7%), while the other global leaders experienced more modest paces of growth.
Exports
World Exports of Electricity Supply Or Production Meters
In 2023, shipments abroad of electricity supply or production meters increased by 18% to 130M units, rising for the eighth consecutive year after two years of decline. In general, exports continue to indicate a buoyant expansion. The most prominent rate of growth was recorded in 2018 with an increase of 52%. The global exports peaked in 2023 and are expected to retain growth in the near future.
In value terms, electricity supply meter exports skyrocketed to $4.6B in 2023. Overall, total exports indicated a prominent expansion from 2013 to 2023: its value increased at an average annual rate of +6.8% over the last decade. The trend pattern, however, indicated some noticeable fluctuations being recorded throughout the analyzed period. Based on 2023 figures, exports increased by +29.9% against 2021 indices. As a result, the exports attained the peak and are likely to continue growth in the immediate term.
Exports By Country
China prevails in exports structure, reaching 74M units, which was near 57% of total exports in 2023. It was distantly followed by Mexico (12M units), making up a 9% share of total exports. Poland (5.6M units), France (5.3M units), Tunisia (4M units), Slovenia (3.2M units), Greece (2.6M units), the United States (2.5M units) and Romania (2.4M units) took a minor share of total exports.
From 2013 to 2023, average annual rates of growth with regard to electricity supply meter exports from China stood at +12.1%. At the same time, Romania (+23.7%), Greece (+14.7%), Poland (+12.7%), France (+9.0%), Tunisia (+7.0%), Mexico (+6.9%) and Slovenia (+6.0%) displayed positive paces of growth. Moreover, Romania emerged as the fastest-growing exporter exported in the world, with a CAGR of +23.7% from 2013-2023. The United States experienced a relatively flat trend pattern. From 2013 to 2023, the share of China and Poland increased by +23 and +1.9 percentage points, respectively. The shares of the other countries remained relatively stable throughout the analyzed period.
In value terms, China ($1.5B) remains the largest electricity supply meter supplier worldwide, comprising 32% of global exports. The second position in the ranking was taken by Mexico ($685M), with a 15% share of global exports. It was followed by France, with a 5.4% share.
From 2013 to 2023, the average annual growth rate of value in China amounted to +12.4%. In the other countries, the average annual rates were as follows: Mexico (+8.9% per year) and France (+8.5% per year).
Export Prices By Country
In 2023, the average electricity supply meter export price amounted to $35 per unit, surging by 2.1% against the previous year. Over the period under review, the export price continues to indicate a relatively flat trend pattern. The pace of growth appeared the most rapid in 2015 when the average export price increased by 51%. The global export price peaked at $61 per unit in 2017; however, from 2018 to 2023, the export prices remained at a lower figure.
Prices varied noticeably by country of origin: amid the top suppliers, the country with the highest price was the United States ($101 per unit), while China ($20 per unit) was amongst the lowest.
From 2013 to 2023, the most notable rate of growth in terms of prices was attained by Poland (+2.7%), while the other global leaders experienced more modest paces of growth.
This report provides an in-depth analysis of the global electricity supply meter market. Within it, you will discover the latest data on market trends and opportunities by country, consumption, production and price developments, as well as the global trade (imports and exports). The forecast exhibits the market prospects through 2030.
Product coverage:
- Prodcom 26516370 - Electricity supply or production meters (including calibrated) (excluding voltmeters, ammeters, wattmeters and the like)
Country coverage:
Worldwide - the report contains statistical data for 200 countries and includes detailed profiles of the 50 largest consuming countries:
- USA
- China
- Japan
- Germany
- United Kingdom
- France
- Brazil
- Italy
- Russian Federation
- India
- Canada
- Australia
- Republic of Korea
- Spain
- Mexico
- Indonesia
- Netherlands
- Turkey
- Saudi Arabia
- Switzerland
- Sweden
- Nigeria
- Poland
- Belgium
- Argentina
- Norway
- Austria
- Thailand
- United Arab Emirates
- Colombia
- Denmark
- South Africa
- Malaysia
- Israel
- Singapore
- Egypt
- Philippines
- Finland
- Chile
- Ireland
- Pakistan
- Greece
- Portugal
- Kazakhstan
- Algeria
- Czech Republic
- Qatar
- Peru
- Romania
- Vietnam
+ the largest producing countries
Data coverage:
- Global market volume and value
- Per Capita consumption
- Forecast of the market dynamics in the medium term
- Global production, split by region and country
- Global trade (exports and imports)
- Export and import prices
- Market trends, drivers and restraints
- Key market players and their profiles
Reasons to buy this report:
- Take advantage of the latest data
- Find deeper insights into current market developments
- Discover vital success factors affecting the market
This report is designed for manufacturers, distributors, importers, and wholesalers, as well as for investors, consultants and advisors.
In this report, you can find information that helps you to make informed decisions on the following issues:
- How to diversify your business and benefit from new market opportunities
- How to load your idle production capacity
- How to boost your sales on overseas markets
- How to increase your profit margins
- How to make your supply chain more sustainable
- How to reduce your production and supply chain costs
- How to outsource production to other countries
- How to prepare your business for global expansion
While doing this research, we combine the accumulated expertise of our analysts and the capabilities of artificial intelligence. The AI-based platform, developed by our data scientists, constitutes the key working tool for business analysts, empowering them to discover deep insights and ideas from the marketing data.
-
1. INTRODUCTION
Making Data-Driven Decisions to Grow Your Business
- REPORT DESCRIPTION
- RESEARCH METHODOLOGY AND AI PLATFORM
- DATA-DRIVEN DECISIONS FOR YOUR BUSINESS
- GLOSSARY AND SPECIFIC TERMS
-
2. EXECUTIVE SUMMARY
A Quick Overview of Market Performance
- KEY FINDINGS
- MARKET TRENDS This Chapter is Available Only for the Professional Edition PRO
-
3. MARKET OVERVIEW
Understanding the Current State of The Market and Its Prospects
- MARKET SIZE
- CONSUMPTION BY COUNTRY
- MARKET FORECAST TO 2030
-
4. MOST PROMISING PRODUCT
Finding New Products to Diversify Your Business
This Chapter is Available Only for the Professional Edition PRO- TOP PRODUCTS TO DIVERSIFY YOUR BUSINESS
- BEST-SELLING PRODUCTS
- MOST CONSUMED PRODUCT
- MOST TRADED PRODUCT
- MOST PROFITABLE PRODUCT FOR EXPORT
-
5. MOST PROMISING SUPPLYING COUNTRIES
Choosing the Best Countries to Establish Your Sustainable Supply Chain
This Chapter is Available Only for the Professional Edition PRO- TOP COUNTRIES TO SOURCE YOUR PRODUCT
- TOP PRODUCING COUNTRIES
- TOP EXPORTING COUNTRIES
- LOW-COST EXPORTING COUNTRIES
-
6. MOST PROMISING OVERSEAS MARKETS
Choosing the Best Countries to Boost Your Exports
This Chapter is Available Only for the Professional Edition PRO- TOP OVERSEAS MARKETS FOR EXPORTING YOUR PRODUCT
- TOP CONSUMING MARKETS
- UNSATURATED MARKETS
- TOP IMPORTING MARKETS
- MOST PROFITABLE MARKETS
7. GLOBAL PRODUCTION
The Latest Trends and Insights into The Industry
- PRODUCTION VOLUME AND VALUE
- PRODUCTION BY COUNTRY
8. GLOBAL IMPORTS
The Largest Importers on The Market and How They Succeed
- IMPORTS FROM 2012–2023
- IMPORTS BY COUNTRY
- IMPORT PRICES BY COUNTRY
9. GLOBAL EXPORTS
The Largest Exporters on The Market and How They Succeed
- EXPORTS FROM 2012–2023
- EXPORTS BY COUNTRY
- EXPORT PRICES BY COUNTRY
-
10. PROFILES OF MAJOR PRODUCERS
The Largest Producers on The Market and Their Profiles
This Chapter is Available Only for the Professional Edition PRO -
11. COUNTRY PROFILES
The Largest Markets And Their Profiles
This Chapter is Available Only for the Professional Edition PRO- United States
- China
- Japan
- Germany
- United Kingdom
- France
- Brazil
- Italy
- Russian Federation
- India
- Canada
- Australia
- Republic of Korea
- Spain
- Mexico
- Indonesia
- Netherlands
- Turkey
- Saudi Arabia
- Switzerland
- Sweden
- Nigeria
- Poland
- Belgium
- Argentina
- Norway
- Austria
- Thailand
- United Arab Emirates
- Colombia
- Denmark
- South Africa
- Malaysia
- Israel
- Singapore
- Egypt
- Philippines
- Finland
- Chile
- Ireland
- Pakistan
- Greece
- Portugal
- Kazakhstan
- Algeria
- Czech Republic
- Qatar
- Peru
- Romania
- Vietnam
-
LIST OF TABLES
- Key Findings In 2023
- Market Volume, In Physical Terms, 2012–2023
- Market Value, 2012–2023
- Per Capita Consumption, By Country, 2018–2023
- Production, In Physical Terms, By Country, 2012–2023
- Imports, In Physical Terms, By Country, 2012–2023
- Imports, In Value Terms, By Country, 2012–2023
- Import Prices, By Country Of Destination, 2012–2023
- Exports, In Physical Terms, By Country, 2012–2023
- Exports, In Value Terms, By Country, 2012–2023
- Export Prices, By Country Of Origin, 2012–2023
-
LIST OF FIGURES
- Market Volume, In Physical Terms, 2012–2023
- Market Value, 2012–2023
- Consumption, By Country, 2023
- Market Volume Forecast to 2030
- Market Value Forecast to 2030
- Products: Market Size And Growth, By Type
- Products: Average Per Capita Consumption, By Type
- Products: Exports And Growth, By Type
- Products: Export Prices And Growth, By Type
- Production Volume And Growth
- Exports And Growth
- Export Prices And Growth
- Market Size And Growth
- Per Capita Consumption
- Imports And Growth
- Import Prices
- Production, In Physical Terms, 2012–2023
- Production, In Value Terms, 2012–2023
- Production, By Country, 2023
- Production, In Physical Terms, By Country, 2012–2023
- Imports, In Physical Terms, 2012–2023
- Imports, In Value Terms, 2012–2023
- Imports, In Physical Terms, By Country, 2023
- Imports, In Physical Terms, By Country, 2012–2023
- Imports, In Value Terms, By Country, 2012–2023
- Import Prices, By Country, 2012–2023
- Exports, In Physical Terms, 2012–2023
- Exports, In Value Terms, 2012–2023
- Exports, In Physical Terms, By Country, 2023
- Exports, In Physical Terms, By Country, 2012–2023
- Exports, In Value Terms, By Country, 2012–2023
- Export Prices, 2012–2023


