
World - Ethylene - Market Analysis, Forecast, Size, Trends And Insights
Get instant access to more than 2 million reports, dashboards, and datasets on the IndexBox Platform.
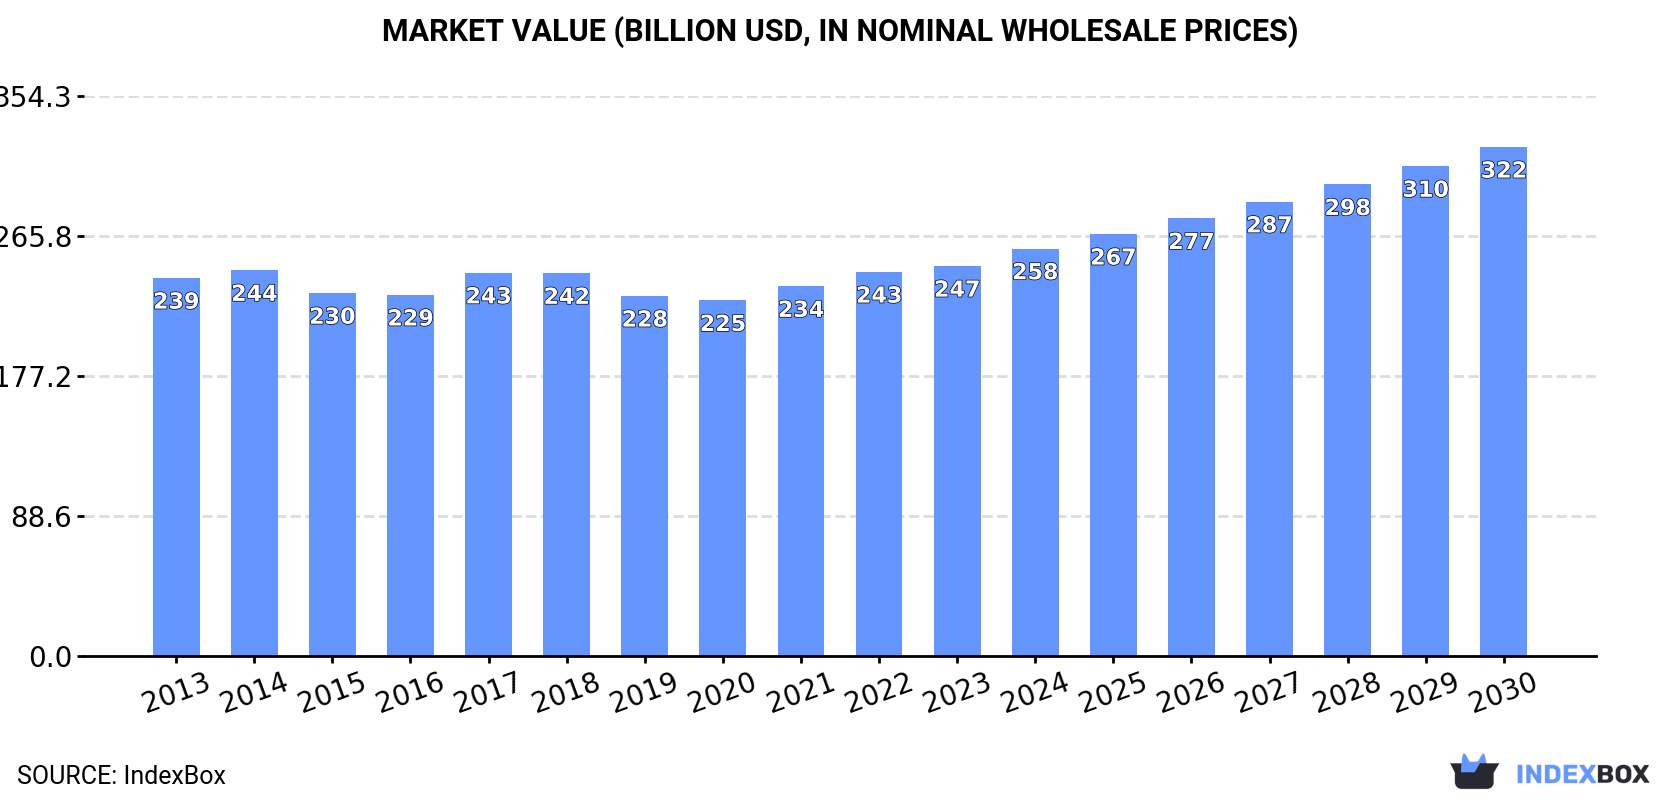
View PricingGlobal Ethylene Market to Reach $322.1B by 2030 with a CAGR of +3.9%
IndexBox has just published a new report: World - Ethylene - Market Analysis, Forecast, Size, Trends And Insights.
The global ethylene market is projected to see a steady increase in demand over the next seven years, with market volume expected to reach 148M tons and market value anticipated to reach $322.1B by the end of 2030. This growth is driven by a rising demand for ethylene worldwide, with a forecasted CAGR of +2.1% for volume and +3.9% for value from 2023 to 2030.
Market Forecast
Driven by increasing demand for ethylene worldwide, the market is expected to continue an upward consumption trend over the next seven-year period. Market performance is forecast to retain its current trend pattern, expanding with an anticipated CAGR of +2.1% for the period from 2023 to 2030, which is projected to bring the market volume to 148M tons by the end of 2030.
In value terms, the market is forecast to increase with an anticipated CAGR of +3.9% for the period from 2023 to 2030, which is projected to bring the market value to $322.1B (in nominal wholesale prices) by the end of 2030.
Consumption
World Consumption of Ethylene
In 2023, the amount of ethylene consumed worldwide stood at 128M tons, remaining relatively unchanged against the previous year. The total consumption volume increased at an average annual rate of +1.3% over the period from 2013 to 2023; the trend pattern remained consistent, with somewhat noticeable fluctuations being observed throughout the analyzed period. The growth pace was the most rapid in 2017 when the consumption volume increased by 5.8%. Over the period under review, global consumption attained the peak volume at 131M tons in 2021; however, from 2022 to 2023, consumption failed to regain momentum.
The global ethylene market value was estimated at $246.8B in 2023, surging by 1.5% against the previous year. This figure reflects the total revenues of producers and importers (excluding logistics costs, retail marketing costs, and retailers' margins, which will be included in the final consumer price). Overall, consumption showed a relatively flat trend pattern. The growth pace was the most rapid in 2017 with an increase of 6.1% against the previous year. Over the period under review, the global market attained the peak level in 2023 and is likely to continue growth in the near future.
Consumption By Country
The countries with the highest volumes of consumption in 2023 were China (24M tons), the United States (15M tons) and India (9.4M tons), with a combined 38% share of global consumption.
From 2013 to 2023, the most notable rate of growth in terms of consumption, amongst the key consuming countries, was attained by the United States (with a CAGR of +9.6%), while consumption for the other global leaders experienced more modest paces of growth.
In value terms, China ($35.9B) led the market, alone. The second position in the ranking was taken by Nigeria ($14.6B). It was followed by the United States.
In China, the ethylene market remained relatively stable over the period from 2013-2023. The remaining consuming countries recorded the following average annual rates of market growth: Nigeria (+14.8% per year) and the United States (+8.0% per year).
In 2023, the highest levels of ethylene per capita consumption was registered in Belgium (198 kg per person), followed by Japan (45 kg per person), the United States (43 kg per person) and the UK (38 kg per person), while the world average per capita consumption of ethylene was estimated at 16 kg per person.
In Belgium, ethylene per capita consumption plunged by an average annual rate of -1.1% over the period from 2013-2023. The remaining consuming countries recorded the following average annual rates of per capita consumption growth: Japan (+1.3% per year) and the United States (+8.9% per year).
Production
World Production of Ethylene
In 2023, global ethylene production stood at 129M tons, therefore, remained relatively stable against the previous year. The total output volume increased at an average annual rate of +1.3% over the period from 2013 to 2023; the trend pattern remained relatively stable, with somewhat noticeable fluctuations being observed throughout the analyzed period. The most prominent rate of growth was recorded in 2017 with an increase of 5.8% against the previous year. Global production peaked at 131M tons in 2021; however, from 2022 to 2023, production stood at a somewhat lower figure.
In value terms, ethylene production surged to $362B in 2023 estimated in export price. Over the period under review, production, however, saw a deep reduction. Global production peaked at $1,953.3B in 2013; however, from 2014 to 2023, production remained at a lower figure.
Production By Country
The countries with the highest volumes of production in 2023 were China (22M tons), the United States (16M tons) and India (9.4M tons), together accounting for 37% of global production.
From 2013 to 2023, the most notable rate of growth in terms of production, amongst the leading producing countries, was attained by the United States (with a CAGR of +10.2%), while production for the other global leaders experienced more modest paces of growth.
Imports
World Imports of Ethylene
Global ethylene imports declined to 6.8M tons in 2023, dropping by -6.5% against 2022 figures. The total import volume increased at an average annual rate of +1.2% from 2013 to 2023; the trend pattern remained relatively stable, with somewhat noticeable fluctuations being observed in certain years. The most prominent rate of growth was recorded in 2015 with an increase of 9.9%. Over the period under review, global imports reached the maximum at 7.3M tons in 2022, and then declined in the following year.
In value terms, ethylene imports declined significantly to $7.1B in 2023. Over the period under review, imports saw a mild setback. The most prominent rate of growth was recorded in 2021 with an increase of 35%. Over the period under review, global imports reached the peak figure at $8.7B in 2018; however, from 2019 to 2023, imports stood at a somewhat lower figure.
Imports By Country
China (2.1M tons) and Belgium (1.5M tons) represented roughly 53% of total imports in 2023. Indonesia (838K tons) held the next position in the ranking, followed by Germany (561K tons) and Taiwan (Chinese) (386K tons). All these countries together took approx. 26% share of total imports. The Netherlands (223K tons), South Korea (174K tons), Italy (127K tons), Sweden (108K tons), Portugal (105K tons) and France (103K tons) followed a long way behind the leaders.
From 2013 to 2023, the biggest increases were recorded for Italy (with a CAGR of +25.2%), while purchases for the other global leaders experienced more modest paces of growth.
In value terms, the largest ethylene importing markets worldwide were Belgium ($1.9B), China ($1.9B) and Indonesia ($893M), together comprising 65% of global imports. Germany, Taiwan (Chinese), the Netherlands, South Korea, Italy, France, Sweden and Portugal lagged somewhat behind, together accounting for a further 27%.
Italy, with a CAGR of +21.9%, saw the highest rates of growth with regard to the value of imports, among the main importing countries over the period under review, while purchases for the other global leaders experienced more modest paces of growth.
Import Prices By Country
The average ethylene import price stood at $1,045 per ton in 2023, declining by -12% against the previous year. Over the period under review, the import price continues to indicate a perceptible contraction. The pace of growth appeared the most rapid in 2021 an increase of 37%. Global import price peaked at $1,397 per ton in 2014; however, from 2015 to 2023, import prices failed to regain momentum.
Average prices varied somewhat amongst the major importing countries. In 2023, major importing countries recorded the following prices: in France ($1,300 per ton) and the Netherlands ($1,290 per ton), while China ($876 per ton) and Portugal ($880 per ton) were amongst the lowest.
From 2013 to 2023, the most notable rate of growth in terms of prices was attained by France (-1.2%), while the other global leaders experienced a decline in the import price figures.
Exports
World Exports of Ethylene
In 2023, shipments abroad of ethylene increased by 1.3% to 7.2M tons, rising for the second consecutive year after two years of decline. The total export volume increased at an average annual rate of +1.5% from 2013 to 2023; the trend pattern remained consistent, with only minor fluctuations being recorded throughout the analyzed period. The pace of growth appeared the most rapid in 2016 when exports increased by 7.2%. Over the period under review, the global exports reached the maximum at 7.4M tons in 2019; however, from 2020 to 2023, the exports stood at a somewhat lower figure.
In value terms, ethylene exports reduced to $6.9B in 2023. Overall, exports, however, saw a mild downturn. The pace of growth appeared the most rapid in 2021 when exports increased by 38%. Over the period under review, the global exports reached the peak figure at $8.4B in 2018; however, from 2019 to 2023, the exports remained at a lower figure.
Exports By Country
The biggest shipments were from South Korea (1.4M tons), the United States (1.1M tons) and the Netherlands (1M tons), together finishing at 48% of total export. Japan (629K tons) ranks next in terms of the total exports with an 8.7% share, followed by Singapore (7.2%), the UK (5.5%) and Malaysia (5.4%). The following exporters - Norway (311K tons), Belgium (270K tons), the United Arab Emirates (199K tons), Germany (174K tons), China (159K tons) and Taiwan (Chinese) (136K tons) - together made up 17% of total exports.
From 2013 to 2023, the most notable rate of growth in terms of shipments, amongst the key exporting countries, was attained by China (with a CAGR of +132.2%), while the other global leaders experienced more modest paces of growth.
In value terms, South Korea ($1.4B), the Netherlands ($1.1B) and the United States ($735M) appeared to be the countries with the highest levels of exports in 2023, with a combined 48% share of global exports. The UK, Japan, Norway, Singapore, Malaysia, Belgium, the United Arab Emirates, Germany, Taiwan (Chinese) and China lagged somewhat behind, together comprising a further 44%.
China, with a CAGR of +111.5%, recorded the highest growth rate of the value of exports, in terms of the main exporting countries over the period under review, while shipments for the other global leaders experienced more modest paces of growth.
Export Prices By Country
In 2023, the average ethylene export price amounted to $952 per ton, declining by -14.3% against the previous year. In general, the export price showed a noticeable descent. The pace of growth appeared the most rapid in 2021 when the average export price increased by 39% against the previous year. Over the period under review, the average export prices reached the maximum at $1,357 per ton in 2014; however, from 2015 to 2023, the export prices stood at a somewhat lower figure.
Prices varied noticeably by country of origin: amid the top suppliers, the country with the highest price was the UK ($1,300 per ton), while Singapore ($598 per ton) was amongst the lowest.
From 2013 to 2023, the most notable rate of growth in terms of prices was attained by the UK (-0.7%), while the other global leaders experienced a decline in the export price figures.
This report provides an in-depth analysis of the global ethylene market. Within it, you will discover the latest data on market trends and opportunities by country, consumption, production and price developments, as well as the global trade (imports and exports). The forecast exhibits the market prospects through 2030.
Product coverage:
- Prodcom 20141130 - Ethylene
Country coverage:
Worldwide - the report contains statistical data for 200 countries and includes detailed profiles of the 50 largest consuming countries:
- USA
- China
- Japan
- Germany
- United Kingdom
- France
- Brazil
- Italy
- Russian Federation
- India
- Canada
- Australia
- Republic of Korea
- Spain
- Mexico
- Indonesia
- Netherlands
- Turkey
- Saudi Arabia
- Switzerland
- Sweden
- Nigeria
- Poland
- Belgium
- Argentina
- Norway
- Austria
- Thailand
- United Arab Emirates
- Colombia
- Denmark
- South Africa
- Malaysia
- Israel
- Singapore
- Egypt
- Philippines
- Finland
- Chile
- Ireland
- Pakistan
- Greece
- Portugal
- Kazakhstan
- Algeria
- Czech Republic
- Qatar
- Peru
- Romania
- Vietnam
+ the largest producing countries
Data coverage:
- Global market volume and value
- Per Capita consumption
- Forecast of the market dynamics in the medium term
- Global production, split by region and country
- Global trade (exports and imports)
- Export and import prices
- Market trends, drivers and restraints
- Key market players and their profiles
Company coverage:
Reasons to buy this report:
- Take advantage of the latest data
- Find deeper insights into current market developments
- Discover vital success factors affecting the market
This report is designed for manufacturers, distributors, importers, and wholesalers, as well as for investors, consultants and advisors.
In this report, you can find information that helps you to make informed decisions on the following issues:
- How to diversify your business and benefit from new market opportunities
- How to load your idle production capacity
- How to boost your sales on overseas markets
- How to increase your profit margins
- How to make your supply chain more sustainable
- How to reduce your production and supply chain costs
- How to outsource production to other countries
- How to prepare your business for global expansion
While doing this research, we combine the accumulated expertise of our analysts and the capabilities of artificial intelligence. The AI-based platform, developed by our data scientists, constitutes the key working tool for business analysts, empowering them to discover deep insights and ideas from the marketing data.
-
1. INTRODUCTION
Making Data-Driven Decisions to Grow Your Business
- REPORT DESCRIPTION
- RESEARCH METHODOLOGY AND AI PLATFORM
- DATA-DRIVEN DECISIONS FOR YOUR BUSINESS
- GLOSSARY AND SPECIFIC TERMS
-
2. EXECUTIVE SUMMARY
A Quick Overview of Market Performance
- KEY FINDINGS
- MARKET TRENDS This Chapter is Available Only for the Professional Edition PRO
-
3. MARKET OVERVIEW
Understanding the Current State of The Market and Its Prospects
- MARKET SIZE
- CONSUMPTION BY COUNTRY
- MARKET FORECAST TO 2030
-
4. MOST PROMISING PRODUCT
Finding New Products to Diversify Your Business
This Chapter is Available Only for the Professional Edition PRO- TOP PRODUCTS TO DIVERSIFY YOUR BUSINESS
- BEST-SELLING PRODUCTS
- MOST CONSUMED PRODUCT
- MOST TRADED PRODUCT
- MOST PROFITABLE PRODUCT FOR EXPORT
-
5. MOST PROMISING SUPPLYING COUNTRIES
Choosing the Best Countries to Establish Your Sustainable Supply Chain
This Chapter is Available Only for the Professional Edition PRO- TOP COUNTRIES TO SOURCE YOUR PRODUCT
- TOP PRODUCING COUNTRIES
- TOP EXPORTING COUNTRIES
- LOW-COST EXPORTING COUNTRIES
-
6. MOST PROMISING OVERSEAS MARKETS
Choosing the Best Countries to Boost Your Exports
This Chapter is Available Only for the Professional Edition PRO- TOP OVERSEAS MARKETS FOR EXPORTING YOUR PRODUCT
- TOP CONSUMING MARKETS
- UNSATURATED MARKETS
- TOP IMPORTING MARKETS
- MOST PROFITABLE MARKETS
7. GLOBAL PRODUCTION
The Latest Trends and Insights into The Industry
- PRODUCTION VOLUME AND VALUE
- PRODUCTION BY COUNTRY
8. GLOBAL IMPORTS
The Largest Importers on The Market and How They Succeed
- IMPORTS FROM 2012–2023
- IMPORTS BY COUNTRY
- IMPORT PRICES BY COUNTRY
9. GLOBAL EXPORTS
The Largest Exporters on The Market and How They Succeed
- EXPORTS FROM 2012–2023
- EXPORTS BY COUNTRY
- EXPORT PRICES BY COUNTRY
-
10. PROFILES OF MAJOR PRODUCERS
The Largest Producers on The Market and Their Profiles
This Chapter is Available Only for the Professional Edition PRO -
11. COUNTRY PROFILES
The Largest Markets And Their Profiles
This Chapter is Available Only for the Professional Edition PRO- United States
- China
- Japan
- Germany
- United Kingdom
- France
- Brazil
- Italy
- Russian Federation
- India
- Canada
- Australia
- Republic of Korea
- Spain
- Mexico
- Indonesia
- Netherlands
- Turkey
- Saudi Arabia
- Switzerland
- Sweden
- Nigeria
- Poland
- Belgium
- Argentina
- Norway
- Austria
- Thailand
- United Arab Emirates
- Colombia
- Denmark
- South Africa
- Malaysia
- Israel
- Singapore
- Egypt
- Philippines
- Finland
- Chile
- Ireland
- Pakistan
- Greece
- Portugal
- Kazakhstan
- Algeria
- Czech Republic
- Qatar
- Peru
- Romania
- Vietnam
-
LIST OF TABLES
- Key Findings In 2023
- Market Volume, In Physical Terms, 2012–2023
- Market Value, 2012–2023
- Per Capita Consumption, By Country, 2018–2023
- Production, In Physical Terms, By Country, 2012–2023
- Imports, In Physical Terms, By Country, 2012–2023
- Imports, In Value Terms, By Country, 2012–2023
- Import Prices, By Country Of Destination, 2012–2023
- Exports, In Physical Terms, By Country, 2012–2023
- Exports, In Value Terms, By Country, 2012–2023
- Export Prices, By Country Of Origin, 2012–2023
-
LIST OF FIGURES
- Market Volume, In Physical Terms, 2012–2023
- Market Value, 2012–2023
- Consumption, By Country, 2023
- Market Volume Forecast to 2030
- Market Value Forecast to 2030
- Products: Market Size And Growth, By Type
- Products: Average Per Capita Consumption, By Type
- Products: Exports And Growth, By Type
- Products: Export Prices And Growth, By Type
- Production Volume And Growth
- Exports And Growth
- Export Prices And Growth
- Market Size And Growth
- Per Capita Consumption
- Imports And Growth
- Import Prices
- Production, In Physical Terms, 2012–2023
- Production, In Value Terms, 2012–2023
- Production, By Country, 2023
- Production, In Physical Terms, By Country, 2012–2023
- Imports, In Physical Terms, 2012–2023
- Imports, In Value Terms, 2012–2023
- Imports, In Physical Terms, By Country, 2023
- Imports, In Physical Terms, By Country, 2012–2023
- Imports, In Value Terms, By Country, 2012–2023
- Import Prices, By Country, 2012–2023
- Exports, In Physical Terms, 2012–2023
- Exports, In Value Terms, 2012–2023
- Exports, In Physical Terms, By Country, 2023
- Exports, In Physical Terms, By Country, 2012–2023
- Exports, In Value Terms, By Country, 2012–2023
- Export Prices, 2012–2023


