
World - Fixed Carbon Resistors, Composition Or Film Types And Electrical Variable Resistors - Market Analysis, Forecast, Size, Trends And Insights
Get instant access to more than 2 million reports, dashboards, and datasets on the IndexBox Platform.
View PricingGlobal Fixed Carbon Resistor Market Expected to See Steady Growth with CAGR of +2.3% Leading to Market Value of $73.5B by 2030
IndexBox has just published a new report: World - Fixed Carbon Resistors, Composition Or Film Types And Electrical Variable Resistors - Market Analysis, Forecast, Size, Trends And Insights.
The global fixed carbon resistor market is expected to see a slight growth in consumption and value from 2023 to 2030, with a projected CAGR of +0.0% and +2.3% respectively. While there was a decline in consumption in 2023, countries like China, Mexico, and the United States were the highest consumers. Production and imports also saw fluctuations during the period under review. China dominated both production and exports, while Mexico led in imports. The average per capita consumption of fixed carbon resistors also varied across different countries, with Mexico leading the way. Prices and trends differed among exporting and importing countries as well.
Market Forecast
Market Forecast
Driven by rising demand for fixed carbon resistor worldwide, the market is expected to start an upward consumption trend over the next seven-year period. The performance of the market is forecast to increase slightly, with an anticipated CAGR of +0.0% for the period from 2023 to 2030, which is projected to bring the market volume to 1,091B units by the end of 2030.
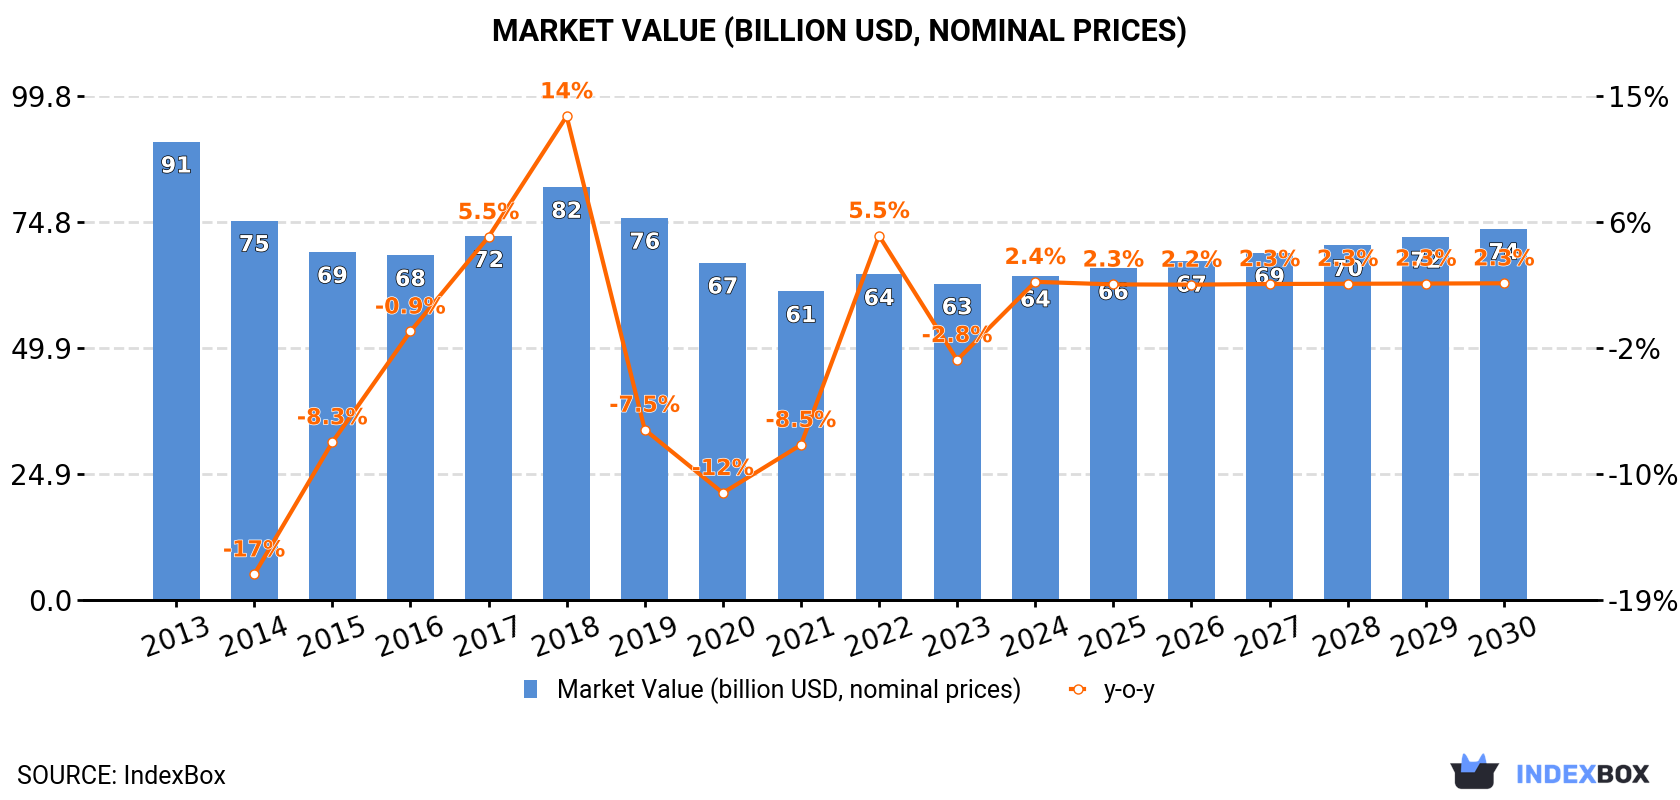
In value terms, the market is forecast to increase with an anticipated CAGR of +2.3% for the period from 2023 to 2030, which is projected to bring the market value to $73.5B (in nominal prices) by the end of 2030.
Consumption
Consumption
In 2023, after two years of growth, there was decline in consumption of fixed carbon resistors, composition or film types and electrical variable resistors, when its volume decreased by -4.4% to 1,090B units. Overall, consumption saw a perceptible setback. Over the period under review, global consumption attained the maximum volume at 1,514B units in 2013; however, from 2014 to 2023, consumption failed to regain momentum.
The global fixed carbon resistor market value contracted slightly to $62.6B in 2023, with a decrease of -2.8% against the previous year. This figure reflects the total revenues of producers and importers (excluding logistics costs, retail marketing costs, and retailers' margins, which will be included in the final consumer price). In general, consumption showed a pronounced decrease. Global consumption peaked at $90.7B in 2013; however, from 2014 to 2023, consumption stood at a somewhat lower figure.
Consumption By Country
The countries with the highest volumes of consumption in 2023 were China (249B units), Mexico (214B units) and the United States (168B units), together accounting for 58% of global consumption.
From 2013 to 2023, the most notable rate of growth in terms of consumption, amongst the main consuming countries, was attained by Mexico (with a CAGR of +0.6%), while consumption for the other global leaders experienced a decline in the consumption figures.
In value terms, the United States ($37.8B) led the market, alone. The second position in the ranking was taken by Japan ($5B). It was followed by China.
From 2013 to 2023, the average annual growth rate of value in the United States totaled -2.0%. In the other countries, the average annual rates were as follows: Japan (-9.1% per year) and China (-1.7% per year).
In 2023, the highest levels of fixed carbon resistor per capita consumption was registered in Mexico (1,608 units per person), followed by the United States (500 units per person), the UK (365 units per person) and Japan (285 units per person), while the world average per capita consumption of fixed carbon resistor was estimated at 137 units per person.
From 2013 to 2023, the average annual growth rate of the fixed carbon resistor per capita consumption in Mexico was relatively modest. In the other countries, the average annual rates were as follows: the United States (-2.1% per year) and the UK (-6.1% per year).
Production
Production
In 2023, production of fixed carbon resistors, composition or film types and electrical variable resistors was finally on the rise to reach 883B units for the first time since 2018, thus ending a four-year declining trend. Over the period under review, production, however, saw a noticeable downturn. The most prominent rate of growth was recorded in 2018 when the production volume increased by 17% against the previous year. As a result, production attained the peak volume of 1,248B units. From 2019 to 2023, global production growth remained at a lower figure.
In value terms, fixed carbon resistor production fell modestly to $64.6B in 2023 estimated in export price. Overall, production, however, saw a pronounced curtailment. The pace of growth was the most pronounced in 2018 when the production volume increased by 17% against the previous year. Global production peaked at $95.3B in 2013; however, from 2014 to 2023, production remained at a lower figure.
Production By Country
The countries with the highest volumes of production in 2023 were China (294B units), the United States (167B units) and India (93B units), with a combined 63% share of global production. Japan, Pakistan, Malaysia, Thailand, Indonesia and the UK lagged somewhat behind, together accounting for a further 18%.
From 2013 to 2023, the most notable rate of growth in terms of production, amongst the main producing countries, was attained by Malaysia (with a CAGR of +1.4%), while production for the other global leaders experienced mixed trends in the production figures.
Imports
Imports
In 2023, after three years of growth, there was significant decline in supplies from abroad of fixed carbon resistors, composition or film types and electrical variable resistors, when their volume decreased by -14.3% to 396B units. Over the period under review, imports recorded a pronounced decrease. The most prominent rate of growth was recorded in 2021 with an increase of 92%. Over the period under review, global imports hit record highs at 495B units in 2013; however, from 2014 to 2023, imports remained at a lower figure.
In value terms, fixed carbon resistor imports contracted significantly to $4.4B in 2023. Overall, total imports indicated a slight increase from 2013 to 2023: its value increased at an average annual rate of +1.3% over the last decade. The trend pattern, however, indicated some noticeable fluctuations being recorded throughout the analyzed period. Based on 2023 figures, imports decreased by -24.3% against 2021 indices. The pace of growth appeared the most rapid in 2020 when imports increased by 27%. Global imports peaked at $5.9B in 2021; however, from 2022 to 2023, imports stood at a somewhat lower figure.
Imports By Country
Mexico dominates imports structure, finishing at 212B units, which was near 54% of total imports in 2023. China (39B units) took a 9.9% share (based on physical terms) of total imports, which put it in second place, followed by Spain (5%). The UK (13B units), Hong Kong SAR (13B units), Ireland (11B units), France (11B units) and South Korea (6.6B units) took a relatively small share of total imports.
Mexico experienced a relatively flat trend pattern with regard to volume of imports of fixed carbon resistors, composition or film types and electrical variable resistors. At the same time, Ireland (+26.7%), Spain (+20.2%), China (+14.1%), the UK (+2.1%) and South Korea (+1.5%) displayed positive paces of growth. Moreover, Ireland emerged as the fastest-growing importer imported in the world, with a CAGR of +26.7% from 2013-2023. France experienced a relatively flat trend pattern. By contrast, Hong Kong SAR (-10.9%) illustrated a downward trend over the same period. From 2013 to 2023, the share of Mexico, China, Spain and Ireland increased by +13, +7.8, +4.4 and +2.7 percentage points, respectively. The shares of the other countries remained relatively stable throughout the analyzed period.
In value terms, the largest fixed carbon resistor importing markets worldwide were China ($807M), Hong Kong SAR ($528M) and Mexico ($302M), with a combined 37% share of global imports. France, Spain, South Korea, the UK and Ireland lagged somewhat behind, together accounting for a further 10%.
Spain, with a CAGR of +19.2%, saw the highest rates of growth with regard to the value of imports, in terms of the main importing countries over the period under review, while purchases for the other global leaders experienced more modest paces of growth.
Import Prices By Country
In 2023, the average fixed carbon resistor import price amounted to $11 per thousand units, falling by -5.9% against the previous year. In general, the import price, however, posted a measured increase. The pace of growth was the most pronounced in 2014 an increase of 109%. Global import price peaked at $23 per thousand units in 2020; however, from 2021 to 2023, import prices stood at a somewhat lower figure.
There were significant differences in the average prices amongst the major importing countries. In 2023, amid the top importers, the country with the highest price was Hong Kong SAR ($41 per thousand units), while Ireland ($1.4 per thousand units) was amongst the lowest.
From 2013 to 2023, the most notable rate of growth in terms of prices was attained by Hong Kong SAR (+12.2%), while the other global leaders experienced more modest paces of growth.
Exports
Exports
In 2023, overseas shipments of fixed carbon resistors, composition or film types and electrical variable resistors decreased by -6.9% to 189B units, falling for the second year in a row after two years of growth. In general, exports, however, recorded a relatively flat trend pattern. The pace of growth was the most pronounced in 2021 when exports increased by 53% against the previous year. As a result, the exports attained the peak of 254B units. From 2022 to 2023, the growth of the global exports remained at a lower figure.
In value terms, fixed carbon resistor exports reduced dramatically to $4.3B in 2023. Overall, exports, however, recorded a relatively flat trend pattern. The most prominent rate of growth was recorded in 2020 with an increase of 27% against the previous year. The global exports peaked at $6.4B in 2022, and then reduced markedly in the following year.
Exports By Country
China was the major exporting country with an export of around 83B units, which finished at 44% of total exports. It was distantly followed by Malaysia (20B units), Thailand (16B units), Hong Kong SAR (12B units) and Singapore (9.3B units), together constituting a 30% share of total exports. Italy (6B units), the Philippines (5.2B units), Indonesia (4.3B units) and Spain (4.1B units) held a little share of total exports.
From 2013 to 2023, average annual rates of growth with regard to fixed carbon resistor exports from China stood at +10.2%. At the same time, the Philippines (+53.3%), Italy (+29.0%) and Spain (+10.0%) displayed positive paces of growth. Moreover, the Philippines emerged as the fastest-growing exporter exported in the world, with a CAGR of +53.3% from 2013-2023. Thailand and Malaysia experienced a relatively flat trend pattern. By contrast, Singapore (-2.6%), Indonesia (-5.2%) and Hong Kong SAR (-8.7%) illustrated a downward trend over the same period. From 2013 to 2023, the share of China, Italy and the Philippines increased by +27, +2.9 and +2.7 percentage points, respectively. The shares of the other countries remained relatively stable throughout the analyzed period.
In value terms, China ($882M), Hong Kong SAR ($523M) and Singapore ($139M) were the countries with the highest levels of exports in 2023, together accounting for 36% of global exports. Thailand, Indonesia, Malaysia, the Philippines, Spain and Italy lagged somewhat behind, together comprising a further 9.5%.
In terms of the main exporting countries, the Philippines, with a CAGR of +12.4%, recorded the highest rates of growth with regard to the value of exports, over the period under review, while shipments for the other global leaders experienced more modest paces of growth.
Export Prices By Country
In 2023, the average fixed carbon resistor export price amounted to $23 per thousand units, shrinking by -27.6% against the previous year. Over the period under review, the export price, however, recorded a relatively flat trend pattern. The pace of growth appeared the most rapid in 2019 when the average export price increased by 37% against the previous year. Over the period under review, the average export prices attained the peak figure at $32 per thousand units in 2022, and then contracted remarkably in the following year.
Prices varied noticeably by country of origin: amid the top suppliers, the country with the highest price was Hong Kong SAR ($43 per thousand units), while Malaysia ($4.1 per thousand units) was amongst the lowest.
From 2013 to 2023, the most notable rate of growth in terms of prices was attained by Indonesia (+11.2%), while the other global leaders experienced more modest paces of growth.
This report provides an in-depth analysis of the global fixed carbon resistor market. Within it, you will discover the latest data on market trends and opportunities by country, consumption, production and price developments, as well as the global trade (imports and exports). The forecast exhibits the market prospects through 2030.
Product coverage:
- Prodcom 27906080 - Fixed carbon resistors, composition or film types (excluding heating resistors), electrical variable resistors, including rheostats and potentiometers (excluding wirewound variable resistors and heating resistors)
Country coverage:
Worldwide - the report contains statistical data for 200 countries and includes detailed profiles of the 50 largest consuming countries:
- USA
- China
- Japan
- Germany
- United Kingdom
- France
- Brazil
- Italy
- Russian Federation
- India
- Canada
- Australia
- Republic of Korea
- Spain
- Mexico
- Indonesia
- Netherlands
- Turkey
- Saudi Arabia
- Switzerland
- Sweden
- Nigeria
- Poland
- Belgium
- Argentina
- Norway
- Austria
- Thailand
- United Arab Emirates
- Colombia
- Denmark
- South Africa
- Malaysia
- Israel
- Singapore
- Egypt
- Philippines
- Finland
- Chile
- Ireland
- Pakistan
- Greece
- Portugal
- Kazakhstan
- Algeria
- Czech Republic
- Qatar
- Peru
- Romania
- Vietnam
+ the largest producing countries
Data coverage:
- Global market volume and value
- Per Capita consumption
- Forecast of the market dynamics in the medium term
- Global production, split by region and country
- Global trade (exports and imports)
- Export and import prices
- Market trends, drivers and restraints
- Key market players and their profiles
Reasons to buy this report:
- Take advantage of the latest data
- Find deeper insights into current market developments
- Discover vital success factors affecting the market
This report is designed for manufacturers, distributors, importers, and wholesalers, as well as for investors, consultants and advisors.
In this report, you can find information that helps you to make informed decisions on the following issues:
- How to diversify your business and benefit from new market opportunities
- How to load your idle production capacity
- How to boost your sales on overseas markets
- How to increase your profit margins
- How to make your supply chain more sustainable
- How to reduce your production and supply chain costs
- How to outsource production to other countries
- How to prepare your business for global expansion
While doing this research, we combine the accumulated expertise of our analysts and the capabilities of artificial intelligence. The AI-based platform, developed by our data scientists, constitutes the key working tool for business analysts, empowering them to discover deep insights and ideas from the marketing data.
-
1. INTRODUCTION
Making Data-Driven Decisions to Grow Your Business
- REPORT DESCRIPTION
- RESEARCH METHODOLOGY AND AI PLATFORM
- DATA-DRIVEN DECISIONS FOR YOUR BUSINESS
- GLOSSARY AND SPECIFIC TERMS
-
2. EXECUTIVE SUMMARY
A Quick Overview of Market Performance
- KEY FINDINGS
- MARKET TRENDS This Chapter is Available Only for the Professional Edition PRO
-
3. MARKET OVERVIEW
Understanding the Current State of The Market and Its Prospects
- MARKET SIZE
- CONSUMPTION BY COUNTRY
- MARKET FORECAST TO 2030
-
4. MOST PROMISING PRODUCT
Finding New Products to Diversify Your Business
This Chapter is Available Only for the Professional Edition PRO- TOP PRODUCTS TO DIVERSIFY YOUR BUSINESS
- BEST-SELLING PRODUCTS
- MOST CONSUMED PRODUCT
- MOST TRADED PRODUCT
- MOST PROFITABLE PRODUCT FOR EXPORT
-
5. MOST PROMISING SUPPLYING COUNTRIES
Choosing the Best Countries to Establish Your Sustainable Supply Chain
This Chapter is Available Only for the Professional Edition PRO- TOP COUNTRIES TO SOURCE YOUR PRODUCT
- TOP PRODUCING COUNTRIES
- TOP EXPORTING COUNTRIES
- LOW-COST EXPORTING COUNTRIES
-
6. MOST PROMISING OVERSEAS MARKETS
Choosing the Best Countries to Boost Your Exports
This Chapter is Available Only for the Professional Edition PRO- TOP OVERSEAS MARKETS FOR EXPORTING YOUR PRODUCT
- TOP CONSUMING MARKETS
- UNSATURATED MARKETS
- TOP IMPORTING MARKETS
- MOST PROFITABLE MARKETS
7. GLOBAL PRODUCTION
The Latest Trends and Insights into The Industry
- PRODUCTION VOLUME AND VALUE
- PRODUCTION BY COUNTRY
8. GLOBAL IMPORTS
The Largest Importers on The Market and How They Succeed
- IMPORTS FROM 2012–2023
- IMPORTS BY COUNTRY
- IMPORT PRICES BY COUNTRY
9. GLOBAL EXPORTS
The Largest Exporters on The Market and How They Succeed
- EXPORTS FROM 2012–2023
- EXPORTS BY COUNTRY
- EXPORT PRICES BY COUNTRY
-
10. PROFILES OF MAJOR PRODUCERS
The Largest Producers on The Market and Their Profiles
This Chapter is Available Only for the Professional Edition PRO -
11. COUNTRY PROFILES
The Largest Markets And Their Profiles
This Chapter is Available Only for the Professional Edition PRO- United States
- China
- Japan
- Germany
- United Kingdom
- France
- Brazil
- Italy
- Russian Federation
- India
- Canada
- Australia
- Republic of Korea
- Spain
- Mexico
- Indonesia
- Netherlands
- Turkey
- Saudi Arabia
- Switzerland
- Sweden
- Nigeria
- Poland
- Belgium
- Argentina
- Norway
- Austria
- Thailand
- United Arab Emirates
- Colombia
- Denmark
- South Africa
- Malaysia
- Israel
- Singapore
- Egypt
- Philippines
- Finland
- Chile
- Ireland
- Pakistan
- Greece
- Portugal
- Kazakhstan
- Algeria
- Czech Republic
- Qatar
- Peru
- Romania
- Vietnam
-
LIST OF TABLES
- Key Findings In 2023
- Market Volume, In Physical Terms, 2012–2023
- Market Value, 2012–2023
- Per Capita Consumption, By Country, 2018–2023
- Production, In Physical Terms, By Country, 2012–2023
- Imports, In Physical Terms, By Country, 2012–2023
- Imports, In Value Terms, By Country, 2012–2023
- Import Prices, By Country Of Destination, 2012–2023
- Exports, In Physical Terms, By Country, 2012–2023
- Exports, In Value Terms, By Country, 2012–2023
- Export Prices, By Country Of Origin, 2012–2023
-
LIST OF FIGURES
- Market Volume, In Physical Terms, 2012–2023
- Market Value, 2012–2023
- Consumption, By Country, 2023
- Market Volume Forecast to 2030
- Market Value Forecast to 2030
- Products: Market Size And Growth, By Type
- Products: Average Per Capita Consumption, By Type
- Products: Exports And Growth, By Type
- Products: Export Prices And Growth, By Type
- Production Volume And Growth
- Exports And Growth
- Export Prices And Growth
- Market Size And Growth
- Per Capita Consumption
- Imports And Growth
- Import Prices
- Production, In Physical Terms, 2012–2023
- Production, In Value Terms, 2012–2023
- Production, By Country, 2023
- Production, In Physical Terms, By Country, 2012–2023
- Imports, In Physical Terms, 2012–2023
- Imports, In Value Terms, 2012–2023
- Imports, In Physical Terms, By Country, 2023
- Imports, In Physical Terms, By Country, 2012–2023
- Imports, In Value Terms, By Country, 2012–2023
- Import Prices, By Country, 2012–2023
- Exports, In Physical Terms, 2012–2023
- Exports, In Value Terms, 2012–2023
- Exports, In Physical Terms, By Country, 2023
- Exports, In Physical Terms, By Country, 2012–2023
- Exports, In Value Terms, By Country, 2012–2023
- Export Prices, 2012–2023


