
World - Frozen Whole Chickens - Market Analysis, Forecast, Size, Trends And Insights
Get instant access to more than 2 million reports, dashboards, and datasets on the IndexBox Platform.
View PricingGlobal Frozen Whole Chicken Market: Projected Growth in Volume to 6.6M tons by 2030
IndexBox has just published a new report: World - Frozen Whole Chickens - Market Analysis, Forecast, Size, Trends And Insights.
The global frozen whole chicken market is poised for growth, with a forecasted CAGR of +0.8% in volume and +3.0% in value from 2023 to 2030. Market volume is projected to reach 6.6 million tons, while market value is expected to reach $15.1 billion by the end of 2030. This trend is driven by increasing demand for frozen whole chicken worldwide.
Market Forecast
Driven by rising demand for frozen whole chicken worldwide, the market is expected to start an upward consumption trend over the next seven-year period. The performance of the market is forecast to increase slightly, with an anticipated CAGR of +0.8% for the period from 2023 to 2030, which is projected to bring the market volume to 6.6M tons by the end of 2030.
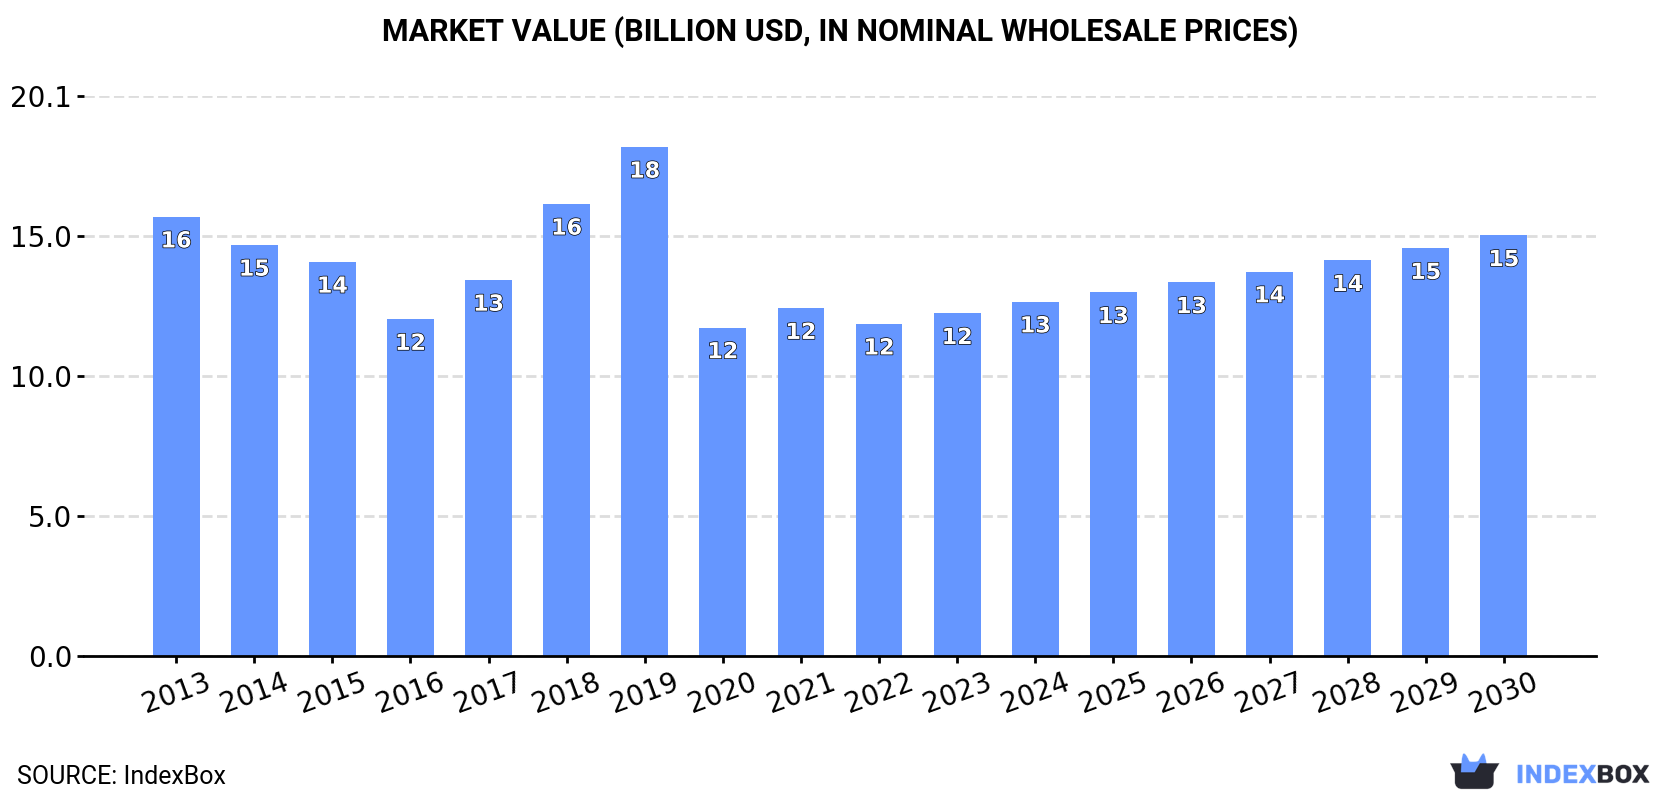
In value terms, the market is forecast to increase with an anticipated CAGR of +3.0% for the period from 2023 to 2030, which is projected to bring the market value to $15.1B (in nominal wholesale prices) by the end of 2030.
Consumption
World Consumption of Frozen Whole Chickens
In 2023, consumption of frozen whole chickens increased by 1% to 6.3M tons, rising for the second year in a row after four years of decline. Over the period under review, consumption, however, showed a noticeable downturn. The pace of growth was the most pronounced in 2017 with an increase of 3.3% against the previous year. Over the period under review, global consumption attained the peak volume at 8.2M tons in 2013; however, from 2014 to 2023, consumption failed to regain momentum.
The global frozen whole chicken market size rose to $12.3B in 2023, surging by 3.2% against the previous year. This figure reflects the total revenues of producers and importers (excluding logistics costs, retail marketing costs, and retailers' margins, which will be included in the final consumer price). Overall, consumption, however, showed a perceptible downturn. Global consumption peaked at $18.2B in 2019; however, from 2020 to 2023, consumption remained at a lower figure.
Consumption By Country
China (1.1M tons) remains the largest frozen whole chicken consuming country worldwide, accounting for 18% of total volume. Moreover, frozen whole chicken consumption in China exceeded the figures recorded by the second-largest consumer, India (387K tons), threefold. The third position in this ranking was held by Brazil (375K tons), with a 6% share.
In China, frozen whole chicken consumption plunged by an average annual rate of -3.0% over the period from 2013-2023. In the other countries, the average annual rates were as follows: India (-0.6% per year) and Brazil (+8.0% per year).
In value terms, China ($3.3B), Turkey ($1.7B) and India ($700M) constituted the countries with the highest levels of market value in 2023, with a combined 46% share of the global market.
In terms of the main consuming countries, Turkey, with a CAGR of +16.8%, recorded the highest rates of growth with regard to market size over the period under review, while market for the other global leaders experienced more modest paces of growth.
In 2023, the highest levels of frozen whole chicken per capita consumption was registered in Saint Lucia (629 kg per person), followed by the United Arab Emirates (20 kg per person), Saudi Arabia (5.4 kg per person) and Iraq (5 kg per person), while the world average per capita consumption of frozen whole chicken was estimated at 0.8 kg per person.
In Saint Lucia, frozen whole chicken per capita consumption declined by an average annual rate of -23.4% over the period from 2013-2023. In the other countries, the average annual rates were as follows: the United Arab Emirates (+2.1% per year) and Saudi Arabia (-12.6% per year).
Production
World Production of Frozen Whole Chickens
In 2023, approx. 6M tons of frozen whole chickens were produced worldwide; which is down by -5.8% against the previous year's figure. Overall, production continues to indicate a perceptible decrease. The pace of growth was the most pronounced in 2022 when the production volume increased by 6.6% against the previous year. Over the period under review, global production hit record highs at 8.3M tons in 2013; however, from 2014 to 2023, production remained at a lower figure. The general negative trend in terms output was largely conditioned by a perceptible descent of the number of producing animals and a relatively flat trend pattern in yield figures.
In value terms, frozen whole chicken production fell modestly to $12.1B in 2023 estimated in export price. Over the period under review, production showed a noticeable decrease. The most prominent rate of growth was recorded in 2018 when the production volume increased by 19%. Over the period under review, global production hit record highs at $17.6B in 2019; however, from 2020 to 2023, production stood at a somewhat lower figure.
Production By Country
The countries with the highest volumes of production in 2023 were Brazil (1.4M tons), China (1.1M tons) and India (389K tons), with a combined 49% share of global production. Turkey, the United States, Ukraine, Russia, Poland, France, Indonesia, Japan, Pakistan and Nigeria lagged somewhat behind, together accounting for a further 28%.
From 2013 to 2023, the biggest increases were recorded for Ukraine (with a CAGR of +6.1%), while production for the other global leaders experienced more modest paces of growth.
Imports
World Imports of Frozen Whole Chickens
After three years of decline, purchases abroad of frozen whole chickens increased by 17% to 2.2M tons in 2023. Over the period under review, imports, however, saw a relatively flat trend pattern. The pace of growth appeared the most rapid in 2019 when imports increased by 18% against the previous year. As a result, imports reached the peak of 2.5M tons. From 2020 to 2023, the growth of global imports remained at a somewhat lower figure.
In value terms, frozen whole chicken imports reached $3.4B in 2023. In general, imports, however, saw a perceptible contraction. The growth pace was the most rapid in 2019 with an increase of 16% against the previous year. Global imports peaked at $4.9B in 2013; however, from 2014 to 2023, imports failed to regain momentum.
Imports By Country
The purchases of the four major importers of frozen whole chickens, namely the United Arab Emirates, South Africa, Iraq and Saudi Arabia, represented more than third of total import. Yemen (122K tons) took a 5.4% share (based on physical terms) of total imports, which put it in second place, followed by Saint Lucia (5.2%). Kuwait (92K tons), Democratic Republic of the Congo (76K tons), Oman (73K tons), Libya (66K tons), Qatar (65K tons), Singapore (57K tons) and Egypt (51K tons) held a minor share of total imports.
From 2013 to 2023, the most notable rate of growth in terms of purchases, amongst the key importing countries, was attained by Democratic Republic of the Congo (with a CAGR of +10.8%), while imports for the other global leaders experienced more modest paces of growth.
In value terms, the largest frozen whole chicken importing markets worldwide were the United Arab Emirates ($398M), Saudi Arabia ($365M) and Iraq ($349M), with a combined 32% share of global imports. Yemen, Saint Lucia, Kuwait, Qatar, Oman, South Africa, Libya, Democratic Republic of the Congo, Egypt and Singapore lagged somewhat behind, together accounting for a further 38%.
Among the main importing countries, Democratic Republic of the Congo, with a CAGR of +9.5%, saw the highest rates of growth with regard to the value of imports, over the period under review, while purchases for the other global leaders experienced more modest paces of growth.
Import Prices By Country
In 2023, the average frozen whole chicken import price amounted to $1,532 per ton, reducing by -5.8% against the previous year. In general, the import price saw a noticeable decrease. The most prominent rate of growth was recorded in 2021 an increase of 14% against the previous year. Global import price peaked at $1,971 per ton in 2013; however, from 2014 to 2023, import prices stood at a somewhat lower figure.
Prices varied noticeably by country of destination: amid the top importers, the country with the highest price was Qatar ($1,963 per ton), while South Africa ($452 per ton) was amongst the lowest.
From 2013 to 2023, the most notable rate of growth in terms of prices was attained by Saint Lucia (+2.4%), while the other global leaders experienced a decline in the import price figures.
Exports
World Exports of Frozen Whole Chickens
In 2023, the amount of frozen whole chickens exported worldwide dropped to 2M tons, with a decrease of -5.5% compared with the previous year. Over the period under review, exports saw a perceptible descent. The most prominent rate of growth was recorded in 2019 when exports increased by 16%. The global exports peaked at 2.6M tons in 2013; however, from 2014 to 2023, the exports remained at a lower figure.
In value terms, frozen whole chicken exports reduced to $3.6B in 2023. In general, exports saw a noticeable setback. The most prominent rate of growth was recorded in 2021 when exports increased by 20%. Over the period under review, the global exports attained the peak figure at $4.9B in 2013; however, from 2014 to 2023, the exports failed to regain momentum.
Exports By Country
In 2023, Brazil (1.1M tons) was the largest exporter of frozen whole chickens, making up 53% of total exports. Turkey (256K tons) ranks second in terms of the total exports with a 13% share, followed by Ukraine (6.5%) and Poland (5.3%). France (85K tons), the United Arab Emirates (40K tons), South Korea (32K tons) and Spain (31K tons) followed a long way behind the leaders.
Exports from Brazil decreased at an average annual rate of -3.4% from 2013 to 2023. At the same time, Poland (+14.5%), the United Arab Emirates (+10.5%), South Korea (+8.3%), Ukraine (+7.7%), Spain (+2.3%) and Turkey (+1.4%) displayed positive paces of growth. Moreover, Poland emerged as the fastest-growing exporter exported in the world, with a CAGR of +14.5% from 2013-2023. By contrast, France (-10.1%) illustrated a downward trend over the same period. While the share of Turkey (+4.3 p.p.), Poland (+4.3 p.p.) and Ukraine (+4.1 p.p.) increased significantly in terms of the global exports from 2013-2023, the share of Brazil (-4.2 p.p.) and France (-5.2 p.p.) displayed negative dynamics. The shares of the other countries remained relatively stable throughout the analyzed period.
In value terms, Brazil ($2B) remains the largest frozen whole chicken supplier worldwide, comprising 55% of global exports. The second position in the ranking was held by Turkey ($425M), with a 12% share of global exports. It was followed by Ukraine, with a 5.8% share.
From 2013 to 2023, the average annual rate of growth in terms of value in Brazil amounted to -3.5%. The remaining exporting countries recorded the following average annual rates of exports growth: Turkey (+0.1% per year) and Ukraine (+8.6% per year).
Export Prices By Country
The average frozen whole chicken export price stood at $1,792 per ton in 2023, stabilizing at the previous year. In general, the export price continues to indicate a relatively flat trend pattern. The growth pace was the most rapid in 2021 when the average export price increased by 21%. The global export price peaked at $1,903 per ton in 2013; however, from 2014 to 2023, the export prices remained at a lower figure.
There were significant differences in the average prices amongst the major exporting countries. In 2023, amid the top suppliers, the country with the highest price was France ($2,095 per ton), while South Korea ($1,337 per ton) was amongst the lowest.
From 2013 to 2023, the most notable rate of growth in terms of prices was attained by South Korea (+1.7%), while the other global leaders experienced more modest paces of growth.
This report provides an in-depth analysis of the global frozen whole chicken market. Within it, you will discover the latest data on market trends and opportunities by country, consumption, production and price developments, as well as the global trade (imports and exports). The forecast exhibits the market prospects through 2030.
Product coverage:
- Prodcom 10122013 - Frozen whole chickens
Country coverage:
Worldwide - the report contains statistical data for 200 countries and includes detailed profiles of the 50 largest consuming countries:
- USA
- China
- Japan
- Germany
- United Kingdom
- France
- Brazil
- Italy
- Russian Federation
- India
- Canada
- Australia
- Republic of Korea
- Spain
- Mexico
- Indonesia
- Netherlands
- Turkey
- Saudi Arabia
- Switzerland
- Sweden
- Nigeria
- Poland
- Belgium
- Argentina
- Norway
- Austria
- Thailand
- United Arab Emirates
- Colombia
- Denmark
- South Africa
- Malaysia
- Israel
- Singapore
- Egypt
- Philippines
- Finland
- Chile
- Ireland
- Pakistan
- Greece
- Portugal
- Kazakhstan
- Algeria
- Czech Republic
- Qatar
- Peru
- Romania
- Vietnam
+ the largest producing countries
Data coverage:
- Global market volume and value
- Per Capita consumption
- Forecast of the market dynamics in the medium term
- Global production, split by region and country
- Global trade (exports and imports)
- Export and import prices
- Market trends, drivers and restraints
- Key market players and their profiles
Reasons to buy this report:
- Take advantage of the latest data
- Find deeper insights into current market developments
- Discover vital success factors affecting the market
This report is designed for manufacturers, distributors, importers, and wholesalers, as well as for investors, consultants and advisors.
In this report, you can find information that helps you to make informed decisions on the following issues:
- How to diversify your business and benefit from new market opportunities
- How to load your idle production capacity
- How to boost your sales on overseas markets
- How to increase your profit margins
- How to make your supply chain more sustainable
- How to reduce your production and supply chain costs
- How to outsource production to other countries
- How to prepare your business for global expansion
While doing this research, we combine the accumulated expertise of our analysts and the capabilities of artificial intelligence. The AI-based platform, developed by our data scientists, constitutes the key working tool for business analysts, empowering them to discover deep insights and ideas from the marketing data.
-
1. INTRODUCTION
Making Data-Driven Decisions to Grow Your Business
- REPORT DESCRIPTION
- RESEARCH METHODOLOGY AND AI PLATFORM
- DATA-DRIVEN DECISIONS FOR YOUR BUSINESS
- GLOSSARY AND SPECIFIC TERMS
-
2. EXECUTIVE SUMMARY
A Quick Overview of Market Performance
- KEY FINDINGS
- MARKET TRENDS This Chapter is Available Only for the Professional Edition PRO
-
3. MARKET OVERVIEW
Understanding the Current State of The Market and Its Prospects
- MARKET SIZE
- CONSUMPTION BY COUNTRY
- MARKET FORECAST TO 2030
-
4. MOST PROMISING PRODUCT
Finding New Products to Diversify Your Business
This Chapter is Available Only for the Professional Edition PRO- TOP PRODUCTS TO DIVERSIFY YOUR BUSINESS
- BEST-SELLING PRODUCTS
- MOST CONSUMED PRODUCT
- MOST TRADED PRODUCT
- MOST PROFITABLE PRODUCT FOR EXPORT
-
5. MOST PROMISING SUPPLYING COUNTRIES
Choosing the Best Countries to Establish Your Sustainable Supply Chain
This Chapter is Available Only for the Professional Edition PRO- TOP COUNTRIES TO SOURCE YOUR PRODUCT
- TOP PRODUCING COUNTRIES
- COUNTRIES WITH TOP YIELDS
- TOP EXPORTING COUNTRIES
- LOW-COST EXPORTING COUNTRIES
-
6. MOST PROMISING OVERSEAS MARKETS
Choosing the Best Countries to Boost Your Exports
This Chapter is Available Only for the Professional Edition PRO- TOP OVERSEAS MARKETS FOR EXPORTING YOUR PRODUCT
- TOP CONSUMING MARKETS
- UNSATURATED MARKETS
- TOP IMPORTING MARKETS
- MOST PROFITABLE MARKETS
7. GLOBAL PRODUCTION
The Latest Trends and Insights into The Industry
- PRODUCTION VOLUME AND VALUE
- PRODUCTION BY COUNTRY
- PRODUCING ANIMALS AND YIELD BY COUNTRY
8. GLOBAL IMPORTS
The Largest Importers on The Market and How They Succeed
- IMPORTS FROM 2012–2023
- IMPORTS BY COUNTRY
- IMPORT PRICES BY COUNTRY
9. GLOBAL EXPORTS
The Largest Exporters on The Market and How They Succeed
- EXPORTS FROM 2012–2023
- EXPORTS BY COUNTRY
- EXPORT PRICES BY COUNTRY
-
10. PROFILES OF MAJOR PRODUCERS
The Largest Producers on The Market and Their Profiles
This Chapter is Available Only for the Professional Edition PRO -
11. COUNTRY PROFILES
The Largest Markets And Their Profiles
This Chapter is Available Only for the Professional Edition PRO- United States
- China
- Japan
- Germany
- United Kingdom
- France
- Brazil
- Italy
- Russian Federation
- India
- Canada
- Australia
- Republic of Korea
- Spain
- Mexico
- Indonesia
- Netherlands
- Turkey
- Saudi Arabia
- Switzerland
- Sweden
- Nigeria
- Poland
- Belgium
- Argentina
- Norway
- Austria
- Thailand
- United Arab Emirates
- Colombia
- Denmark
- South Africa
- Malaysia
- Israel
- Singapore
- Egypt
- Philippines
- Finland
- Chile
- Ireland
- Pakistan
- Greece
- Portugal
- Kazakhstan
- Algeria
- Czech Republic
- Qatar
- Peru
- Romania
- Vietnam
-
LIST OF TABLES
- Key Findings In 2023
- Market Volume, In Physical Terms, 2012–2023
- Market Value, 2012–2023
- Per Capita Consumption, By Country, 2018–2023
- Production, In Physical Terms, By Country, 2012–2023
- Producing Animals, By Country, 2012-2023
- Yield, By Country, 2012-2023
- Imports, In Physical Terms, By Country, 2012–2023
- Imports, In Value Terms, By Country, 2012–2023
- Import Prices, By Country Of Destination, 2012–2023
- Exports, In Physical Terms, By Country, 2012–2023
- Exports, In Value Terms, By Country, 2012–2023
- Export Prices, By Country Of Origin, 2012–2023
-
LIST OF FIGURES
- Market Volume, In Physical Terms, 2012–2023
- Market Value, 2012–2023
- Consumption, By Country, 2023
- Market Volume Forecast to 2030
- Market Value Forecast to 2030
- Products: Market Size And Growth, By Type
- Products: Average Per Capita Consumption, By Type
- Products: Exports And Growth, By Type
- Products: Export Prices And Growth, By Type
- Production Volume And Growth
- Yield And Growth
- Exports And Growth
- Export Prices And Growth
- Market Size And Growth
- Per Capita Consumption
- Imports And Growth
- Import Prices
- Production, In Physical Terms, 2012–2023
- Production, In Value Terms, 2012–2023
- Producing Animals, 2012–2023
- Yield, 2012–2023
- Production, By Country, 2023
- Production, In Physical Terms, By Country, 2012–2023
- Producing Animals, By Country, 2023
- Producing Animals, By Country, 2012-2023
- Yield, By Country, 2012-2023
- Imports, In Physical Terms, 2012–2023
- Imports, In Value Terms, 2012–2023
- Imports, In Physical Terms, By Country, 2023
- Imports, In Physical Terms, By Country, 2012–2023
- Imports, In Value Terms, By Country, 2012–2023
- Import Prices, By Country, 2012–2023
- Exports, In Physical Terms, 2012–2023
- Exports, In Value Terms, 2012–2023
- Exports, In Physical Terms, By Country, 2023
- Exports, In Physical Terms, By Country, 2012–2023
- Exports, In Value Terms, By Country, 2012–2023
- Export Prices, 2012–2023


