
Germany - Bed Linen - Market Analysis, Forecast, Size, Trends And Insights
Get instant access to more than 2 million reports, dashboards, and datasets on the IndexBox Platform.
View PricingGermany's Bed Linen Imports Fall 17% to $1.1 Billion in 2023
Germany Bed Linen Imports
In 2023, supplies from abroad of bed linen decreased by -15.4% to 112K tons, falling for the second year in a row after two years of growth. In general, imports, however, recorded a relatively flat trend pattern. The pace of growth was the most pronounced in 2021 with an increase of 12% against the previous year. As a result, imports attained the peak of 137K tons. From 2022 to 2023, the growth of imports remained at a somewhat lower figure.
In value terms, bed linen imports shrank remarkably to $1.1B (IndexBox estimates) in 2023. Over the period under review, imports, however, continue to indicate a relatively flat trend pattern. The most prominent rate of growth was recorded in 2021 with an increase of 17% against the previous year. Imports peaked at $1.3B in 2022, and then declined significantly in the following year.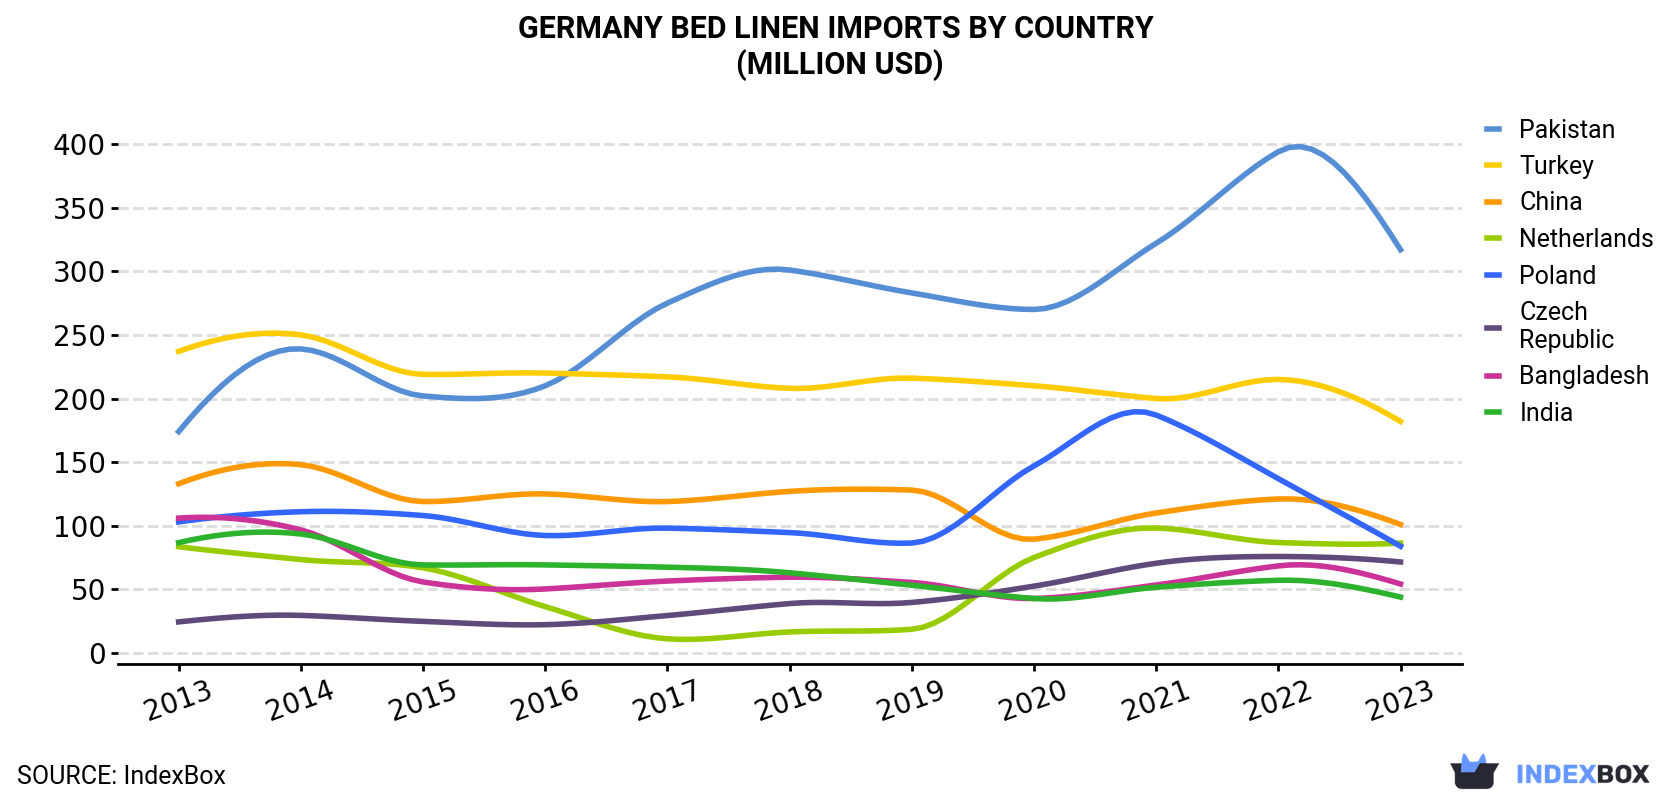
| COUNTRY | Import Value of Bed Linen in Germany (million USD) | ||||||||||
|---|---|---|---|---|---|---|---|---|---|---|---|
| 2013 | 2014 | 2015 | 2016 | 2017 | 2018 | 2019 | 2020 | 2021 | 2022 | 2023 | |
| Pakistan | 174 | 239 | 202 | 210 | 275 | 301 | 283 | 270 | 322 | 394 | 317 |
| Turkey | 237 | 250 | 219 | 220 | 217 | 208 | 216 | 210 | 200 | 215 | 182 |
| China | 133 | 148 | 119 | 125 | 119 | 127 | 128 | 89.4 | 110 | 121 | 101 |
| Netherlands | 83.5 | 73.4 | 66.9 | 36.4 | 11.1 | 16.5 | 18.6 | 75.0 | 98.2 | 86.8 | 86.3 |
| Poland | 103 | 111 | 108 | 92.3 | 98.1 | 94.6 | 86.4 | 147 | 187 | 137 | 83.9 |
| Czech Republic | 24.4 | 29.5 | 24.8 | 22.2 | 29.4 | 38.8 | 39.7 | 52.5 | 70.5 | 75.8 | 71.5 |
| Bangladesh | 106 | 96.7 | 55.8 | 50.3 | 56.5 | 59.5 | 55.4 | 42.8 | 53.4 | 68.4 | 54.2 |
| India | 86.7 | 93.5 | 69.2 | 69.2 | 67.4 | 63.0 | 53.2 | 42.8 | 51.6 | 57.1 | 43.9 |
| Others | 124 | 145 | 123 | 121 | 129 | 135 | 125 | 116 | 134 | 142 | 140 |
| Total | 1,073 | 1,186 | 988 | 946 | 1,002 | 1,042 | 1,005 | 1,045 | 1,226 | 1,297 | 1,079 |
Imports by Country
In 2023, Pakistan (42K tons) constituted the largest bed linen supplier to Germany, with a 38% share of total imports. Moreover, bed linen imports from Pakistan exceeded the figures recorded by the second-largest supplier, Turkey (17K tons), twofold. China (14K tons) ranked third in terms of total imports with a 12% share.
From 2013 to 2023, the average annual growth rate of volume from Pakistan stood at +7.5%. The remaining supplying countries recorded the following average annual rates of imports growth: Turkey (-2.6% per year) and China (+0.7% per year).
In value terms, the largest bed linen suppliers to Germany were Pakistan ($317M), Turkey ($182M) and China ($101M), with a combined 56% share of total imports. the Netherlands, Poland, the Czech Republic, Bangladesh and India lagged somewhat behind, together comprising a further 31%.
In terms of the main suppliers, the Czech Republic, with a CAGR of +11.3%, saw the highest growth rate of the value of imports, over the period under review, while purchases for the other leaders experienced more modest paces of growth.
Imports by Type
Bed linen of cotton (62K tons), bed linen of knitted or crocheted textiles (34K tons) and bed linen of other woven textiles and non-woven man-made fibres (16K tons) were the main products of bed linen imports to Germany.
From 2013 to 2023, the most notable rate of growth in terms of purchases, amongst the major product types, was attained by bed linen of knitted or crocheted textiles (with a CAGR of +1.5%), while imports for the other products experienced mixed trend patterns.
In value terms, bed linen of cotton ($652M) constituted the largest type of bed linen supplied to Germany, comprising 60% of total imports. The second position in the ranking was taken by bed linen of knitted or crocheted textiles ($295M), with a 27% share of total imports.
Import Prices by Country
In 2023, the bed linen price stood at $9,677 per ton (CIF, Germany), falling by -1.6% against the previous year. Over the period under review, the import price saw a relatively flat trend pattern. The pace of growth appeared the most rapid in 2022 when the average import price increased by 9.7% against the previous year. Over the period under review, average import prices attained the peak figure at $10,056 per ton in 2014; however, from 2015 to 2023, import prices stood at a somewhat lower figure.
Prices varied noticeably by country of origin: amid the top importers, the country with the highest price was Poland ($15,308 per ton), while the price for China ($7,270 per ton) was amongst the lowest.
From 2013 to 2023, the most notable rate of growth in terms of prices was attained by Poland (+3.0%), while the prices for the other major suppliers experienced more modest paces of growth.
This report provides an in-depth analysis of the bed linen market in Germany. Within it, you will discover the latest data on market trends and opportunities by country, consumption, production and price developments, as well as the global trade (imports and exports). The forecast exhibits the market prospects through 2030.
Product coverage:
- Prodcom 13921230 - Bed linen of knitted or crocheted textiles
- Prodcom 13921253 - Bed linen of cotton (excluding knitted or crocheted)
- Prodcom 13921255 - Bed linen of flax or ramie (excluding knitted or crocheted)
- Prodcom 13921259 - Bed linen of woven textiles (excluding of cotton, of flax or ramie)
- Prodcom 13921270 - Bed linen of non-woven man-made fibres (excluding knitted or crocheted)
Country coverage:
- Germany
Data coverage:
- Market volume and value
- Per Capita consumption
- Forecast of the market dynamics in the medium term
- Trade (exports and imports) in Germany
- Export and import prices
- Market trends, drivers and restraints
- Key market players and their profiles
Reasons to buy this report:
- Take advantage of the latest data
- Find deeper insights into current market developments
- Discover vital success factors affecting the market
This report is designed for manufacturers, distributors, importers, and wholesalers, as well as for investors, consultants and advisors.
In this report, you can find information that helps you to make informed decisions on the following issues:
- How to diversify your business and benefit from new market opportunities
- How to load your idle production capacity
- How to boost your sales on overseas markets
- How to increase your profit margins
- How to make your supply chain more sustainable
- How to reduce your production and supply chain costs
- How to outsource production to other countries
- How to prepare your business for global expansion
While doing this research, we combine the accumulated expertise of our analysts and the capabilities of artificial intelligence. The AI-based platform, developed by our data scientists, constitutes the key working tool for business analysts, empowering them to discover deep insights and ideas from the marketing data.
-
1. INTRODUCTION
Making Data-Driven Decisions to Grow Your Business
- REPORT DESCRIPTION
- RESEARCH METHODOLOGY AND AI PLATFORM
- DATA-DRIVEN DECISIONS FOR YOUR BUSINESS
- GLOSSARY AND SPECIFIC TERMS
-
2. EXECUTIVE SUMMARY
A Quick Overview of Market Performance
- KEY FINDINGS
- MARKET TRENDS This Chapter is Available Only for the Professional Edition PRO
-
3. MARKET OVERVIEW
Understanding the Current State of The Market and Its Prospects
- MARKET SIZE
- MARKET STRUCTURE
- TRADE BALANCE
- PER CAPITA CONSUMPTION
- MARKET FORECAST TO 2030
-
4. MOST PROMISING PRODUCT
Finding New Products to Diversify Your Business
This Chapter is Available Only for the Professional Edition PRO- TOP PRODUCTS TO DIVERSIFY YOUR BUSINESS
- BEST-SELLING PRODUCTS
- MOST CONSUMED PRODUCT
- MOST TRADED PRODUCT
- MOST PROFITABLE PRODUCT FOR EXPORT
-
5. MOST PROMISING SUPPLYING COUNTRIES
Choosing the Best Countries to Establish Your Sustainable Supply Chain
This Chapter is Available Only for the Professional Edition PRO- TOP COUNTRIES TO SOURCE YOUR PRODUCT
- TOP PRODUCING COUNTRIES
- TOP EXPORTING COUNTRIES
- LOW-COST EXPORTING COUNTRIES
-
6. MOST PROMISING OVERSEAS MARKETS
Choosing the Best Countries to Boost Your Exports
This Chapter is Available Only for the Professional Edition PRO- TOP OVERSEAS MARKETS FOR EXPORTING YOUR PRODUCT
- TOP CONSUMING MARKETS
- UNSATURATED MARKETS
- TOP IMPORTING MARKETS
- MOST PROFITABLE MARKETS
7. PRODUCTION
The Latest Trends and Insights into The Industry
- PRODUCTION VOLUME AND VALUE
8. IMPORTS
The Largest Import Supplying Countries
- IMPORTS FROM 2012–2023
- IMPORTS BY COUNTRY
- IMPORT PRICES BY COUNTRY
9. EXPORTS
The Largest Destinations for Exports
- EXPORTS FROM 2012–2023
- EXPORTS BY COUNTRY
- EXPORT PRICES BY COUNTRY
-
10. PROFILES OF MAJOR PRODUCERS
The Largest Producers on The Market and Their Profiles
This Chapter is Available Only for the Professional Edition PRO -
LIST OF TABLES
- Key Findings In 2023
- Market Volume, In Physical Terms, 2012–2023
- Market Value, 2012–2023
- Per Capita Consumption In 2012-2023
- Imports, In Physical Terms, By Country, 2012–2023
- Imports, In Value Terms, By Country, 2012–2023
- Import Prices, By Country Of Origin, 2012–2023
- Exports, In Physical Terms, By Country, 2012–2023
- Exports, In Value Terms, By Country, 2012–2023
- Export Prices, By Country Of Destination, 2012–2023
-
LIST OF FIGURES
- Market Volume, In Physical Terms, 2012–2023
- Market Value, 2012–2023
- Market Structure – Domestic Supply vs. Imports, In Physical Terms, 2012-2023
- Market Structure – Domestic Supply vs. Imports, In Value Terms, 2012-2023
- Trade Balance, In Physical Terms, 2012-2023
- Trade Balance, In Value Terms, 2012-2023
- Per Capita Consumption, 2012-2023
- Market Volume Forecast to 2030
- Market Value Forecast to 2030
- Products: Market Size And Growth, By Type
- Products: Average Per Capita Consumption, By Type
- Products: Exports And Growth, By Type
- Products: Export Prices And Growth, By Type
- Production Volume And Growth
- Exports And Growth
- Export Prices And Growth
- Market Size And Growth
- Per Capita Consumption
- Imports And Growth
- Import Prices
- Production, In Physical Terms, 2012–2023
- Production, In Value Terms, 2012–2023
- Imports, In Physical Terms, 2012–2023
- Imports, In Value Terms, 2012–2023
- Imports, In Physical Terms, By Country, 2023
- Imports, In Physical Terms, By Country, 2012–2023
- Imports, In Value Terms, By Country, 2012–2023
- Import Prices, By Country Of Origin, 2012–2023
- Exports, In Physical Terms, 2012–2023
- Exports, In Value Terms, 2012–2023
- Exports, In Physical Terms, By Country, 2023
- Exports, In Physical Terms, By Country, 2012–2023
- Exports, In Value Terms, By Country, 2012–2023
- Export Prices, By Country Of Destination, 2012–2023


