
Germany - Folding Boxboard - Market Analysis, Forecast, Size, Trends and Insights
Get instant access to more than 2 million reports, dashboards, and datasets on the IndexBox Platform.
View PricingGermany's 2023 Folding Boxboard Exports Decline by 5% to $3 Billion
Germany Folding Boxboard Exports
In 2023, exports of folding boxboard from Germany contracted to 1.8M tons, with a decrease of -11.9% against the year before. In general, exports continue to indicate a relatively flat trend pattern. The pace of growth was the most pronounced in 2021 when exports increased by 8.5%. As a result, the exports reached the peak of 2.1M tons. From 2022 to 2023, the growth of the exports remained at a somewhat lower figure.
In value terms, folding boxboard exports fell to $3B (IndexBox estimates) in 2023. Overall, exports, however, showed a relatively flat trend pattern. The pace of growth was the most pronounced in 2021 with an increase of 20%. Over the period under review, the exports hit record highs at $3.2B in 2022, and then fell in the following year.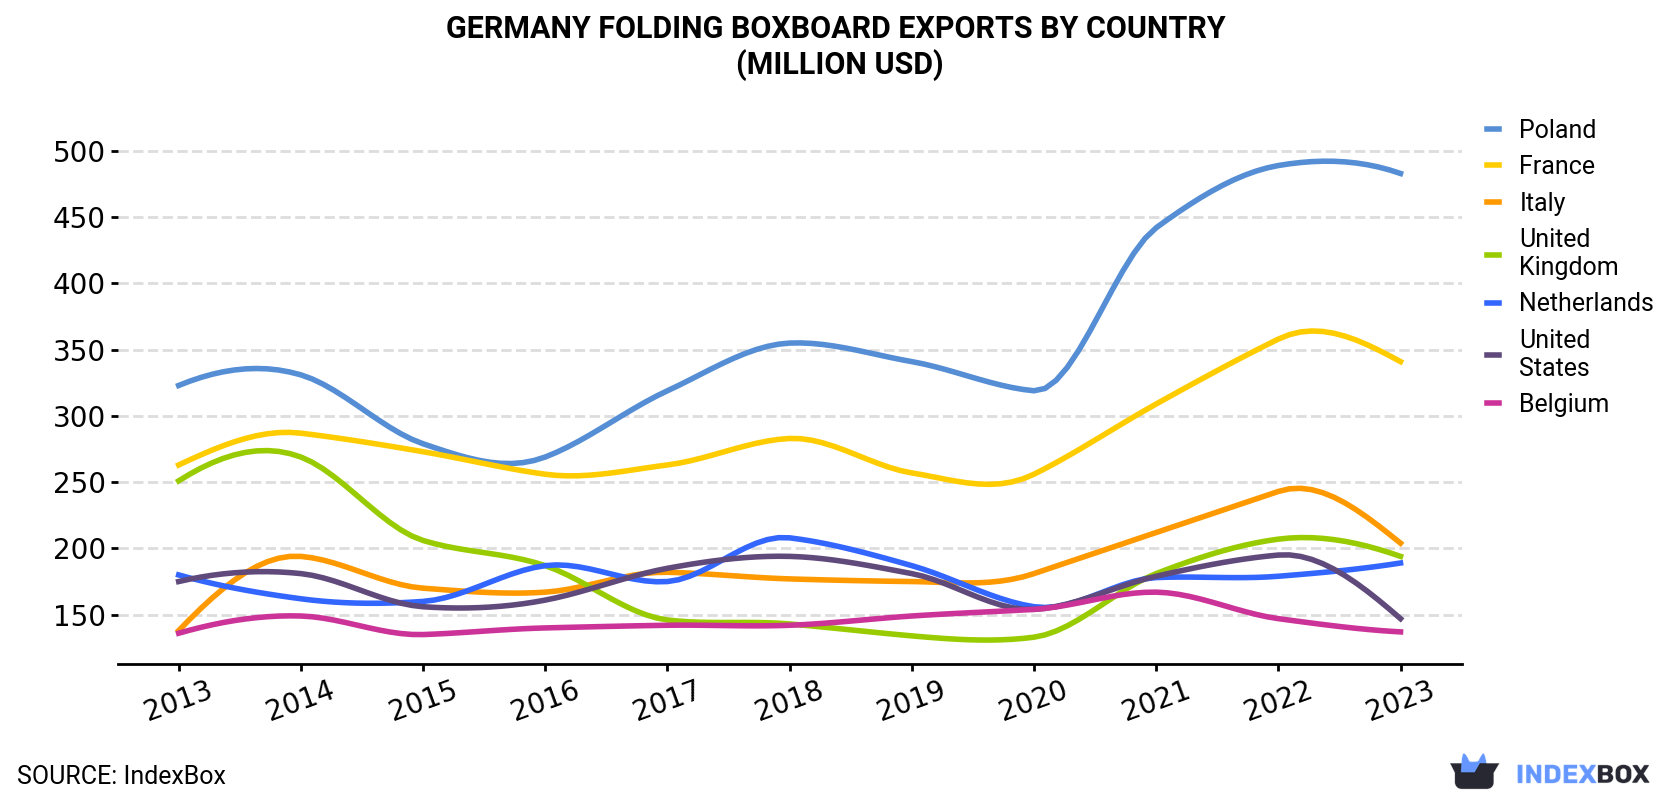
| COUNTRY | Export Value of Folding Boxboard in Germany (million USD) | ||||||||||
|---|---|---|---|---|---|---|---|---|---|---|---|
| 2013 | 2014 | 2015 | 2016 | 2017 | 2018 | 2019 | 2020 | 2021 | 2022 | 2023 | |
| Poland | 323 | 331 | 279 | 269 | 319 | 355 | 341 | 319 | 442 | 489 | 483 |
| France | 263 | 287 | 273 | 256 | 263 | 283 | 257 | 256 | 309 | 358 | 341 |
| Italy | 138 | 194 | 170 | 167 | 182 | 177 | 175 | 181 | 212 | 243 | 204 |
| United Kingdom | 251 | 269 | 206 | 187 | 146 | 143 | 134 | 133 | 181 | 207 | 194 |
| Netherlands | 180 | 162 | 160 | 187 | 175 | 208 | 187 | 156 | 178 | 179 | 189 |
| United States | 175 | 181 | 156 | 161 | 185 | 194 | 181 | 154 | 179 | 195 | 147 |
| Belgium | 136 | 149 | 135 | 140 | 142 | 142 | 149 | 154 | 167 | 147 | 137 |
| Others | 1,467 | 1,350 | 1,098 | 1,133 | 1,185 | 1,222 | 1,143 | 1,096 | 1,277 | 1,341 | 1,299 |
| Total | 2,933 | 2,923 | 2,477 | 2,500 | 2,598 | 2,724 | 2,568 | 2,449 | 2,946 | 3,158 | 2,994 |
Exports by Country
Poland (302K tons), France (256K tons) and the Netherlands (126K tons) were the main destinations of folding boxboard exports from Germany, with a combined 38% share of total exports. Italy, the UK, Belgium and the United States lagged somewhat behind, together comprising a further 20%.
From 2013 to 2023, the biggest increases were recorded for Italy (with a CAGR of +3.3%), while shipments for the other leaders experienced more modest paces of growth.
In value terms, Poland ($483M), France ($341M) and Italy ($204M) appeared to be the largest markets for folding boxboard exported from Germany worldwide, with a combined 34% share of total exports.
Among the main countries of destination, Poland, with a CAGR of +4.1%, recorded the highest growth rate of the value of exports, over the period under review, while shipments for the other leaders experienced more modest paces of growth.
Exports by Type
Paper and paperboard; multi-ply, coated with kaolin or other inorganic substances only, for non-graphic purposes, n.e.c. in heading no. 4810, in rolls or sheets (812K tons), paper and paperboard; uncoated, weight more than 150g/m2 but less than 225 g/m2, in rolls or sheets, n.e.c. in heading no. 4805 (458K tons) and paper and paperboard, surface-coloured, surface-decorated or printed, coated, impregnated or covered with artificial resins or plastics, in rolls or in square or rectangular sheets, of any size (excluding bleached and weighing > 150 g/m, and adhesives) (379K tons) were the main products of folding boxboard exports from Germany, together accounting for 93% of total exports. Paper and paperboard, surface-coloured, surface-decorated or printed, coated, impregnated or covered with artificial resins or plastics, in rolls or in square or rectangular sheets, of any size, bleached and weighing > 150 g/m , kraft paper and paperboard; uncoated, unbleached, weight 225g/m2 or more, in rolls or sheets, other than that of heading no. 4802 or 4803, kraft paper and paperboard, bleached uniformly throughout the mass and containing > 95% chemically processed wood fibres by weight in relation to the total fibre content, coated on one or both sides with kaolin or other inorganic substances, in rolls or in square or rectangular sheets, of any size, weighing > 150 g/m , kraft paper and paperboard; uncoated, weight 225g/m2 or more, in rolls or sheets, n.e.s. in item no. 4804.5, other than that of heading no. 4802 or 4803, kraft paper and paperboard, coated on one or both sides with kaolin or other inorganic substances, in rolls or in square or rectangular sheets, of any size (excluding that for writing, printing or other graphic purposes; paper and paperboard bleached uniformly in the mass and containing > 95% chemically processed wood fibres by weight in relation to the total fibre content), kraft paper and paperboard; uncoated, weight between 150 and 225g/m2, bleached uniformly throughout, more than 95% of total fibre content consists of chemically processed wood fibres, in rolls or sheets, kraft paper and paperboard; uncoated, weight 225g/m2 or more, bleached uniformly throughout, more than 95% of total fibre content consists of chemically processed wood fibres, in rolls or sheets and kraft paper and paperboard; uncoated, weight more than 150g/m2 but less than 225g/m2, in rolls or sheets, n.e.s. in item no. 4804.4, other than that of heading no. 4802 or 4803 lagged somewhat behind, together comprising a further 7.4%.
From 2013 to 2023, the biggest increases were recorded for kraft paper and paperboard; uncoated, weight more than 150g/m2 but less than 225g/m2, in rolls or sheets, n.e.s. in item no. 4804.4, other than that of heading no. 4802 or 4803 (with a CAGR of +53.0%), while shipments for the other products experienced more modest paces of growth.
In value terms, paper and paperboard, surface-coloured, surface-decorated or printed, coated, impregnated or covered with artificial resins or plastics, in rolls or in square or rectangular sheets, of any size (excluding bleached and weighing > 150 g/m, and adhesives) ($1.4B), paper and paperboard; multi-ply, coated with kaolin or other inorganic substances only, for non-graphic purposes, n.e.c. in heading no. 4810, in rolls or sheets ($836M) and paper and paperboard, surface-coloured, surface-decorated or printed, coated, impregnated or covered with artificial resins or plastics, in rolls or in square or rectangular sheets, of any size, bleached and weighing > 150 g/m ($364M) appeared to be the most exported types of folding boxboard from Germany worldwide, with a combined 86% share of total exports. Paper and paperboard; uncoated, weight more than 150g/m2 but less than 225 g/m2, in rolls or sheets, n.e.c. in heading no. 4805, kraft paper and paperboard; uncoated, unbleached, weight 225g/m2 or more, in rolls or sheets, other than that of heading no. 4802 or 4803, kraft paper and paperboard, bleached uniformly throughout the mass and containing > 95% chemically processed wood fibres by weight in relation to the total fibre content, coated on one or both sides with kaolin or other inorganic substances, in rolls or in square or rectangular sheets, of any size, weighing > 150 g/m , kraft paper and paperboard, coated on one or both sides with kaolin or other inorganic substances, in rolls or in square or rectangular sheets, of any size (excluding that for writing, printing or other graphic purposes; paper and paperboard bleached uniformly in the mass and containing > 95% chemically processed wood fibres by weight in relation to the total fibre content), kraft paper and paperboard; uncoated, weight 225g/m2 or more, in rolls or sheets, n.e.s. in item no. 4804.5, other than that of heading no. 4802 or 4803, kraft paper and paperboard; uncoated, weight between 150 and 225g/m2, bleached uniformly throughout, more than 95% of total fibre content consists of chemically processed wood fibres, in rolls or sheets, kraft paper and paperboard; uncoated, weight 225g/m2 or more, bleached uniformly throughout, more than 95% of total fibre content consists of chemically processed wood fibres, in rolls or sheets and kraft paper and paperboard; uncoated, weight more than 150g/m2 but less than 225g/m2, in rolls or sheets, n.e.s. in item no. 4804.4, other than that of heading no. 4802 or 4803 lagged somewhat behind, together accounting for a further 14%.
Kraft paper and paperboard; uncoated, weight between 150 and 225g/m2, bleached uniformly throughout, more than 95% of total fibre content consists of chemically processed wood fibres, in rolls or sheets, with a CAGR of +49.8%, saw the highest growth rate of the value of exports, among the main product categories over the period under review, while shipments for the other products experienced more modest paces of growth.
Export Prices by Country
In 2023, the folding boxboard price amounted to $1,679 per ton (FOB, Germany), with an increase of 7.6% against the previous year. Over the period under review, the export price continues to indicate a relatively flat trend pattern. The pace of growth was the most pronounced in 2022 an increase of 14%. The export price peaked in 2023 and is expected to retain growth in the immediate term.
Prices varied noticeably by country of destination: amid the top suppliers, the country with the highest price was Russia ($7,108 per ton), while the average price for exports to France ($1,334 per ton) was amongst the lowest.
From 2013 to 2023, the most notable rate of growth in terms of prices was recorded for supplies to Russia (+9.8%), while the prices for the other major destinations experienced more modest paces of growth.
This report provides an in-depth analysis of the folding boxboard market in Germany. Within it, you will discover the latest data on market trends and opportunities by country, consumption, production and price developments, as well as the global trade (imports and exports). The forecast exhibits the market prospects through 2030.
Product coverage:
- FCL 1618 - Cartonboard
Country coverage:
- Germany
Data coverage:
- Market volume and value
- Per Capita consumption
- Forecast of the market dynamics in the medium term
- Trade (exports and imports) in Germany
- Export and import prices
- Market trends, drivers and restraints
- Key market players and their profiles
Reasons to buy this report:
- Take advantage of the latest data
- Find deeper insights into current market developments
- Discover vital success factors affecting the market
This report is designed for manufacturers, distributors, importers, and wholesalers, as well as for investors, consultants and advisors.
In this report, you can find information that helps you to make informed decisions on the following issues:
- How to diversify your business and benefit from new market opportunities
- How to load your idle production capacity
- How to boost your sales on overseas markets
- How to increase your profit margins
- How to make your supply chain more sustainable
- How to reduce your production and supply chain costs
- How to outsource production to other countries
- How to prepare your business for global expansion
While doing this research, we combine the accumulated expertise of our analysts and the capabilities of artificial intelligence. The AI-based platform, developed by our data scientists, constitutes the key working tool for business analysts, empowering them to discover deep insights and ideas from the marketing data.
-
1. INTRODUCTION
Making Data-Driven Decisions to Grow Your Business
- REPORT DESCRIPTION
- RESEARCH METHODOLOGY AND AI PLATFORM
- DATA-DRIVEN DECISIONS FOR YOUR BUSINESS
- GLOSSARY AND SPECIFIC TERMS
-
2. EXECUTIVE SUMMARY
A Quick Overview of Market Performance
- KEY FINDINGS
- MARKET TRENDS This Chapter is Available Only for the Professional Edition PRO
-
3. MARKET OVERVIEW
Understanding the Current State of The Market and Its Prospects
- MARKET SIZE
- MARKET STRUCTURE
- TRADE BALANCE
- PER CAPITA CONSUMPTION
- MARKET FORECAST TO 2030
-
4. MOST PROMISING PRODUCT
Finding New Products to Diversify Your Business
This Chapter is Available Only for the Professional Edition PRO- TOP PRODUCTS TO DIVERSIFY YOUR BUSINESS
- BEST-SELLING PRODUCTS
- MOST CONSUMED PRODUCT
- MOST TRADED PRODUCT
- MOST PROFITABLE PRODUCT FOR EXPORT
-
5. MOST PROMISING SUPPLYING COUNTRIES
Choosing the Best Countries to Establish Your Sustainable Supply Chain
This Chapter is Available Only for the Professional Edition PRO- TOP COUNTRIES TO SOURCE YOUR PRODUCT
- TOP PRODUCING COUNTRIES
- TOP EXPORTING COUNTRIES
- LOW-COST EXPORTING COUNTRIES
-
6. MOST PROMISING OVERSEAS MARKETS
Choosing the Best Countries to Boost Your Exports
This Chapter is Available Only for the Professional Edition PRO- TOP OVERSEAS MARKETS FOR EXPORTING YOUR PRODUCT
- TOP CONSUMING MARKETS
- UNSATURATED MARKETS
- TOP IMPORTING MARKETS
- MOST PROFITABLE MARKETS
7. PRODUCTION
The Latest Trends and Insights into The Industry
- PRODUCTION VOLUME AND VALUE
8. IMPORTS
The Largest Import Supplying Countries
- IMPORTS FROM 2012–2023
- IMPORTS BY COUNTRY
- IMPORT PRICES BY COUNTRY
9. EXPORTS
The Largest Destinations for Exports
- EXPORTS FROM 2012–2023
- EXPORTS BY COUNTRY
- EXPORT PRICES BY COUNTRY
-
10. PROFILES OF MAJOR PRODUCERS
The Largest Producers on The Market and Their Profiles
This Chapter is Available Only for the Professional Edition PRO -
LIST OF TABLES
- Key Findings In 2023
- Market Volume, In Physical Terms, 2012–2023
- Market Value, 2012–2023
- Per Capita Consumption In 2012-2023
- Imports, In Physical Terms, By Country, 2012–2023
- Imports, In Value Terms, By Country, 2012–2023
- Import Prices, By Country Of Origin, 2012–2023
- Exports, In Physical Terms, By Country, 2012–2023
- Exports, In Value Terms, By Country, 2012–2023
- Export Prices, By Country Of Destination, 2012–2023
-
LIST OF FIGURES
- Market Volume, In Physical Terms, 2012–2023
- Market Value, 2012–2023
- Market Structure – Domestic Supply vs. Imports, In Physical Terms, 2012-2023
- Market Structure – Domestic Supply vs. Imports, In Value Terms, 2012-2023
- Trade Balance, In Physical Terms, 2012-2023
- Trade Balance, In Value Terms, 2012-2023
- Per Capita Consumption, 2012-2023
- Market Volume Forecast to 2030
- Market Value Forecast to 2030
- Products: Market Size And Growth, By Type
- Products: Average Per Capita Consumption, By Type
- Products: Exports And Growth, By Type
- Products: Export Prices And Growth, By Type
- Production Volume And Growth
- Exports And Growth
- Export Prices And Growth
- Market Size And Growth
- Per Capita Consumption
- Imports And Growth
- Import Prices
- Production, In Physical Terms, 2012–2023
- Production, In Value Terms, 2012–2023
- Imports, In Physical Terms, 2012–2023
- Imports, In Value Terms, 2012–2023
- Imports, In Physical Terms, By Country, 2023
- Imports, In Physical Terms, By Country, 2012–2023
- Imports, In Value Terms, By Country, 2012–2023
- Import Prices, By Country Of Origin, 2012–2023
- Exports, In Physical Terms, 2012–2023
- Exports, In Value Terms, 2012–2023
- Exports, In Physical Terms, By Country, 2023
- Exports, In Physical Terms, By Country, 2012–2023
- Exports, In Value Terms, By Country, 2012–2023
- Export Prices, By Country Of Destination, 2012–2023


