
Germany - MDF - Market Analysis, Forecast, Size, Trends and Insights
Get instant access to more than 2 million reports, dashboards, and datasets on the IndexBox Platform.
View PricingGermany's MDF Export Declines Significantly to $1.1B in 2023
Germany MDF Exports
In 2023, the amount of MDF exported from Germany dropped to 1.5M cubic meters, waning by -7.9% on the previous year's figure. The total export volume increased at an average annual rate of +1.1% over the period from 2013 to 2023; the trend pattern remained relatively stable, with only minor fluctuations being observed in certain years. The pace of growth was the most pronounced in 2019 when exports increased by 15%. The exports peaked at 1.8M cubic meters in 2021; however, from 2022 to 2023, the exports stood at a somewhat lower figure.
In value terms, MDF exports reduced to $1.1B (IndexBox estimates) in 2023. In general, total exports indicated a tangible increase from 2013 to 2023: its value increased at an average annual rate of +3.7% over the last decade. The trend pattern, however, indicated some noticeable fluctuations being recorded throughout the analyzed period. The most prominent rate of growth was recorded in 2021 when exports increased by 21% against the previous year. The exports peaked at $1.2B in 2022, and then declined in the following year.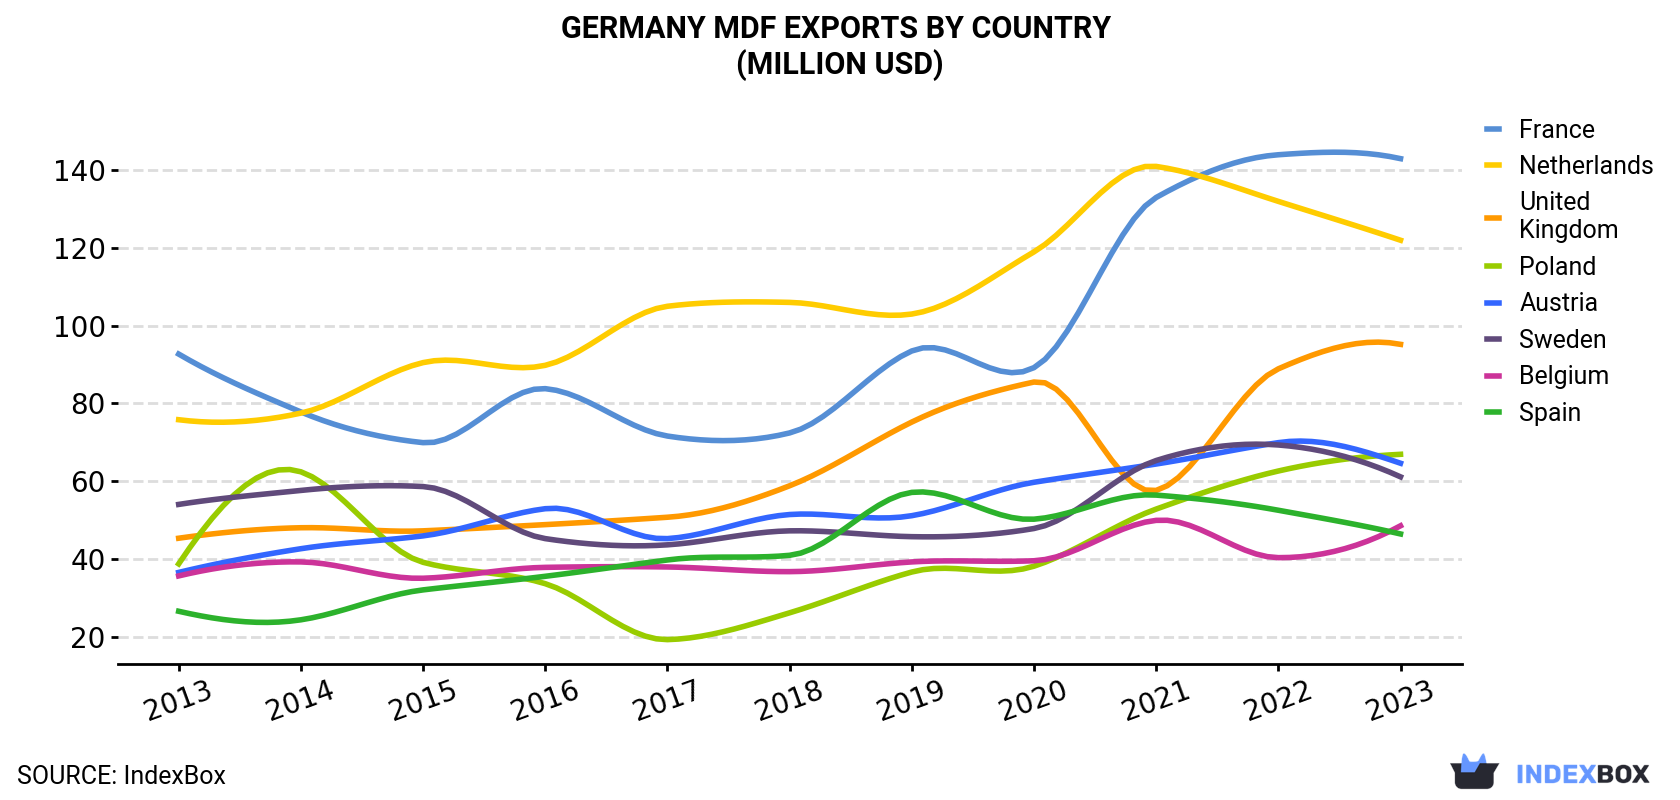
| COUNTRY | Export Value of MDF in Germany (million USD) | ||||||||||
|---|---|---|---|---|---|---|---|---|---|---|---|
| 2013 | 2014 | 2015 | 2016 | 2017 | 2018 | 2019 | 2020 | 2021 | 2022 | 2023 | |
| France | 92.7 | 77.8 | 69.9 | 83.8 | 71.6 | 72.4 | 93.5 | 89.2 | 133 | 144 | 143 |
| Netherlands | 75.8 | 77.5 | 90.5 | 89.8 | 105 | 106 | 103 | 119 | 141 | 132 | 122 |
| United Kingdom | 45.3 | 48.0 | 47.2 | 48.8 | 50.7 | 58.8 | 75.2 | 85.5 | 57.6 | 88.9 | 95.2 |
| Poland | 38.7 | 62.4 | 39.1 | 33.6 | 19.2 | 26.1 | 36.6 | 38.1 | 52.8 | 62.6 | 66.9 |
| Austria | 36.5 | 42.6 | 45.9 | 52.9 | 45.2 | 51.4 | 51.1 | 59.7 | 64.4 | 69.9 | 64.6 |
| Sweden | 54.0 | 57.6 | 58.6 | 45.2 | 43.6 | 47.2 | 45.7 | 47.8 | 65.3 | 69.3 | 61.1 |
| Belgium | 35.6 | 39.2 | 35.0 | 37.8 | 37.9 | 36.7 | 39.2 | 39.5 | 49.9 | 40.3 | 48.5 |
| Spain | 26.5 | 24.3 | 32.0 | 35.5 | 39.7 | 40.9 | 57.1 | 50.2 | 56.4 | 52.5 | 46.4 |
| Others | 357 | 370 | 327 | 353 | 370 | 414 | 443 | 398 | 504 | 494 | 446 |
| Total | 762 | 799 | 745 | 781 | 782 | 854 | 943 | 926 | 1,124 | 1,152 | 1,094 |
Exports by Country
the Netherlands (184K cubic meters), France (161K cubic meters) and the UK (125K cubic meters) were the main destinations of MDF exports from Germany, together accounting for 32% of total exports.
From 2013 to 2023, the most notable rate of growth in terms of shipments, amongst the main countries of destination, was attained by the UK (with a CAGR of +4.9%), while the other leaders experienced more modest paces of growth.
In value terms, France ($143M), the Netherlands ($122M) and the UK ($95M) were the largest markets for MDF exported from Germany worldwide, together comprising 33% of total exports.
Among the main countries of destination, the UK, with a CAGR of +7.7%, recorded the highest rates of growth with regard to the value of exports, over the period under review, while shipments for the other leaders experienced more modest paces of growth.
Exports by Type
Medium density fibreboard (MDF) of thickness over 9 mm (780K cubic meters), medium density fibreboard (MDF) of thickness from 5 to 9 mm (630K cubic meters) and medium density fibreboard (MDF) of thickness under 5 mm (43K cubic meters) were the main products of MDF exports from Germany, with a combined 99.9% share of total exports.
From 2013 to 2023, the biggest increases were recorded for medium density fibreboard (MDF) of thickness from 5 to 9 mm (with a CAGR of +2.6%), while shipments for the other products experienced mixed trend patterns.
In value terms, MDF with the largest exports in Germany were medium density fibreboard (MDF) of thickness over 9 mm ($545M), medium density fibreboard (MDF) of thickness from 5 to 9 mm ($516M) and medium density fibreboard (MDF) of thickness under 5 mm ($33M).
In terms of the main product categories, medium density fibreboard (MDF) of thickness over 9 mm, with a CAGR of +5.4%, saw the highest growth rate of the value of exports, over the period under review, while shipments for the other products experienced mixed trend patterns.
Export Prices by Country
In 2023, the mdf price stood at $753 per cubic meter (FOB, Germany), with an increase of 3% against the previous year. Over the period from 2013 to 2023, it increased at an average annual rate of +2.6%. The most prominent rate of growth was recorded in 2021 when the average export price increased by 17%. The export price peaked in 2023 and is expected to retain growth in the immediate term.
There were significant differences in the average prices for the major foreign markets. In 2023, amid the top suppliers, the country with the highest price was Spain ($1.1 thousand per cubic meter), while the average price for exports to Poland ($547 per cubic meter) was amongst the lowest.
From 2013 to 2023, the most notable rate of growth in terms of prices was recorded for supplies to France (+6.2%), while the prices for the other major destinations experienced more modest paces of growth.
This report provides an in-depth analysis of the mdf market in Germany. Within it, you will discover the latest data on market trends and opportunities by country, consumption, production and price developments, as well as the global trade (imports and exports). The forecast exhibits the market prospects through 2030.
Product coverage:
- FCL 1648 - MDF/HDF
Country coverage:
- Germany
Data coverage:
- Market volume and value
- Per Capita consumption
- Forecast of the market dynamics in the medium term
- Trade (exports and imports) in Germany
- Export and import prices
- Market trends, drivers and restraints
- Key market players and their profiles
Reasons to buy this report:
- Take advantage of the latest data
- Find deeper insights into current market developments
- Discover vital success factors affecting the market
This report is designed for manufacturers, distributors, importers, and wholesalers, as well as for investors, consultants and advisors.
In this report, you can find information that helps you to make informed decisions on the following issues:
- How to diversify your business and benefit from new market opportunities
- How to load your idle production capacity
- How to boost your sales on overseas markets
- How to increase your profit margins
- How to make your supply chain more sustainable
- How to reduce your production and supply chain costs
- How to outsource production to other countries
- How to prepare your business for global expansion
While doing this research, we combine the accumulated expertise of our analysts and the capabilities of artificial intelligence. The AI-based platform, developed by our data scientists, constitutes the key working tool for business analysts, empowering them to discover deep insights and ideas from the marketing data.
-
1. INTRODUCTION
Making Data-Driven Decisions to Grow Your Business
- REPORT DESCRIPTION
- RESEARCH METHODOLOGY AND AI PLATFORM
- DATA-DRIVEN DECISIONS FOR YOUR BUSINESS
- GLOSSARY AND SPECIFIC TERMS
-
2. EXECUTIVE SUMMARY
A Quick Overview of Market Performance
- KEY FINDINGS
- MARKET TRENDS This Chapter is Available Only for the Professional Edition PRO
-
3. MARKET OVERVIEW
Understanding the Current State of The Market and Its Prospects
- MARKET SIZE
- MARKET STRUCTURE
- TRADE BALANCE
- PER CAPITA CONSUMPTION
- MARKET FORECAST TO 2030
-
4. MOST PROMISING PRODUCT
Finding New Products to Diversify Your Business
This Chapter is Available Only for the Professional Edition PRO- TOP PRODUCTS TO DIVERSIFY YOUR BUSINESS
- BEST-SELLING PRODUCTS
- MOST CONSUMED PRODUCT
- MOST TRADED PRODUCT
- MOST PROFITABLE PRODUCT FOR EXPORT
-
5. MOST PROMISING SUPPLYING COUNTRIES
Choosing the Best Countries to Establish Your Sustainable Supply Chain
This Chapter is Available Only for the Professional Edition PRO- TOP COUNTRIES TO SOURCE YOUR PRODUCT
- TOP PRODUCING COUNTRIES
- TOP EXPORTING COUNTRIES
- LOW-COST EXPORTING COUNTRIES
-
6. MOST PROMISING OVERSEAS MARKETS
Choosing the Best Countries to Boost Your Exports
This Chapter is Available Only for the Professional Edition PRO- TOP OVERSEAS MARKETS FOR EXPORTING YOUR PRODUCT
- TOP CONSUMING MARKETS
- UNSATURATED MARKETS
- TOP IMPORTING MARKETS
- MOST PROFITABLE MARKETS
7. PRODUCTION
The Latest Trends and Insights into The Industry
- PRODUCTION VOLUME AND VALUE
8. IMPORTS
The Largest Import Supplying Countries
- IMPORTS FROM 2012–2023
- IMPORTS BY COUNTRY
- IMPORT PRICES BY COUNTRY
9. EXPORTS
The Largest Destinations for Exports
- EXPORTS FROM 2012–2023
- EXPORTS BY COUNTRY
- EXPORT PRICES BY COUNTRY
-
10. PROFILES OF MAJOR PRODUCERS
The Largest Producers on The Market and Their Profiles
This Chapter is Available Only for the Professional Edition PRO -
LIST OF TABLES
- Key Findings In 2023
- Market Volume, In Physical Terms, 2012–2023
- Market Value, 2012–2023
- Per Capita Consumption In 2012-2023
- Imports, In Physical Terms, By Country, 2012–2023
- Imports, In Value Terms, By Country, 2012–2023
- Import Prices, By Country Of Origin, 2012–2023
- Exports, In Physical Terms, By Country, 2012–2023
- Exports, In Value Terms, By Country, 2012–2023
- Export Prices, By Country Of Destination, 2012–2023
-
LIST OF FIGURES
- Market Volume, In Physical Terms, 2012–2023
- Market Value, 2012–2023
- Market Structure – Domestic Supply vs. Imports, In Physical Terms, 2012-2023
- Market Structure – Domestic Supply vs. Imports, In Value Terms, 2012-2023
- Trade Balance, In Physical Terms, 2012-2023
- Trade Balance, In Value Terms, 2012-2023
- Per Capita Consumption, 2012-2023
- Market Volume Forecast to 2030
- Market Value Forecast to 2030
- Products: Market Size And Growth, By Type
- Products: Average Per Capita Consumption, By Type
- Products: Exports And Growth, By Type
- Products: Export Prices And Growth, By Type
- Production Volume And Growth
- Exports And Growth
- Export Prices And Growth
- Market Size And Growth
- Per Capita Consumption
- Imports And Growth
- Import Prices
- Production, In Physical Terms, 2012–2023
- Production, In Value Terms, 2012–2023
- Imports, In Physical Terms, 2012–2023
- Imports, In Value Terms, 2012–2023
- Imports, In Physical Terms, By Country, 2023
- Imports, In Physical Terms, By Country, 2012–2023
- Imports, In Value Terms, By Country, 2012–2023
- Import Prices, By Country Of Origin, 2012–2023
- Exports, In Physical Terms, 2012–2023
- Exports, In Value Terms, 2012–2023
- Exports, In Physical Terms, By Country, 2023
- Exports, In Physical Terms, By Country, 2012–2023
- Exports, In Value Terms, By Country, 2012–2023
- Export Prices, By Country Of Destination, 2012–2023


