Hong Kong SAR, China - Primary Cells And Primary Batteries - Market Analysis, Forecast, Size, Trends and Insights
Get instant access to more than 2 million reports, dashboards, and datasets on the IndexBox Platform.
View PricingHong Kong's Export of Primary Cells and Batteries Drops Significantly to $345M in 2023
Hong Kong Battery Exports
In 2023, approx. 1.7B units of primary cells and primary batteries were exported from Hong Kong; reducing by -12.7% against the year before. In general, exports continue to indicate a noticeable shrinkage. The growth pace was the most rapid in 2014 when exports increased by 66%. As a result, the exports reached the peak of 3.6B units. From 2015 to 2023, the growth of the exports failed to regain momentum.
In value terms, primary cells and primary batteries exports fell dramatically to $345M (IndexBox estimates) in 2023. Overall, exports showed a perceptible curtailment. The most prominent rate of growth was recorded in 2017 when exports increased by 7.4%. As a result, the exports attained the peak of $571M. From 2018 to 2023, the growth of the exports remained at a lower figure.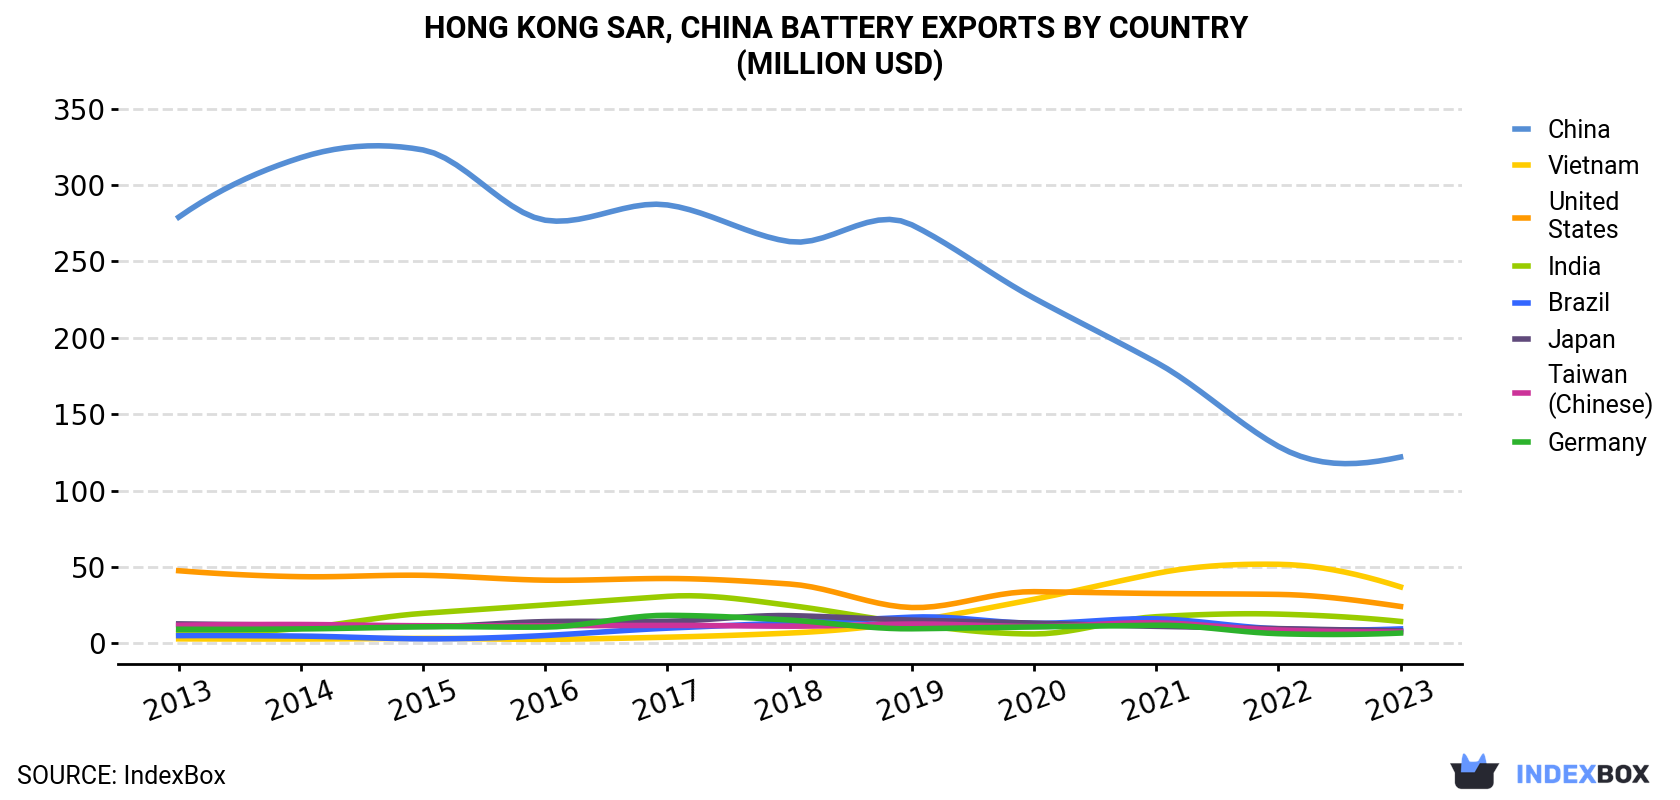 Battery Exports By Country (Million USD)">
| COUNTRY | Export Value of Battery in Hong Kong (million USD) | ||||||||||
|---|---|---|---|---|---|---|---|---|---|---|---|
| 2013 | 2014 | 2015 | 2016 | 2017 | 2018 | 2019 | 2020 | 2021 | 2022 | 2023 | |
| China | 279 | 318 | 323 | 277 | 287 | 263 | 274 | 226 | 184 | 129 | 122 |
| Vietnam | 3.0 | 2.9 | 3.3 | 2.7 | 4.1 | 6.8 | 14.5 | 28.9 | 45.8 | 51.8 | 37.0 |
| United States | 47.6 | 43.7 | 44.6 | 41.4 | 42.5 | 38.9 | 23.5 | 33.9 | 32.7 | 32.1 | 24.2 |
| India | 6.7 | 9.9 | 19.7 | 25.2 | 30.8 | 24.9 | 12.8 | 6.2 | 17.5 | 19.2 | 14.4 |
| Brazil | 5.1 | 4.8 | 3.0 | 5.2 | 10.0 | 13.5 | 17.2 | 13.2 | 16.1 | 9.6 | 9.5 |
| Japan | 12.8 | 11.9 | 11.1 | 14.3 | 14.5 | 18.2 | 15.3 | 13.3 | 11.2 | 9.7 | 8.2 |
| Taiwan (Chinese) | 11.9 | 12.4 | 11.6 | 11.6 | 11.8 | 11.3 | 12.7 | 11.1 | 13.5 | 8.8 | 7.5 |
| Germany | 9.3 | 9.5 | 10.9 | 10.7 | 18.4 | 15.3 | 9.6 | 10.8 | 11.9 | 6.4 | 6.8 |
| Others | 149 | 147 | 138 | 143 | 152 | 162 | 169 | 155 | 174 | 143 | 116 |
| Total | 524 | 559 | 566 | 531 | 571 | 554 | 548 | 498 | 507 | 410 | 345 |
Exports by Country
China (736M units) was the main destination for primary cells and primary batteries exports from Hong Kong, accounting for a 43% share of total exports. Moreover, primary cells and primary batteries exports to China exceeded the volume sent to the second major destination, Vietnam (95M units), eightfold. the United States (85M units) ranked third in terms of total exports with a 5% share.
From 2013 to 2023, the average annual growth rate of volume to China totaled -8.7%. Exports to the other major destinations recorded the following average annual rates of exports growth: Vietnam (+3.7% per year) and the United States (-7.8% per year).
In value terms, China ($122M) remains the key foreign market for primary cells and primary batteries exports from Hong Kong, comprising 35% of total exports. The second position in the ranking was taken by Vietnam ($37M), with an 11% share of total exports. It was followed by the United States, with a 7% share.
From 2013 to 2023, the average annual growth rate of value to China amounted to -8.0%. Exports to the other major destinations recorded the following average annual rates of exports growth: Vietnam (+28.4% per year) and the United States (-6.5% per year).
Exports by Type
Cells and batteries; primary, manganese dioxide (798M units), cells and batteries; lithium (602M units) and cells and batteries; primary, (other than manganese dioxide, mercuric oxide, silver oxide, lithium or air-zinc) (177M units) were the main products of primary cells and primary batteries exports from Hong Kong, with a combined 93% share of total exports. Cells and batteries; primary, silver oxide, cells and batteries; primary, air-zinc and cells and batteries; primary, mercuric oxide lagged somewhat behind, together comprising a further 6.9%.
From 2013 to 2023, the biggest increases were recorded for cells and batteries; primary, mercuric oxide (with a CAGR of +4.3%), while shipments for the other products experienced mixed trend patterns.
In value terms, cells and batteries; lithium ($222M) remains the largest type of primary cells and primary batteries exported from Hong Kong, comprising 64% of total exports. The second position in the ranking was taken by cells and batteries; primary, manganese dioxide ($79M), with a 23% share of total exports. It was followed by cells and batteries; primary, (other than manganese dioxide, mercuric oxide, silver oxide, lithium or air-zinc), with a 7.4% share.
From 2013 to 2023, the average annual growth rate of the value of cells and batteries; lithium exports was relatively modest. With regard to the other exported products, the following average annual rates of growth were recorded: cells and batteries; primary, manganese dioxide (-9.2% per year) and cells and batteries; primary, (other than manganese dioxide, mercuric oxide, silver oxide, lithium or air-zinc) (-10.7% per year).
Export Prices by Country
In 2023, the battery price stood at $0.2 per unit (FOB, Hong Kong), which is down by -3.7% against the previous year. Over the period under review, the export price saw a mild reduction. The pace of growth appeared the most rapid in 2022 an increase of 21% against the previous year. The export price peaked at $0.2 per unit in 2013; however, from 2014 to 2023, the export prices failed to regain momentum.
Prices varied noticeably by country of destination: amid the top suppliers, the country with the highest price was Vietnam ($0.4 per unit), while the average price for exports to Greece ($0.1 per unit) was amongst the lowest.
From 2013 to 2023, the most notable rate of growth in terms of prices was recorded for supplies to Vietnam (+23.8%), while the prices for the other major destinations experienced more modest paces of growth.
This report provides an in-depth analysis of the market for primary cells and primary batteries in Hong Kong SAR, China. Within it, you will discover the latest data on market trends and opportunities by country, consumption, production and price developments, as well as the global trade (imports and exports). The forecast exhibits the market prospects through 2030.
Product coverage:
- Prodcom 27201100 - Primary cells and primary batteries
- Prodcom 27201110 -
- Prodcom 27201115 -
- Prodcom 27201120 -
- Prodcom 27201125 -
- Prodcom 27201130 -
- Prodcom 27201140 -
- Prodcom 27201150 -
- Prodcom 27201155 -
- Prodcom 27201160 -
- Prodcom 27201170 -
- Prodcom 27201175 -
- Prodcom 27201190 -
Country coverage:
- Hong Kong SAR
Data coverage:
- Market volume and value
- Per Capita consumption
- Forecast of the market dynamics in the medium term
- Trade (exports and imports) in Hong Kong SAR, China
- Export and import prices
- Market trends, drivers and restraints
- Key market players and their profiles
Reasons to buy this report:
- Take advantage of the latest data
- Find deeper insights into current market developments
- Discover vital success factors affecting the market
This report is designed for manufacturers, distributors, importers, and wholesalers, as well as for investors, consultants and advisors.
In this report, you can find information that helps you to make informed decisions on the following issues:
- How to diversify your business and benefit from new market opportunities
- How to load your idle production capacity
- How to boost your sales on overseas markets
- How to increase your profit margins
- How to make your supply chain more sustainable
- How to reduce your production and supply chain costs
- How to outsource production to other countries
- How to prepare your business for global expansion
While doing this research, we combine the accumulated expertise of our analysts and the capabilities of artificial intelligence. The AI-based platform, developed by our data scientists, constitutes the key working tool for business analysts, empowering them to discover deep insights and ideas from the marketing data.
-
1. INTRODUCTION
Making Data-Driven Decisions to Grow Your Business
- REPORT DESCRIPTION
- RESEARCH METHODOLOGY AND AI PLATFORM
- DATA-DRIVEN DECISIONS FOR YOUR BUSINESS
- GLOSSARY AND SPECIFIC TERMS
-
2. EXECUTIVE SUMMARY
A Quick Overview of Market Performance
- KEY FINDINGS
- MARKET TRENDS This Chapter is Available Only for the Professional Edition PRO
-
3. MARKET OVERVIEW
Understanding the Current State of The Market and Its Prospects
- MARKET SIZE
- MARKET STRUCTURE
- TRADE BALANCE
- PER CAPITA CONSUMPTION
- MARKET FORECAST TO 2030
-
4. MOST PROMISING PRODUCT
Finding New Products to Diversify Your Business
This Chapter is Available Only for the Professional Edition PRO- TOP PRODUCTS TO DIVERSIFY YOUR BUSINESS
- BEST-SELLING PRODUCTS
- MOST CONSUMED PRODUCT
- MOST TRADED PRODUCT
- MOST PROFITABLE PRODUCT FOR EXPORT
-
5. MOST PROMISING SUPPLYING COUNTRIES
Choosing the Best Countries to Establish Your Sustainable Supply Chain
This Chapter is Available Only for the Professional Edition PRO- TOP COUNTRIES TO SOURCE YOUR PRODUCT
- TOP PRODUCING COUNTRIES
- TOP EXPORTING COUNTRIES
- LOW-COST EXPORTING COUNTRIES
-
6. MOST PROMISING OVERSEAS MARKETS
Choosing the Best Countries to Boost Your Exports
This Chapter is Available Only for the Professional Edition PRO- TOP OVERSEAS MARKETS FOR EXPORTING YOUR PRODUCT
- TOP CONSUMING MARKETS
- UNSATURATED MARKETS
- TOP IMPORTING MARKETS
- MOST PROFITABLE MARKETS
7. PRODUCTION
The Latest Trends and Insights into The Industry
- PRODUCTION VOLUME AND VALUE
8. IMPORTS
The Largest Import Supplying Countries
- IMPORTS FROM 2012–2023
- IMPORTS BY COUNTRY
- IMPORT PRICES BY COUNTRY
9. EXPORTS
The Largest Destinations for Exports
- EXPORTS FROM 2012–2023
- EXPORTS BY COUNTRY
- EXPORT PRICES BY COUNTRY
-
10. PROFILES OF MAJOR PRODUCERS
The Largest Producers on The Market and Their Profiles
This Chapter is Available Only for the Professional Edition PRO -
LIST OF TABLES
- Key Findings In 2023
- Market Volume, In Physical Terms, 2012–2023
- Market Value, 2012–2023
- Per Capita Consumption In 2012-2023
- Imports, In Physical Terms, By Country, 2012–2023
- Imports, In Value Terms, By Country, 2012–2023
- Import Prices, By Country Of Origin, 2012–2023
- Exports, In Physical Terms, By Country, 2012–2023
- Exports, In Value Terms, By Country, 2012–2023
- Export Prices, By Country Of Destination, 2012–2023
-
LIST OF FIGURES
- Market Volume, In Physical Terms, 2012–2023
- Market Value, 2012–2023
- Market Structure – Domestic Supply vs. Imports, In Physical Terms, 2012-2023
- Market Structure – Domestic Supply vs. Imports, In Value Terms, 2012-2023
- Trade Balance, In Physical Terms, 2012-2023
- Trade Balance, In Value Terms, 2012-2023
- Per Capita Consumption, 2012-2023
- Market Volume Forecast to 2030
- Market Value Forecast to 2030
- Products: Market Size And Growth, By Type
- Products: Average Per Capita Consumption, By Type
- Products: Exports And Growth, By Type
- Products: Export Prices And Growth, By Type
- Production Volume And Growth
- Exports And Growth
- Export Prices And Growth
- Market Size And Growth
- Per Capita Consumption
- Imports And Growth
- Import Prices
- Production, In Physical Terms, 2012–2023
- Production, In Value Terms, 2012–2023
- Imports, In Physical Terms, 2012–2023
- Imports, In Value Terms, 2012–2023
- Imports, In Physical Terms, By Country, 2023
- Imports, In Physical Terms, By Country, 2012–2023
- Imports, In Value Terms, By Country, 2012–2023
- Import Prices, By Country Of Origin, 2012–2023
- Exports, In Physical Terms, 2012–2023
- Exports, In Value Terms, 2012–2023
- Exports, In Physical Terms, By Country, 2023
- Exports, In Physical Terms, By Country, 2012–2023
- Exports, In Value Terms, By Country, 2012–2023
- Export Prices, By Country Of Destination, 2012–2023


