
Hong Kong SAR, China - Electric Storage Heating Radiators - Market Analysis, Forecast, Size, Trends And Insights
Get instant access to more than 2 million reports, dashboards, and datasets on the IndexBox Platform.
View PricingHong Kong's Electric Heating Radiator Exports Drop Sharply to $1.3M in 2023
Hong Kong Electric Heating Radiator Exports
After three years of growth, shipments abroad of electric storage heating radiators decreased by -32.6% to 5.3K units in 2023. In general, exports continue to indicate a mild descent. The most prominent rate of growth was recorded in 2020 when exports increased by 3,588% against the previous year. Over the period under review, the exports hit record highs at 7.9K units in 2022, and then plummeted in the following year.
In value terms, electric heating radiator exports dropped remarkably to $1.3M (IndexBox estimates) in 2023. Over the period under review, exports, however, recorded a prominent expansion. The pace of growth appeared the most rapid in 2020 with an increase of 4,070% against the previous year. Over the period under review, the exports reached the maximum at $3.7M in 2016; however, from 2017 to 2023, the exports failed to regain momentum.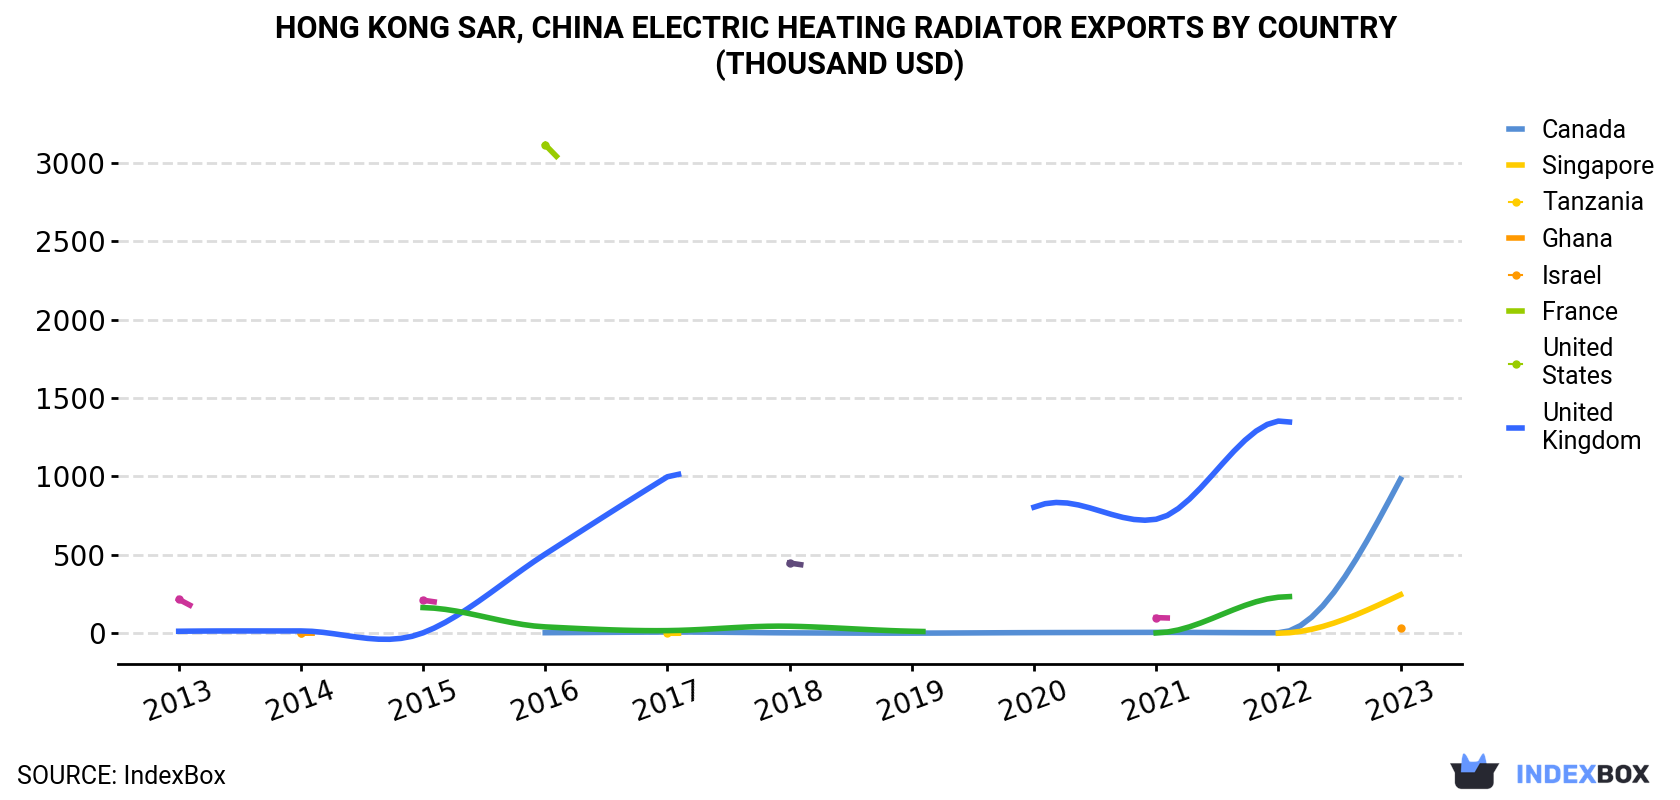
| COUNTRY | Export Value of Electric Heating Radiator in Hong Kong (thousand USD) | ||||||||||
|---|---|---|---|---|---|---|---|---|---|---|---|
| 2013 | 2014 | 2015 | 2016 | 2017 | 2018 | 2019 | 2020 | 2021 | 2022 | 2023 | |
| Canada | N/A | N/A | N/A | 3.8 | 8.0 | 2.9 | 1.0 | 4.3 | 5.9 | 3.6 | 983 |
| Singapore | N/A | 2.2 | N/A | N/A | 0.3 | N/A | N/A | N/A | N/A | 0.5 | 246 |
| Tanzania | N/A | 1.2 | N/A | N/A | N/A | N/A | N/A | N/A | N/A | N/A | 36.5 |
| Ghana | N/A | N/A | N/A | 3,114 | N/A | N/A | N/A | N/A | N/A | N/A | N/A |
| Israel | 13.0 | 15.0 | 3.0 | 505 | 998 | N/A | N/A | 804 | 727 | 1,353 | N/A |
| France | N/A | N/A | N/A | N/A | N/A | 448 | N/A | N/A | N/A | N/A | N/A |
| United States | 217 | N/A | 211 | N/A | N/A | N/A | N/A | N/A | 99.9 | N/A | N/A |
| United Kingdom | N/A | N/A | 164 | 40.9 | 17.1 | 45.1 | 13.0 | N/A | 2.4 | 230 | N/A |
| Others | 115 | 185 | 282 | 19.1 | 9.4 | 16.9 | 5.8 | 19.9 | 102 | 13.6 | 2.8 |
| Total | 345 | 203 | 661 | 3,682 | 1,033 | 513 | 19.9 | 828 | 937 | 1,601 | 1,269 |
Exports by Country
Canada (4.2K units) was the main destination for electric heating radiator exports from Hong Kong, with a 78% share of total exports. Moreover, electric heating radiator exports to Canada exceeded the volume sent to the second major destination, Singapore (1K units), fourfold.
From 2013 to 2023, the average annual growth rate of volume to Canada amounted to +97.1%. Exports to the other major destinations recorded the following average annual rates of exports growth: Singapore (+54.9% per year) and Tanzania (+21.3% per year).
In value terms, Canada ($983K) emerged as the key foreign market for electric storage heating radiators exports from Hong Kong, comprising 77% of total exports. The second position in the ranking was held by Singapore ($246K), with a 19% share of total exports.
From 2013 to 2023, the average annual rate of growth in terms of value to Canada totaled +121.4%. Exports to the other major destinations recorded the following average annual rates of exports growth: Singapore (+68.5% per year) and Tanzania (+46.6% per year).
Export Prices by Country
In 2023, the electric heating radiator price stood at $239 per unit (FOB, Hong Kong), growing by 18% against the previous year. Over the period under review, the export price saw prominent growth. The most prominent rate of growth was recorded in 2016 when the average export price increased by 999% against the previous year. As a result, the export price reached the peak level of $948 per unit. From 2017 to 2023, the average export prices failed to regain momentum.
Average prices varied noticeably for the major external markets. In 2023, amid the top suppliers, the country with the highest price was Singapore ($241 per unit), while the average price for exports to Canada amounted to $237 per unit.
From 2013 to 2023, the most notable rate of growth in terms of prices was recorded for supplies to Macao (+25.7%), while the prices for the other major destinations experienced more modest paces of growth.
This report provides an in-depth analysis of the electric heating radiator market in Hong Kong SAR, China. Within it, you will discover the latest data on market trends and opportunities by country, consumption, production and price developments, as well as the global trade (imports and exports). The forecast exhibits the market prospects through 2030.
Product coverage:
- Prodcom 27512630 - Electric storage heating radiators
Country coverage:
- Hong Kong SAR
Data coverage:
- Market volume and value
- Per Capita consumption
- Forecast of the market dynamics in the medium term
- Trade (exports and imports) in Hong Kong SAR, China
- Export and import prices
- Market trends, drivers and restraints
- Key market players and their profiles
Reasons to buy this report:
- Take advantage of the latest data
- Find deeper insights into current market developments
- Discover vital success factors affecting the market
This report is designed for manufacturers, distributors, importers, and wholesalers, as well as for investors, consultants and advisors.
In this report, you can find information that helps you to make informed decisions on the following issues:
- How to diversify your business and benefit from new market opportunities
- How to load your idle production capacity
- How to boost your sales on overseas markets
- How to increase your profit margins
- How to make your supply chain more sustainable
- How to reduce your production and supply chain costs
- How to outsource production to other countries
- How to prepare your business for global expansion
While doing this research, we combine the accumulated expertise of our analysts and the capabilities of artificial intelligence. The AI-based platform, developed by our data scientists, constitutes the key working tool for business analysts, empowering them to discover deep insights and ideas from the marketing data.
-
1. INTRODUCTION
Making Data-Driven Decisions to Grow Your Business
- REPORT DESCRIPTION
- RESEARCH METHODOLOGY AND AI PLATFORM
- DATA-DRIVEN DECISIONS FOR YOUR BUSINESS
- GLOSSARY AND SPECIFIC TERMS
-
2. EXECUTIVE SUMMARY
A Quick Overview of Market Performance
- KEY FINDINGS
- MARKET TRENDS This Chapter is Available Only for the Professional Edition PRO
-
3. MARKET OVERVIEW
Understanding the Current State of The Market and Its Prospects
- MARKET SIZE
- MARKET STRUCTURE
- TRADE BALANCE
- PER CAPITA CONSUMPTION
- MARKET FORECAST TO 2030
-
4. MOST PROMISING PRODUCT
Finding New Products to Diversify Your Business
This Chapter is Available Only for the Professional Edition PRO- TOP PRODUCTS TO DIVERSIFY YOUR BUSINESS
- BEST-SELLING PRODUCTS
- MOST CONSUMED PRODUCT
- MOST TRADED PRODUCT
- MOST PROFITABLE PRODUCT FOR EXPORT
-
5. MOST PROMISING SUPPLYING COUNTRIES
Choosing the Best Countries to Establish Your Sustainable Supply Chain
This Chapter is Available Only for the Professional Edition PRO- TOP COUNTRIES TO SOURCE YOUR PRODUCT
- TOP PRODUCING COUNTRIES
- TOP EXPORTING COUNTRIES
- LOW-COST EXPORTING COUNTRIES
-
6. MOST PROMISING OVERSEAS MARKETS
Choosing the Best Countries to Boost Your Exports
This Chapter is Available Only for the Professional Edition PRO- TOP OVERSEAS MARKETS FOR EXPORTING YOUR PRODUCT
- TOP CONSUMING MARKETS
- UNSATURATED MARKETS
- TOP IMPORTING MARKETS
- MOST PROFITABLE MARKETS
7. PRODUCTION
The Latest Trends and Insights into The Industry
- PRODUCTION VOLUME AND VALUE
8. IMPORTS
The Largest Import Supplying Countries
- IMPORTS FROM 2012–2023
- IMPORTS BY COUNTRY
- IMPORT PRICES BY COUNTRY
9. EXPORTS
The Largest Destinations for Exports
- EXPORTS FROM 2012–2023
- EXPORTS BY COUNTRY
- EXPORT PRICES BY COUNTRY
-
10. PROFILES OF MAJOR PRODUCERS
The Largest Producers on The Market and Their Profiles
This Chapter is Available Only for the Professional Edition PRO -
LIST OF TABLES
- Key Findings In 2023
- Market Volume, In Physical Terms, 2012–2023
- Market Value, 2012–2023
- Per Capita Consumption In 2012-2023
- Imports, In Physical Terms, By Country, 2012–2023
- Imports, In Value Terms, By Country, 2012–2023
- Import Prices, By Country Of Origin, 2012–2023
- Exports, In Physical Terms, By Country, 2012–2023
- Exports, In Value Terms, By Country, 2012–2023
- Export Prices, By Country Of Destination, 2012–2023
-
LIST OF FIGURES
- Market Volume, In Physical Terms, 2012–2023
- Market Value, 2012–2023
- Market Structure – Domestic Supply vs. Imports, In Physical Terms, 2012-2023
- Market Structure – Domestic Supply vs. Imports, In Value Terms, 2012-2023
- Trade Balance, In Physical Terms, 2012-2023
- Trade Balance, In Value Terms, 2012-2023
- Per Capita Consumption, 2012-2023
- Market Volume Forecast to 2030
- Market Value Forecast to 2030
- Products: Market Size And Growth, By Type
- Products: Average Per Capita Consumption, By Type
- Products: Exports And Growth, By Type
- Products: Export Prices And Growth, By Type
- Production Volume And Growth
- Exports And Growth
- Export Prices And Growth
- Market Size And Growth
- Per Capita Consumption
- Imports And Growth
- Import Prices
- Production, In Physical Terms, 2012–2023
- Production, In Value Terms, 2012–2023
- Imports, In Physical Terms, 2012–2023
- Imports, In Value Terms, 2012–2023
- Imports, In Physical Terms, By Country, 2023
- Imports, In Physical Terms, By Country, 2012–2023
- Imports, In Value Terms, By Country, 2012–2023
- Import Prices, By Country Of Origin, 2012–2023
- Exports, In Physical Terms, 2012–2023
- Exports, In Value Terms, 2012–2023
- Exports, In Physical Terms, By Country, 2023
- Exports, In Physical Terms, By Country, 2012–2023
- Exports, In Value Terms, By Country, 2012–2023
- Export Prices, By Country Of Destination, 2012–2023


