
Hong Kong SAR, China - Motor Vehicle Engines (Spark-Ignition) - Market Analysis, Forecast, Size, Trends and Insights
Get instant access to more than 2 million reports, dashboards, and datasets on the IndexBox Platform.
View PricingHong Kongs Sees Significant Decline to $4.5M in 2023 Motor Vehicle Engine Export
Hong Kong Motor Vehicle Engine Exports
Motor vehicle engine exports from Hong Kong fell notably to 7.3K units in 2023, dropping by -24.6% against the year before. In general, exports, however, continue to indicate resilient growth. The most prominent rate of growth was recorded in 2014 when exports increased by 433%. The exports peaked at 17K units in 2018; however, from 2019 to 2023, the exports remained at a lower figure.
In value terms, motor vehicle engine exports contracted to $4.5M (IndexBox estimates) in 2023. Over the period under review, exports recorded a pronounced curtailment. The most prominent rate of growth was recorded in 2018 when exports increased by 88% against the previous year. The exports peaked at $7.2M in 2014; however, from 2015 to 2023, the exports stood at a somewhat lower figure.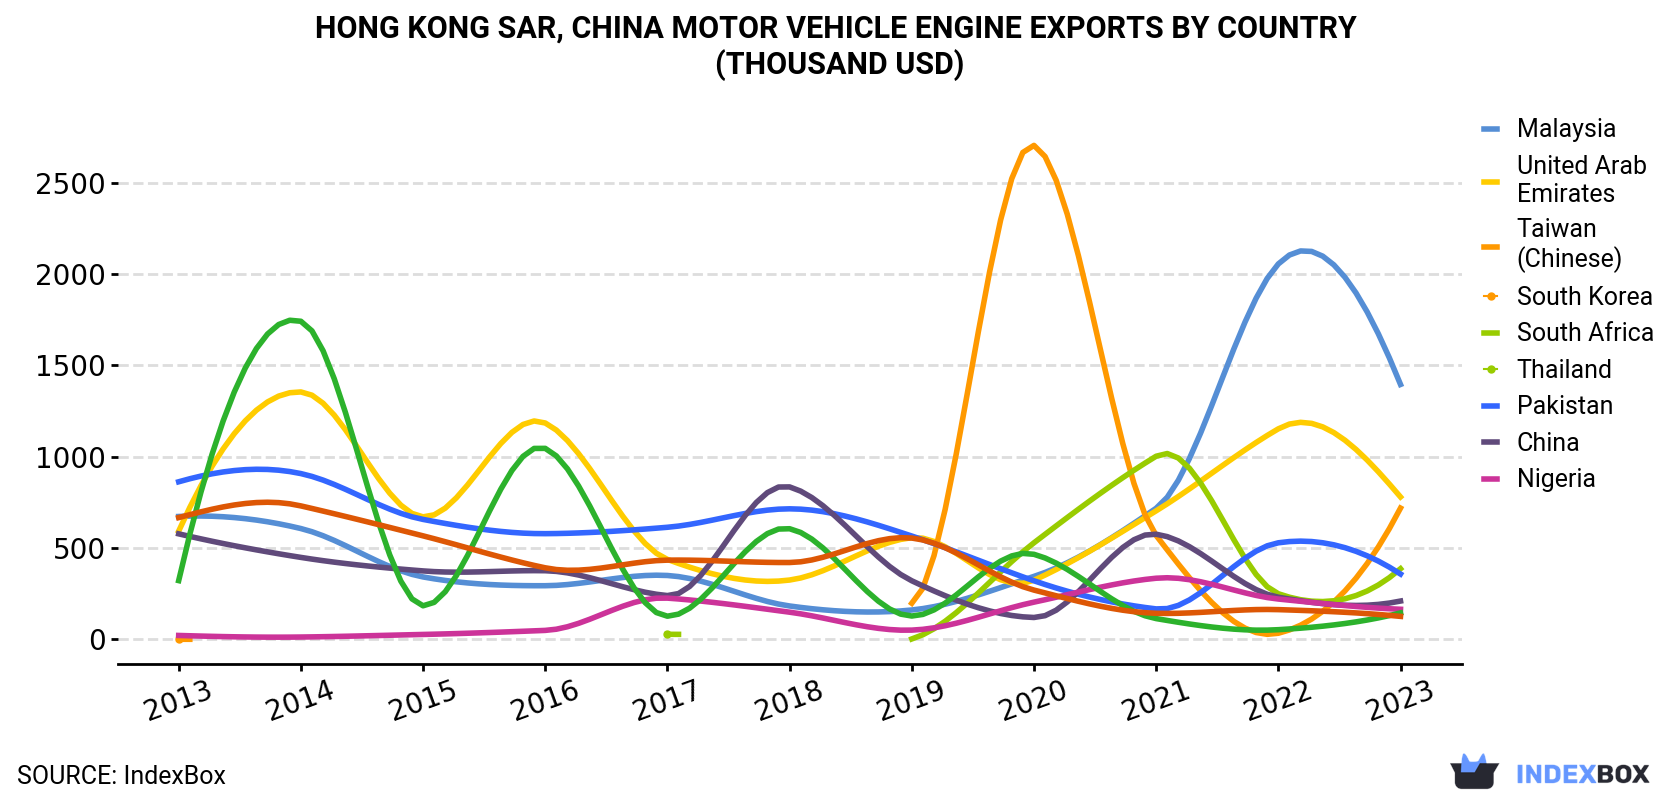
| COUNTRY | Export Value of Motor Vehicle Engine in Hong Kong (thousand USD) | ||||||||||
|---|---|---|---|---|---|---|---|---|---|---|---|
| 2013 | 2014 | 2015 | 2016 | 2017 | 2018 | 2019 | 2020 | 2021 | 2022 | 2023 | |
| Malaysia | 673 | 607 | 342 | 294 | 350 | 183 | 161 | 345 | 718 | 2,056 | 1,396 |
| United Arab Emirates | 593 | 1,355 | 671 | 1,185 | 438 | 325 | 557 | 324 | 704 | 1,153 | 780 |
| Taiwan (Chinese) | 0.6 | N/A | N/A | N/A | N/A | N/A | 198 | 2,705 | 569 | 33.7 | 719 |
| South Korea | N/A | N/A | N/A | N/A | 28.0 | N/A | 2.5 | 529 | 1,003 | 250 | 387 |
| South Africa | 863 | 908 | 657 | 579 | 614 | 715 | 566 | 321 | 167 | 529 | 358 |
| Thailand | 578 | 449 | 375 | 376 | 240 | 835 | 321 | 120 | 576 | 231 | 210 |
| Pakistan | 21.6 | 13.0 | 27.1 | 49.3 | 226 | 149 | 50.8 | 204 | 335 | 221 | 165 |
| China | 322 | 1,742 | 184 | 1,046 | 127 | 606 | 128 | 466 | 114 | 53.2 | 145 |
| Nigeria | 667 | 731 | 567 | 392 | 434 | 421 | 555 | 270 | 143 | 163 | 126 |
| Others | 2,027 | 1,411 | 1,533 | 1,268 | 830 | 2,959 | 621 | 373 | 203 | 302 | 185 |
| Total | 5,744 | 7,217 | 4,355 | 5,190 | 3,286 | 6,193 | 3,160 | 5,657 | 4,534 | 4,992 | 4,471 |
Exports by Country
Malaysia (3.1K units) was the main destination for motor vehicle engine exports from Hong Kong, accounting for a 42% share of total exports. Moreover, motor vehicle engine exports to Malaysia exceeded the volume sent to the second major destination, the United Arab Emirates (919 units), threefold. Taiwan (Chinese) (715 units) ranked third in terms of total exports with a 9.8% share.
From 2013 to 2023, the average annual growth rate of volume to Malaysia totaled +8.8%. Exports to the other major destinations recorded the following average annual rates of exports growth: the United Arab Emirates (-1.0% per year) and Taiwan (Chinese) (+92.9% per year).
In value terms, the largest markets for motor vehicle engine exported from Hong Kong were Malaysia ($1.4M), the United Arab Emirates ($780K) and Taiwan (Chinese) ($719K), with a combined 65% share of total exports.
In terms of the main countries of destination, Taiwan (Chinese), with a CAGR of +101.7%, saw the highest rates of growth with regard to the value of exports, over the period under review, while shipments for the other leaders experienced more modest paces of growth.
Exports by Type
Engines (7K units) was the largest type of motor vehicle engines (spark-ignition) exported from Hong Kong, accounting for a 96% share of total exports. It was followed by engines; reciprocating piston engines, of a kind used for the propulsion of vehicles of chapter 87, of a cylinder capacity not exceeding 50cc (106 units), with a 1.5% share of total exports. The third position in this ranking was held by engines; reciprocating piston engines, of a kind used for the propulsion of vehicles of chapter 87, of a cylinder capacity exceeding 50cc but not exceeding 250cc (96 units), with a 1.3% share.
From 2013 to 2023, the average annual growth rate of the volume of engines exports amounted to -7.0%. With regard to the other exported products, the following average annual rates of growth were recorded: engines; reciprocating piston engines, of a kind used for the propulsion of vehicles of chapter 87, of a cylinder capacity not exceeding 50cc (-2.2% per year) and engines; reciprocating piston engines, of a kind used for the propulsion of vehicles of chapter 87, of a cylinder capacity exceeding 50cc but not exceeding 250cc (+6.3% per year).
In value terms, engines ($4.3M) remains the largest type of motor vehicle engines (spark-ignition) exported from Hong Kong, comprising 97% of total exports. The second position in the ranking was held by engines; reciprocating piston engines, of a kind used for the propulsion of vehicles of chapter 87, of a cylinder capacity exceeding 50cc but not exceeding 250cc ($88K), with a 2% share of total exports. It was followed by engines; reciprocating piston engines, of a kind used for the propulsion of vehicles of chapter 87, of a cylinder capacity exceeding 250cc but not exceeding 1000cc, with a 0.6% share.
From 2013 to 2023, the average annual growth rate of the value of engines exports amounted to -2.6%. With regard to the other exported products, the following average annual rates of growth were recorded: engines; reciprocating piston engines, of a kind used for the propulsion of vehicles of chapter 87, of a cylinder capacity exceeding 50cc but not exceeding 250cc (+9.5% per year) and engines; reciprocating piston engines, of a kind used for the propulsion of vehicles of chapter 87, of a cylinder capacity exceeding 250cc but not exceeding 1000cc (-2.3% per year).
Export Prices by Country
In 2023, the motor vehicle engine price amounted to $616 per unit (FOB, Hong Kong), with an increase of 19% against the previous year. Over the period under review, the export price, however, faced a abrupt descent. The pace of growth was the most pronounced in 2020 when the average export price increased by 63% against the previous year. Over the period under review, the average export prices attained the maximum at $2,050 per unit in 2013; however, from 2014 to 2023, the export prices failed to regain momentum.
There were significant differences in the average prices for the major overseas markets. In 2023, amid the top suppliers, the country with the highest price was South Korea ($1,165 per unit), while the average price for exports to Nigeria ($219 per unit) was amongst the lowest.
From 2013 to 2023, the most notable rate of growth in terms of prices was recorded for supplies to Brazil (+17.1%), while the prices for the other major destinations experienced more modest paces of growth.
This report provides an in-depth analysis of the motor vehicle engine market in Hong Kong SAR, China. Within it, you will discover the latest data on market trends and opportunities by country, consumption, production and price developments, as well as the global trade (imports and exports). The forecast exhibits the market prospects through 2030.
Product coverage:
- Prodcom 29101100 - Spark-ignition reciprocating internal combustion piston engines, for the vehicles of HS .87 (excluding motorcycles), of a cylinder capacity . 1 .000 cm.
- Prodcom 29101200 - Spark-ignition reciprocating internal combustion piston engines, for the vehicles of HS .87 (excluding motorcycles), of a cylinder capacity > 1 .000 cm.
Country coverage:
- Hong Kong SAR
Data coverage:
- Market volume and value
- Per Capita consumption
- Forecast of the market dynamics in the medium term
- Trade (exports and imports) in Hong Kong SAR, China
- Export and import prices
- Market trends, drivers and restraints
- Key market players and their profiles
Reasons to buy this report:
- Take advantage of the latest data
- Find deeper insights into current market developments
- Discover vital success factors affecting the market
This report is designed for manufacturers, distributors, importers, and wholesalers, as well as for investors, consultants and advisors.
In this report, you can find information that helps you to make informed decisions on the following issues:
- How to diversify your business and benefit from new market opportunities
- How to load your idle production capacity
- How to boost your sales on overseas markets
- How to increase your profit margins
- How to make your supply chain more sustainable
- How to reduce your production and supply chain costs
- How to outsource production to other countries
- How to prepare your business for global expansion
While doing this research, we combine the accumulated expertise of our analysts and the capabilities of artificial intelligence. The AI-based platform, developed by our data scientists, constitutes the key working tool for business analysts, empowering them to discover deep insights and ideas from the marketing data.
-
1. INTRODUCTION
Making Data-Driven Decisions to Grow Your Business
- REPORT DESCRIPTION
- RESEARCH METHODOLOGY AND AI PLATFORM
- DATA-DRIVEN DECISIONS FOR YOUR BUSINESS
- GLOSSARY AND SPECIFIC TERMS
-
2. EXECUTIVE SUMMARY
A Quick Overview of Market Performance
- KEY FINDINGS
- MARKET TRENDS This Chapter is Available Only for the Professional Edition PRO
-
3. MARKET OVERVIEW
Understanding the Current State of The Market and Its Prospects
- MARKET SIZE
- MARKET STRUCTURE
- TRADE BALANCE
- PER CAPITA CONSUMPTION
- MARKET FORECAST TO 2030
-
4. MOST PROMISING PRODUCT
Finding New Products to Diversify Your Business
This Chapter is Available Only for the Professional Edition PRO- TOP PRODUCTS TO DIVERSIFY YOUR BUSINESS
- BEST-SELLING PRODUCTS
- MOST CONSUMED PRODUCT
- MOST TRADED PRODUCT
- MOST PROFITABLE PRODUCT FOR EXPORT
-
5. MOST PROMISING SUPPLYING COUNTRIES
Choosing the Best Countries to Establish Your Sustainable Supply Chain
This Chapter is Available Only for the Professional Edition PRO- TOP COUNTRIES TO SOURCE YOUR PRODUCT
- TOP PRODUCING COUNTRIES
- TOP EXPORTING COUNTRIES
- LOW-COST EXPORTING COUNTRIES
-
6. MOST PROMISING OVERSEAS MARKETS
Choosing the Best Countries to Boost Your Exports
This Chapter is Available Only for the Professional Edition PRO- TOP OVERSEAS MARKETS FOR EXPORTING YOUR PRODUCT
- TOP CONSUMING MARKETS
- UNSATURATED MARKETS
- TOP IMPORTING MARKETS
- MOST PROFITABLE MARKETS
7. PRODUCTION
The Latest Trends and Insights into The Industry
- PRODUCTION VOLUME AND VALUE
8. IMPORTS
The Largest Import Supplying Countries
- IMPORTS FROM 2012–2023
- IMPORTS BY COUNTRY
- IMPORT PRICES BY COUNTRY
9. EXPORTS
The Largest Destinations for Exports
- EXPORTS FROM 2012–2023
- EXPORTS BY COUNTRY
- EXPORT PRICES BY COUNTRY
-
10. PROFILES OF MAJOR PRODUCERS
The Largest Producers on The Market and Their Profiles
This Chapter is Available Only for the Professional Edition PRO -
LIST OF TABLES
- Key Findings In 2023
- Market Volume, In Physical Terms, 2012–2023
- Market Value, 2012–2023
- Per Capita Consumption In 2012-2023
- Imports, In Physical Terms, By Country, 2012–2023
- Imports, In Value Terms, By Country, 2012–2023
- Import Prices, By Country Of Origin, 2012–2023
- Exports, In Physical Terms, By Country, 2012–2023
- Exports, In Value Terms, By Country, 2012–2023
- Export Prices, By Country Of Destination, 2012–2023
-
LIST OF FIGURES
- Market Volume, In Physical Terms, 2012–2023
- Market Value, 2012–2023
- Market Structure – Domestic Supply vs. Imports, In Physical Terms, 2012-2023
- Market Structure – Domestic Supply vs. Imports, In Value Terms, 2012-2023
- Trade Balance, In Physical Terms, 2012-2023
- Trade Balance, In Value Terms, 2012-2023
- Per Capita Consumption, 2012-2023
- Market Volume Forecast to 2030
- Market Value Forecast to 2030
- Products: Market Size And Growth, By Type
- Products: Average Per Capita Consumption, By Type
- Products: Exports And Growth, By Type
- Products: Export Prices And Growth, By Type
- Production Volume And Growth
- Exports And Growth
- Export Prices And Growth
- Market Size And Growth
- Per Capita Consumption
- Imports And Growth
- Import Prices
- Production, In Physical Terms, 2012–2023
- Production, In Value Terms, 2012–2023
- Imports, In Physical Terms, 2012–2023
- Imports, In Value Terms, 2012–2023
- Imports, In Physical Terms, By Country, 2023
- Imports, In Physical Terms, By Country, 2012–2023
- Imports, In Value Terms, By Country, 2012–2023
- Import Prices, By Country Of Origin, 2012–2023
- Exports, In Physical Terms, 2012–2023
- Exports, In Value Terms, 2012–2023
- Exports, In Physical Terms, By Country, 2023
- Exports, In Physical Terms, By Country, 2012–2023
- Exports, In Value Terms, By Country, 2012–2023
- Export Prices, By Country Of Destination, 2012–2023


