
India - Acyclic Hydrocarbons - Market Analysis, Forecast, Size, Trends and Insights
Get instant access to more than 2 million reports, dashboards, and datasets on the IndexBox Platform.
View PricingIndia's Import of Acyclic Hydrocarbons Dwindles Quickly to $1.1B in 2023
India Acyclic Hydrocarbons Imports
Acyclic hydrocarbons imports into India contracted to 1.8M tons in 2023, dropping by -5.6% against 2022 figures. Over the period under review, imports, however, posted a significant expansion. The growth pace was the most rapid in 2017 with an increase of 415%. Imports peaked at 2M tons in 2019; however, from 2020 to 2023, imports stood at a somewhat lower figure.
In value terms, acyclic hydrocarbons imports dropped significantly to $1.1B (IndexBox estimates) in 2023. In general, imports, however, posted a strong increase. The most prominent rate of growth was recorded in 2017 with an increase of 168%. Over the period under review, imports attained the peak figure at $1.4B in 2022, and then fell dramatically in the following year.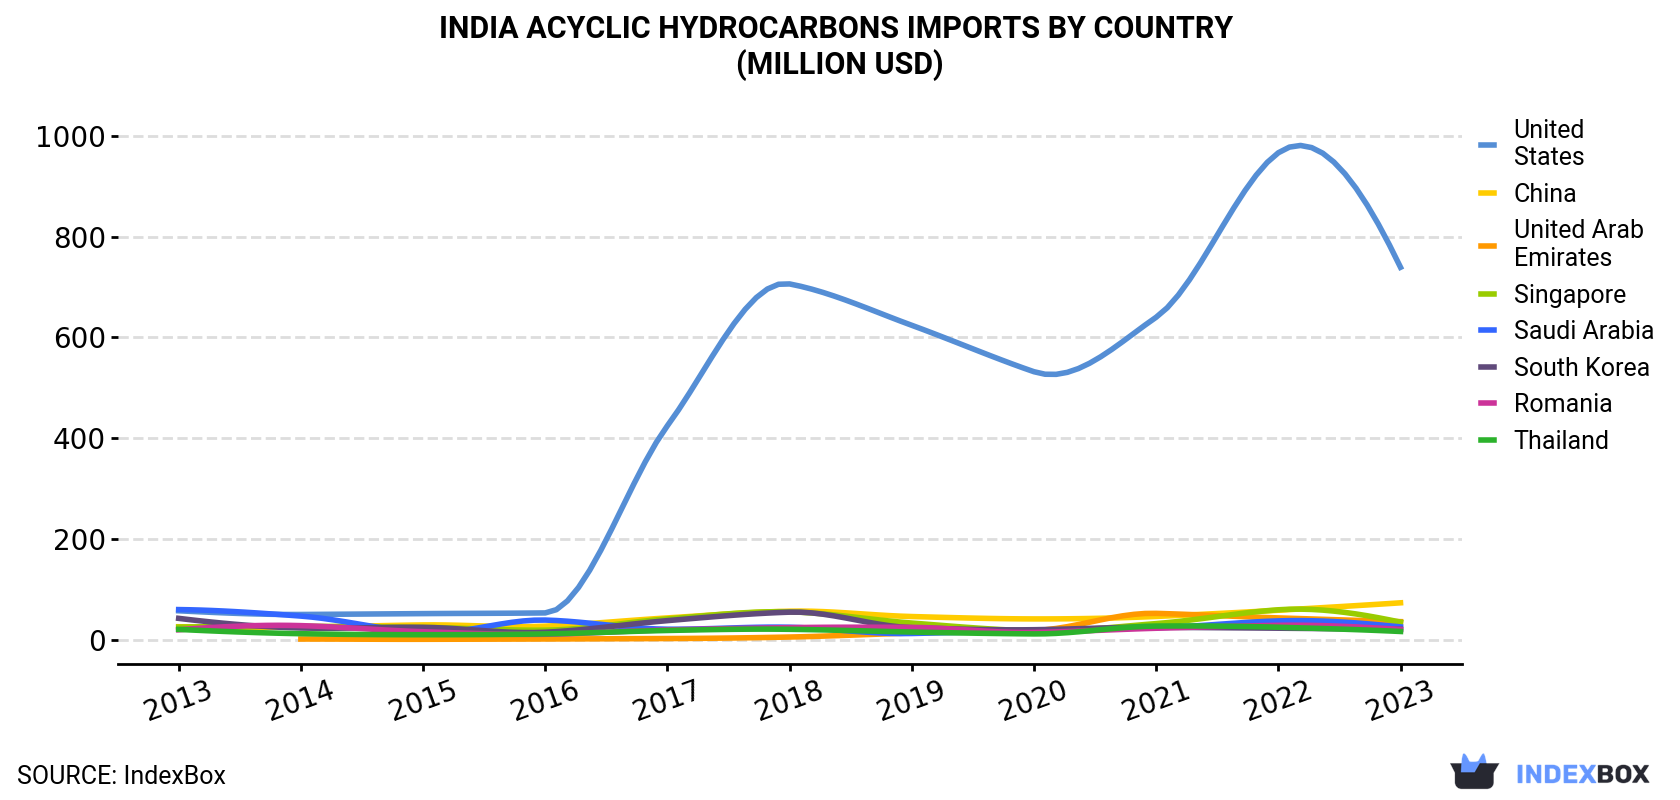
| COUNTRY | Import Value of Acyclic Hydrocarbons in India (million USD) | ||||||||||
|---|---|---|---|---|---|---|---|---|---|---|---|
| 2013 | 2014 | 2015 | 2016 | 2017 | 2018 | 2019 | 2020 | 2021 | 2022 | 2023 | |
| United States | 58.1 | 50.8 | 52.5 | 53.9 | 425 | 706 | 624 | 532 | 640 | 966 | 739 |
| China | 26.5 | 25.8 | 30.1 | 27.7 | 44.0 | 57.3 | 46.7 | 42.0 | 46.9 | 59.2 | 73.9 |
| United Arab Emirates | N/A | 2.1 | 1.6 | 2.2 | 3.1 | 6.1 | 14.1 | 19.1 | 53.0 | 44.0 | 36.6 |
| Singapore | 25.7 | 27.3 | 25.3 | 19.7 | 42.1 | 56.0 | 33.8 | 18.4 | 32.7 | 60.1 | 35.6 |
| Saudi Arabia | 60.5 | 47.6 | 14.8 | 39.7 | 21.6 | 25.5 | 13.1 | 18.8 | 24.6 | 38.1 | 26.2 |
| South Korea | 43.1 | 24.0 | 25.3 | 15.6 | 38.6 | 55.4 | 24.6 | 20.6 | 25.4 | 23.6 | 21.4 |
| Romania | 20.5 | 28.7 | 16.6 | 11.6 | 20.2 | 24.7 | 25.2 | 15.2 | 23.5 | 29.3 | 21.2 |
| Thailand | 21.2 | 12.7 | 10.7 | 12.3 | 19.1 | 21.4 | 16.0 | 12.3 | 27.8 | 25.5 | 17.1 |
| Others | 80.7 | 101 | 68.9 | 80.4 | 91.5 | 144 | 98.1 | 69.4 | 92.0 | 127 | 105 |
| Total | 336 | 320 | 246 | 263 | 705 | 1,097 | 895 | 747 | 966 | 1,373 | 1,076 |
Imports by Country
In 2023, the United States (1.6M tons) constituted the largest supplier of acyclic hydrocarbons to India, accounting for a 86% share of total imports. It was followed by Singapore (34K tons), with a 1.9% share of total imports. the United Arab Emirates (33K tons) ranked third in terms of total imports with a 1.8% share.
From 2013 to 2023, the average annual rate of growth in terms of volume from the United States stood at +43.0%. The remaining supplying countries recorded the following average annual rates of imports growth: Singapore (+4.9% per year) and the United Arab Emirates (+32.1% per year).
In value terms, the United States ($739M) constituted the largest supplier of acyclic hydrocarbons to India, comprising 69% of total imports. The second position in the ranking was taken by China ($74M), with a 6.9% share of total imports. It was followed by the United Arab Emirates, with a 3.4% share.
From 2013 to 2023, the average annual rate of growth in terms of value from the United States stood at +29.0%. The remaining supplying countries recorded the following average annual rates of imports growth: China (+10.8% per year) and the United Arab Emirates (+37.6% per year).
Imports by Type
In 2023, saturated acyclic hydrocarbons (1.6M tons) constituted the largest type of acyclic hydrocarbons supplied to India, with a 86% share of total imports. Moreover, saturated acyclic hydrocarbons exceeded the figures recorded for the second-largest type, unsaturated acyclic hydrocarbons (190K tons), eightfold. The third position in this ranking was taken by ethylene (48K tons), with a 2.6% share.
From 2013 to 2023, the average annual rate of growth in terms of the volume of saturated acyclic hydrocarbons imports totaled +34.7%. With regard to the other supplied products, the following average annual rates of growth were recorded: unsaturated acyclic hydrocarbons (+8.6% per year) and ethylene (+4.3% per year).
In value terms, saturated acyclic hydrocarbons ($724M) constituted the largest type of acyclic hydrocarbons supplied to India, comprising 67% of total imports. The second position in the ranking was held by unsaturated acyclic hydrocarbons ($275M), with a 26% share of total imports. It was followed by ethylene, with a 5.3% share.
Import Prices by Country
In 2023, the acyclic hydrocarbons price stood at $591 per ton (CIF, India), which is down by -16.9% against the previous year. In general, the import price showed a deep contraction. The growth pace was the most rapid in 2022 when the average import price increased by 36%. The import price peaked at $1,566 per ton in 2014; however, from 2015 to 2023, import prices stood at a somewhat lower figure.
Prices varied noticeably by country of origin: amid the top importers, the country with the highest price was the United Arab Emirates ($1,103 per ton), while the price for the United States ($472 per ton) was amongst the lowest.
From 2013 to 2023, the most notable rate of growth in terms of prices was attained by the United Arab Emirates (+4.2%), while the prices for the other major suppliers experienced a decline.
This report provides an in-depth analysis of the acyclic hydrocarbons market in India. Within it, you will discover the latest data on market trends and opportunities by country, consumption, production and price developments, as well as the global trade (imports and exports). The forecast exhibits the market prospects through 2030.
Product coverage:
- Prodcom 20141120 - Saturated acyclic hydrocarbons
- Prodcom 20141130 - Ethylene
- Prodcom 20141140 - Propene (propylene)
- Prodcom 20141150 - Butene (butylene) and isomers thereof
- Prodcom 20141160 - Buta-1,3-diene and isoprene
- Prodcom 20141165 -
- Prodcom 20141167 -
- Prodcom 20141190 - Unsaturated acyclic hydrocarbons (excluding ethylene, p ropene, butene, buta-1,3-diene and isoprene)
Country coverage:
- India
Data coverage:
- Market volume and value
- Per Capita consumption
- Forecast of the market dynamics in the medium term
- Trade (exports and imports) in India
- Export and import prices
- Market trends, drivers and restraints
- Key market players and their profiles
Reasons to buy this report:
- Take advantage of the latest data
- Find deeper insights into current market developments
- Discover vital success factors affecting the market
This report is designed for manufacturers, distributors, importers, and wholesalers, as well as for investors, consultants and advisors.
In this report, you can find information that helps you to make informed decisions on the following issues:
- How to diversify your business and benefit from new market opportunities
- How to load your idle production capacity
- How to boost your sales on overseas markets
- How to increase your profit margins
- How to make your supply chain more sustainable
- How to reduce your production and supply chain costs
- How to outsource production to other countries
- How to prepare your business for global expansion
While doing this research, we combine the accumulated expertise of our analysts and the capabilities of artificial intelligence. The AI-based platform, developed by our data scientists, constitutes the key working tool for business analysts, empowering them to discover deep insights and ideas from the marketing data.
-
1. INTRODUCTION
Making Data-Driven Decisions to Grow Your Business
- REPORT DESCRIPTION
- RESEARCH METHODOLOGY AND AI PLATFORM
- DATA-DRIVEN DECISIONS FOR YOUR BUSINESS
- GLOSSARY AND SPECIFIC TERMS
-
2. EXECUTIVE SUMMARY
A Quick Overview of Market Performance
- KEY FINDINGS
- MARKET TRENDS This Chapter is Available Only for the Professional Edition PRO
-
3. MARKET OVERVIEW
Understanding the Current State of The Market and Its Prospects
- MARKET SIZE
- MARKET STRUCTURE
- TRADE BALANCE
- PER CAPITA CONSUMPTION
- MARKET FORECAST TO 2030
-
4. MOST PROMISING PRODUCT
Finding New Products to Diversify Your Business
This Chapter is Available Only for the Professional Edition PRO- TOP PRODUCTS TO DIVERSIFY YOUR BUSINESS
- BEST-SELLING PRODUCTS
- MOST CONSUMED PRODUCT
- MOST TRADED PRODUCT
- MOST PROFITABLE PRODUCT FOR EXPORT
-
5. MOST PROMISING SUPPLYING COUNTRIES
Choosing the Best Countries to Establish Your Sustainable Supply Chain
This Chapter is Available Only for the Professional Edition PRO- TOP COUNTRIES TO SOURCE YOUR PRODUCT
- TOP PRODUCING COUNTRIES
- TOP EXPORTING COUNTRIES
- LOW-COST EXPORTING COUNTRIES
-
6. MOST PROMISING OVERSEAS MARKETS
Choosing the Best Countries to Boost Your Exports
This Chapter is Available Only for the Professional Edition PRO- TOP OVERSEAS MARKETS FOR EXPORTING YOUR PRODUCT
- TOP CONSUMING MARKETS
- UNSATURATED MARKETS
- TOP IMPORTING MARKETS
- MOST PROFITABLE MARKETS
7. PRODUCTION
The Latest Trends and Insights into The Industry
- PRODUCTION VOLUME AND VALUE
8. IMPORTS
The Largest Import Supplying Countries
- IMPORTS FROM 2012–2023
- IMPORTS BY COUNTRY
- IMPORT PRICES BY COUNTRY
9. EXPORTS
The Largest Destinations for Exports
- EXPORTS FROM 2012–2023
- EXPORTS BY COUNTRY
- EXPORT PRICES BY COUNTRY
-
10. PROFILES OF MAJOR PRODUCERS
The Largest Producers on The Market and Their Profiles
This Chapter is Available Only for the Professional Edition PRO -
LIST OF TABLES
- Key Findings In 2023
- Market Volume, In Physical Terms, 2012–2023
- Market Value, 2012–2023
- Per Capita Consumption In 2012-2023
- Imports, In Physical Terms, By Country, 2012–2023
- Imports, In Value Terms, By Country, 2012–2023
- Import Prices, By Country Of Origin, 2012–2023
- Exports, In Physical Terms, By Country, 2012–2023
- Exports, In Value Terms, By Country, 2012–2023
- Export Prices, By Country Of Destination, 2012–2023
-
LIST OF FIGURES
- Market Volume, In Physical Terms, 2012–2023
- Market Value, 2012–2023
- Market Structure – Domestic Supply vs. Imports, In Physical Terms, 2012-2023
- Market Structure – Domestic Supply vs. Imports, In Value Terms, 2012-2023
- Trade Balance, In Physical Terms, 2012-2023
- Trade Balance, In Value Terms, 2012-2023
- Per Capita Consumption, 2012-2023
- Market Volume Forecast to 2030
- Market Value Forecast to 2030
- Products: Market Size And Growth, By Type
- Products: Average Per Capita Consumption, By Type
- Products: Exports And Growth, By Type
- Products: Export Prices And Growth, By Type
- Production Volume And Growth
- Exports And Growth
- Export Prices And Growth
- Market Size And Growth
- Per Capita Consumption
- Imports And Growth
- Import Prices
- Production, In Physical Terms, 2012–2023
- Production, In Value Terms, 2012–2023
- Imports, In Physical Terms, 2012–2023
- Imports, In Value Terms, 2012–2023
- Imports, In Physical Terms, By Country, 2023
- Imports, In Physical Terms, By Country, 2012–2023
- Imports, In Value Terms, By Country, 2012–2023
- Import Prices, By Country Of Origin, 2012–2023
- Exports, In Physical Terms, 2012–2023
- Exports, In Value Terms, 2012–2023
- Exports, In Physical Terms, By Country, 2023
- Exports, In Physical Terms, By Country, 2012–2023
- Exports, In Value Terms, By Country, 2012–2023
- Export Prices, By Country Of Destination, 2012–2023


