India - Motorcycles and Scooters - Market Analysis, Forecast, Size, Trends And Insights
Get instant access to more than 2 million reports, dashboards, and datasets on the IndexBox Platform.
View PricingIndia's Motorcycle and Scooter Exports Drop Significantly to $5.2 Billion in 2023
India Motorcycle and Scooter Exports
In 2023, approx. 5.9M units of motorcycles and scooters were exported from India; shrinking by -18.5% against 2022 figures. In general, total exports indicated a temperate expansion from 2013 to 2023: its volume increased at an average annual rate of +2.6% over the last decade. The trend pattern, however, indicated some noticeable fluctuations being recorded throughout the analyzed period. Based on 2023 figures, exports decreased by -25.7% against 2021 indices. The most prominent rate of growth was recorded in 2021 with an increase of 49%. As a result, the exports reached the peak of 7.9M units. From 2022 to 2023, the growth of the exports failed to regain momentum.
In value terms, motorcycle and scooter exports fell to $5.2B (IndexBox estimates) in 2023. Over the period under review, total exports indicated a tangible increase from 2013 to 2023: its value increased at an average annual rate of +4.7% over the last decade. The trend pattern, however, indicated some noticeable fluctuations being recorded throughout the analyzed period. Based on 2023 figures, exports decreased by -11.3% against 2021 indices. The most prominent rate of growth was recorded in 2021 with an increase of 61%. As a result, the exports attained the peak of $5.9B. From 2022 to 2023, the growth of the exports remained at a lower figure.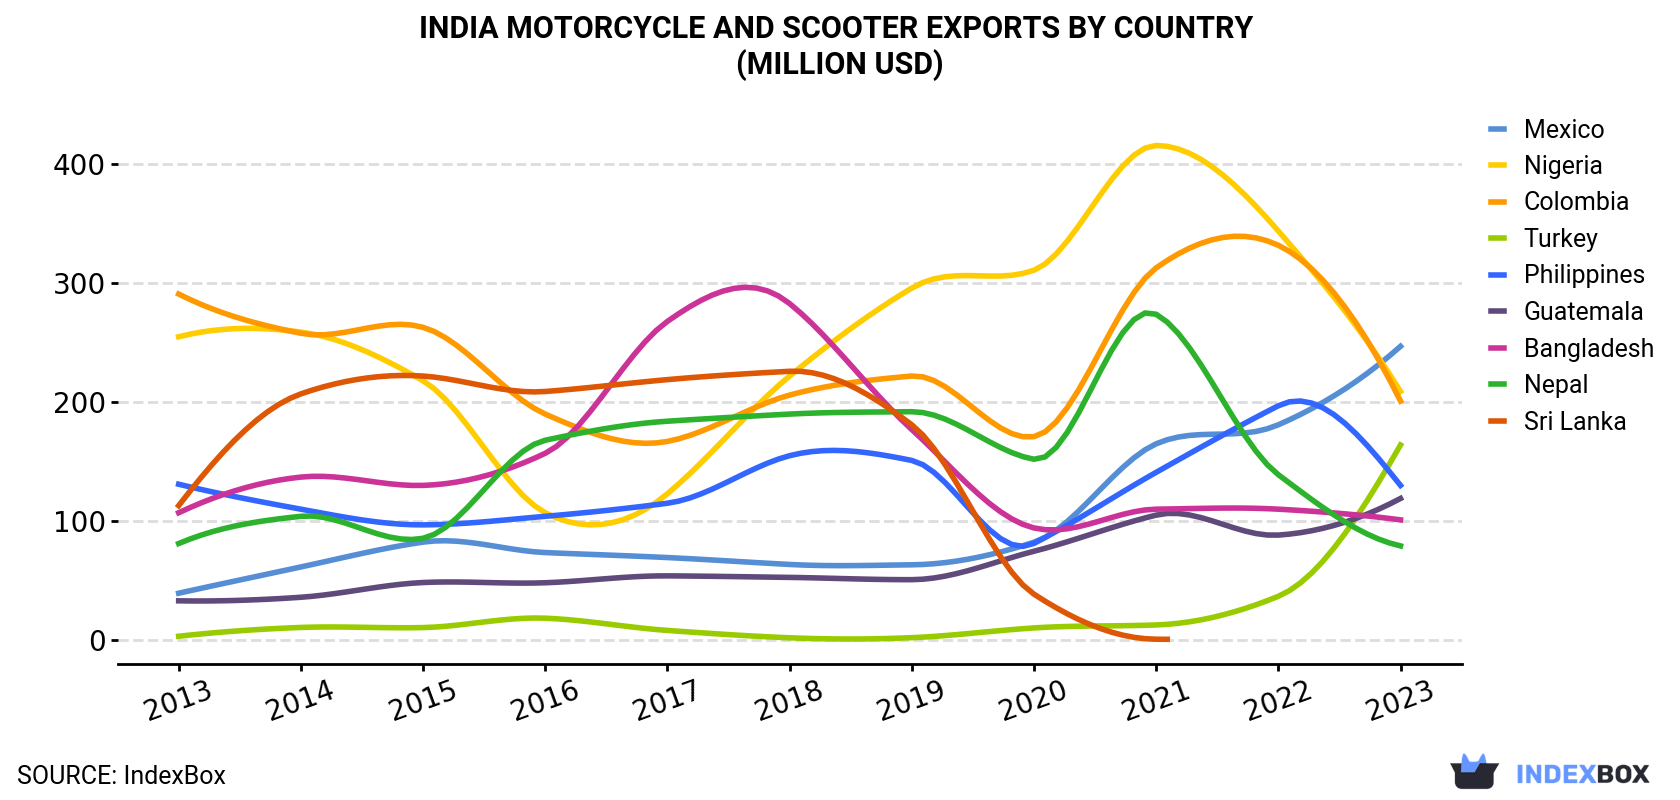
| COUNTRY | Export Value of Motorcycle and Scooter in India (million USD) | ||||||||||
|---|---|---|---|---|---|---|---|---|---|---|---|
| 2013 | 2014 | 2015 | 2016 | 2017 | 2018 | 2019 | 2020 | 2021 | 2022 | 2023 | |
| Mexico | 39.3 | 61.4 | 82.3 | 73.5 | 69.3 | 63.5 | 63.2 | 82.2 | 165 | 181 | 247 |
| Nigeria | 255 | 259 | 218 | 107 | 123 | 222 | 296 | 311 | 416 | 344 | 209 |
| Colombia | 291 | 258 | 263 | 190 | 167 | 206 | 222 | 171 | 313 | 332 | 201 |
| Turkey | 3.1 | 10.5 | 10.4 | 18.3 | 8.0 | 1.8 | 1.9 | 10.1 | 12.6 | 36.7 | 164 |
| Philippines | 131 | 110 | 96.8 | 104 | 115 | 155 | 151 | 81.2 | 141 | 197 | 130 |
| Guatemala | 32.9 | 35.9 | 48.3 | 48.1 | 53.9 | 52.6 | 50.7 | 74.6 | 105 | 88.2 | 119 |
| Bangladesh | 107 | 137 | 130 | 157 | 268 | 283 | 177 | 94.2 | 110 | 110 | 101 |
| Nepal | 81.1 | 104 | 85.5 | 168 | 184 | 190 | 192 | 152 | 274 | 139 | 79.1 |
| Sri Lanka | 113 | 207 | 222 | 209 | 219 | 226 | 181 | 38.5 | 0.6 | N/A | N/A |
| Others | 2,240 | 2,495 | 2,404 | 2,131 | 2,595 | 2,865 | 2,822 | 2,623 | 4,333 | 4,394 | 3,952 |
| Total | 3,293 | 3,677 | 3,560 | 3,205 | 3,803 | 4,265 | 4,156 | 3,639 | 5,868 | 5,822 | 5,202 |
Exports by Country
Nigeria (393K units), Mexico (221K units) and Colombia (213K units) were the main destinations of motorcycle and scooter exports from India, with a combined 14% share of total exports. the Philippines, Turkey, Guatemala, Bangladesh, Nepal and Sri Lanka lagged somewhat behind, together accounting for a further 11%.
From 2013 to 2023, the biggest increases were recorded for Turkey (with a CAGR of +45.5%), while shipments for the other leaders experienced more modest paces of growth.
In value terms, the largest markets for motorcycle and scooter exported from India were Mexico ($247M), Nigeria ($209M) and Colombia ($201M), with a combined 13% share of total exports. Turkey, the Philippines, Guatemala, Bangladesh, Nepal and Sri Lanka lagged somewhat behind, together accounting for a further 11%.
Turkey, with a CAGR of +48.9%, saw the highest rates of growth with regard to the value of exports, among the main countries of destination over the period under review, while shipments for the other leaders experienced more modest paces of growth.
Exports by Type
Motorcycles (including mopeds) and cycles; fitted with an auxiliary motor, reciprocating internal combustion piston engine, of cylinder capacity exceeding 50cc but not exceeding 250cc, with or without side-cars; side-cars (5.5M units) was the largest type of motorcycles and scooters exported from India, with a 93% share of total exports. Moreover, motorcycles (including mopeds) and cycles; fitted with an auxiliary motor, reciprocating internal combustion piston engine, of cylinder capacity exceeding 50cc but not exceeding 250cc, with or without side-cars; side-cars exceeded the volume of the second product type, motorcycles (including mopeds) and cycles; fitted with an auxiliary motor, reciprocating internal combustion piston engine, of cylinder capacity exceeding 250cc but not exceeding 500cc, with or without side-cars; side-cars (334K units), more than tenfold. The third position in this ranking was taken by motorcycles (including mopeds) and cycles; fitted with auxiliary motor, reciprocating internal combustion piston engine of cylinder capacity exceeding 500cc but not exceeding 800cc, with or without sidecars; side-cars (52K units), with a 0.9% share.
From 2013 to 2023, the average annual growth rate of the volume of motorcycles (including mopeds) and cycles; fitted with an auxiliary motor, reciprocating internal combustion piston engine, of cylinder capacity exceeding 50cc but not exceeding 250cc, with or without side-cars; side-cars exports amounted to +1.9%. With regard to the other exported products, the following average annual rates of growth were recorded: motorcycles (including mopeds) and cycles; fitted with an auxiliary motor, reciprocating internal combustion piston engine, of cylinder capacity exceeding 250cc but not exceeding 500cc, with or without side-cars; side-cars (+27.2% per year) and motorcycles (including mopeds) and cycles; fitted with auxiliary motor, reciprocating internal combustion piston engine of cylinder capacity exceeding 500cc but not exceeding 800cc, with or without sidecars; side-cars (+56.4% per year).
In value terms, motorcycles (including mopeds) and cycles; fitted with an auxiliary motor, reciprocating internal combustion piston engine, of cylinder capacity exceeding 50cc but not exceeding 250cc, with or without side-cars; side-cars ($4.3B) remains the largest type of motorcycles and scooters exported from India, comprising 82% of total exports. The second position in the ranking was held by motorcycles (including mopeds) and cycles; fitted with an auxiliary motor, reciprocating internal combustion piston engine, of cylinder capacity exceeding 250cc but not exceeding 500cc, with or without side-cars; side-cars ($761M), with a 15% share of total exports. It was followed by motorcycles (including mopeds) and cycles; fitted with auxiliary motor, reciprocating internal combustion piston engine of cylinder capacity exceeding 500cc but not exceeding 800cc, with or without sidecars; side-cars, with a 3.5% share.
From 2013 to 2023, the average annual growth rate of the value of motorcycles (including mopeds) and cycles; fitted with an auxiliary motor, reciprocating internal combustion piston engine, of cylinder capacity exceeding 50cc but not exceeding 250cc, with or without side-cars; side-cars exports stood at +2.8%. With regard to the other exported products, the following average annual rates of growth were recorded: motorcycles (including mopeds) and cycles; fitted with an auxiliary motor, reciprocating internal combustion piston engine, of cylinder capacity exceeding 250cc but not exceeding 500cc, with or without side-cars; side-cars (+26.4% per year) and motorcycles (including mopeds) and cycles; fitted with auxiliary motor, reciprocating internal combustion piston engine of cylinder capacity exceeding 500cc but not exceeding 800cc, with or without sidecars; side-cars (+66.7% per year).
Export Prices by Country
In 2023, the motorcycle and scooter price amounted to $886 per unit (FOB, India), picking up by 9.6% against the previous year. Over the last decade, it increased at an average annual rate of +2.1%. As a result, the export price attained the peak level and is likely to continue growth in the immediate term.
There were significant differences in the average prices for the major external markets. In 2023, amid the top suppliers, the country with the highest price was Argentina ($1,488 per unit), while the average price for exports to Nigeria ($532 per unit) was amongst the lowest.
From 2013 to 2023, the most notable rate of growth in terms of prices was recorded for supplies to Bangladesh (+3.3%), while the prices for the other major destinations experienced more modest paces of growth.
This report provides an in-depth analysis of the motorcycle and scooter market in India. Within it, you will discover the latest data on market trends and opportunities by country, consumption, production and price developments, as well as the global trade (imports and exports). The forecast exhibits the market prospects through 2030.
Product coverage:
- Prodcom 30911200 - Motorcycles with reciprocating internal combustion piston engine > .50 cm.
Country coverage:
- India
Data coverage:
- Market volume and value
- Per Capita consumption
- Forecast of the market dynamics in the medium term
- Trade (exports and imports) in India
- Export and import prices
- Market trends, drivers and restraints
- Key market players and their profiles
Reasons to buy this report:
- Take advantage of the latest data
- Find deeper insights into current market developments
- Discover vital success factors affecting the market
This report is designed for manufacturers, distributors, importers, and wholesalers, as well as for investors, consultants and advisors.
In this report, you can find information that helps you to make informed decisions on the following issues:
- How to diversify your business and benefit from new market opportunities
- How to load your idle production capacity
- How to boost your sales on overseas markets
- How to increase your profit margins
- How to make your supply chain more sustainable
- How to reduce your production and supply chain costs
- How to outsource production to other countries
- How to prepare your business for global expansion
While doing this research, we combine the accumulated expertise of our analysts and the capabilities of artificial intelligence. The AI-based platform, developed by our data scientists, constitutes the key working tool for business analysts, empowering them to discover deep insights and ideas from the marketing data.
-
1. INTRODUCTION
Making Data-Driven Decisions to Grow Your Business
- REPORT DESCRIPTION
- RESEARCH METHODOLOGY AND AI PLATFORM
- DATA-DRIVEN DECISIONS FOR YOUR BUSINESS
- GLOSSARY AND SPECIFIC TERMS
-
2. EXECUTIVE SUMMARY
A Quick Overview of Market Performance
- KEY FINDINGS
- MARKET TRENDS This Chapter is Available Only for the Professional Edition PRO
-
3. MARKET OVERVIEW
Understanding the Current State of The Market and Its Prospects
- MARKET SIZE
- MARKET STRUCTURE
- TRADE BALANCE
- PER CAPITA CONSUMPTION
- MARKET FORECAST TO 2030
-
4. MOST PROMISING PRODUCT
Finding New Products to Diversify Your Business
This Chapter is Available Only for the Professional Edition PRO- TOP PRODUCTS TO DIVERSIFY YOUR BUSINESS
- BEST-SELLING PRODUCTS
- MOST CONSUMED PRODUCT
- MOST TRADED PRODUCT
- MOST PROFITABLE PRODUCT FOR EXPORT
-
5. MOST PROMISING SUPPLYING COUNTRIES
Choosing the Best Countries to Establish Your Sustainable Supply Chain
This Chapter is Available Only for the Professional Edition PRO- TOP COUNTRIES TO SOURCE YOUR PRODUCT
- TOP PRODUCING COUNTRIES
- TOP EXPORTING COUNTRIES
- LOW-COST EXPORTING COUNTRIES
-
6. MOST PROMISING OVERSEAS MARKETS
Choosing the Best Countries to Boost Your Exports
This Chapter is Available Only for the Professional Edition PRO- TOP OVERSEAS MARKETS FOR EXPORTING YOUR PRODUCT
- TOP CONSUMING MARKETS
- UNSATURATED MARKETS
- TOP IMPORTING MARKETS
- MOST PROFITABLE MARKETS
7. PRODUCTION
The Latest Trends and Insights into The Industry
- PRODUCTION VOLUME AND VALUE
8. IMPORTS
The Largest Import Supplying Countries
- IMPORTS FROM 2012–2023
- IMPORTS BY COUNTRY
- IMPORT PRICES BY COUNTRY
9. EXPORTS
The Largest Destinations for Exports
- EXPORTS FROM 2012–2023
- EXPORTS BY COUNTRY
- EXPORT PRICES BY COUNTRY
-
10. PROFILES OF MAJOR PRODUCERS
The Largest Producers on The Market and Their Profiles
This Chapter is Available Only for the Professional Edition PRO -
LIST OF TABLES
- Key Findings In 2023
- Market Volume, In Physical Terms, 2012–2023
- Market Value, 2012–2023
- Per Capita Consumption In 2012-2023
- Imports, In Physical Terms, By Country, 2012–2023
- Imports, In Value Terms, By Country, 2012–2023
- Import Prices, By Country Of Origin, 2012–2023
- Exports, In Physical Terms, By Country, 2012–2023
- Exports, In Value Terms, By Country, 2012–2023
- Export Prices, By Country Of Destination, 2012–2023
-
LIST OF FIGURES
- Market Volume, In Physical Terms, 2012–2023
- Market Value, 2012–2023
- Market Structure – Domestic Supply vs. Imports, In Physical Terms, 2012-2023
- Market Structure – Domestic Supply vs. Imports, In Value Terms, 2012-2023
- Trade Balance, In Physical Terms, 2012-2023
- Trade Balance, In Value Terms, 2012-2023
- Per Capita Consumption, 2012-2023
- Market Volume Forecast to 2030
- Market Value Forecast to 2030
- Products: Market Size And Growth, By Type
- Products: Average Per Capita Consumption, By Type
- Products: Exports And Growth, By Type
- Products: Export Prices And Growth, By Type
- Production Volume And Growth
- Exports And Growth
- Export Prices And Growth
- Market Size And Growth
- Per Capita Consumption
- Imports And Growth
- Import Prices
- Production, In Physical Terms, 2012–2023
- Production, In Value Terms, 2012–2023
- Imports, In Physical Terms, 2012–2023
- Imports, In Value Terms, 2012–2023
- Imports, In Physical Terms, By Country, 2023
- Imports, In Physical Terms, By Country, 2012–2023
- Imports, In Value Terms, By Country, 2012–2023
- Import Prices, By Country Of Origin, 2012–2023
- Exports, In Physical Terms, 2012–2023
- Exports, In Value Terms, 2012–2023
- Exports, In Physical Terms, By Country, 2023
- Exports, In Physical Terms, By Country, 2012–2023
- Exports, In Value Terms, By Country, 2012–2023
- Export Prices, By Country Of Destination, 2012–2023


