
World - Motor Vehicles Compression-Ignition Internal Combustion Piston Engines - Market Analysis, Forecast, Size, Trends and Insights
Get instant access to more than 2 million reports, dashboards, and datasets on the IndexBox Platform.
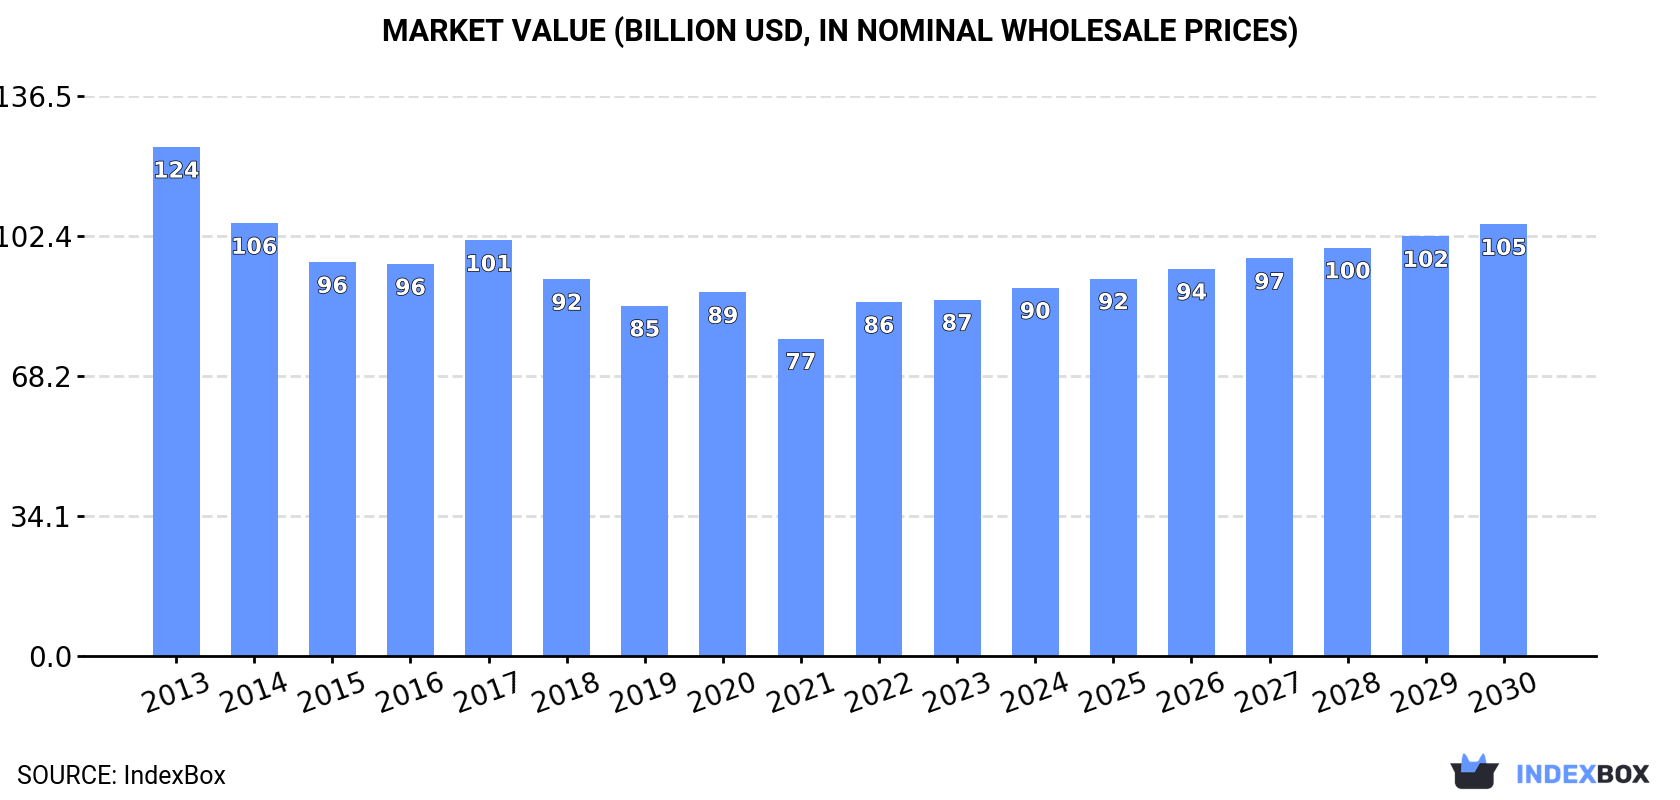
View PricingGlobal Internal Combustion Engines Market to Witness Modest Growth with Anticipated CAGR of +0.6% from 2023 to 2030
IndexBox has just published a new report: World - Motor Vehicles Compression-Ignition Internal Combustion Piston Engines - Market Analysis, Forecast, Size, Trends and Insights.
Driven by rising demand for internal combustion engines, the market is forecasted to experience a slight performance increase with a CAGR of +0.6% in volume and +2.8% in value from 2023 to 2030. By the end of 2030, the market volume is expected to reach 28M units, and the market value is projected to hit $105.2B in nominal prices.
Market Forecast
Driven by rising demand for internal combustion engines worldwide, the market is expected to start an upward consumption trend over the next seven years. The performance of the market is forecast to increase slightly, with an anticipated CAGR of +0.6% for the period from 2023 to 2030, which is projected to bring the market volume to 28M units by the end of 2030.
In value terms, the market is forecast to increase with an anticipated CAGR of +2.8% for the period from 2023 to 2030, which is projected to bring the market value to $105.2B (in nominal wholesale prices) by the end of 2030.
Consumption
World Consumption of Motor Vehicles Compression-Ignition Internal Combustion Piston Engines
In 2023, approx. 27M units of motor vehicles compression-ignition internal combustion piston engines were consumed worldwide; waning by -1.8% on 2022. In general, consumption recorded a noticeable decrease. Global consumption peaked at 34M units in 2013; however, from 2014 to 2023, consumption stood at a somewhat lower figure.
The global internal combustion engines market size was estimated at $86.9B in 2023, flattening at the previous year. This figure reflects the total revenues of producers and importers (excluding logistics costs, retail marketing costs, and retailers' margins, which will be included in the final consumer price). Overall, consumption showed a pronounced reduction. Global consumption peaked at $124.1B in 2013; however, from 2014 to 2023, consumption stood at a somewhat lower figure.
Consumption By Country
The countries with the highest volumes of consumption in 2023 were China (7M units), the United States (4M units) and India (2.8M units), with a combined 51% share of global consumption. Mexico, Nigeria, the UK, Spain, South Africa, Turkey, Canada and France lagged somewhat behind, together accounting for a further 23%.
From 2013 to 2023, the biggest increases were recorded for South Africa (with a CAGR of +5.3%), while consumption for the other global leaders experienced mixed trends in the consumption figures.
In value terms, China ($26.2B) led the market, alone. The second position in the ranking was held by the United States ($10.3B). It was followed by Mexico.
From 2013 to 2023, the average annual growth rate of value in China amounted to -2.6%. The remaining consuming countries recorded the following average annual rates of market growth: the United States (-7.1% per year) and Mexico (+0.6% per year).
The countries with the highest levels of internal combustion engines per capita consumption in 2023 were Spain (18 units per 1000 persons), Canada (13 units per 1000 persons) and the UK (13 units per 1000 persons).
From 2013 to 2023, the biggest increases were recorded for South Africa (with a CAGR of +4.0%), while consumption for the other global leaders experienced a decline in the per capita consumption figures.
Production
World Production of Motor Vehicles Compression-Ignition Internal Combustion Piston Engines
In 2023, global production of motor vehicles compression-ignition internal combustion piston engines contracted slightly to 23M units, which is down by -4.2% compared with the year before. In general, production recorded a pronounced decrease. The most prominent rate of growth was recorded in 2022 when the production volume increased by 9.5%. Over the period under review, global production reached the maximum volume at 35M units in 2013; however, from 2014 to 2023, production remained at a lower figure.
In value terms, internal combustion engines production fell to $97B in 2023 estimated in export price. Over the period under review, production showed a noticeable reduction. The pace of growth appeared the most rapid in 2022 when the production volume increased by 13%. Over the period under review, global production hit record highs at $156.2B in 2013; however, from 2014 to 2023, production remained at a lower figure.
Production By Country
China (7.2M units) remains the largest internal combustion engines producing country worldwide, accounting for 31% of total volume. Moreover, internal combustion engines production in China exceeded the figures recorded by the second-largest producer, India (2.8M units), threefold. The third position in this ranking was held by the United States (2.1M units), with a 9.3% share.
In China, internal combustion engines production declined by an average annual rate of -1.2% over the period from 2013-2023. In the other countries, the average annual rates were as follows: India (-0.4% per year) and the United States (-6.8% per year).
Imports
World Imports of Motor Vehicles Compression-Ignition Internal Combustion Piston Engines
In 2023, purchases abroad of motor vehicles compression-ignition internal combustion piston engines increased by 12% to 10M units, rising for the third consecutive year after two years of decline. The total import volume increased at an average annual rate of +2.2% from 2013 to 2023; the trend pattern remained relatively stable, with only minor fluctuations being recorded in certain years. The most prominent rate of growth was recorded in 2021 when imports increased by 18%. Over the period under review, global imports reached the maximum in 2023 and are likely to continue growth in the immediate term.
In value terms, internal combustion engines imports expanded notably to $32.8B in 2023. Over the period under review, imports saw a relatively flat trend pattern. The most prominent rate of growth was recorded in 2021 when imports increased by 18% against the previous year. Global imports peaked at $33.1B in 2014; however, from 2015 to 2023, imports failed to regain momentum.
Imports By Country
In 2023, the United States (2.3M units) and Mexico (1.6M units) represented the main importers of motor vehicles compression-ignition internal combustion piston enginesin the world, together recording near 37% of total imports. Germany (817K units) ranks next in terms of the total imports with a 7.8% share, followed by Turkey (5.6%), Spain (5.4%) and Poland (4.5%). South Africa (450K units), the Czech Republic (394K units), France (287K units), Thailand (256K units), Belgium (225K units), Argentina (225K units) and the UK (210K units) took a minor share of total imports.
From 2013 to 2023, the biggest increases were recorded for South Africa (with a CAGR of +28.7%), while purchases for the other global leaders experienced more modest paces of growth.
In value terms, Mexico ($6.4B), Germany ($3.7B) and the United States ($2.9B) constituted the countries with the highest levels of imports in 2023, together comprising 39% of global imports. Turkey, Spain, Poland, France, the Czech Republic, Belgium, Thailand, Argentina, the UK and South Africa lagged somewhat behind, together comprising a further 35%.
Among the main importing countries, Poland, with a CAGR of +14.8%, saw the highest rates of growth with regard to the value of imports, over the period under review, while purchases for the other global leaders experienced more modest paces of growth.
Import Prices By Country
In 2023, the average internal combustion engines import price amounted to $3,146 per unit, stabilizing at the previous year. Overall, the import price, however, recorded a noticeable curtailment. The pace of growth appeared the most rapid in 2017 an increase of 1.3%. Over the period under review, average import prices reached the peak figure at $3,834 per unit in 2013; however, from 2014 to 2023, import prices failed to regain momentum.
There were significant differences in the average prices amongst the major importing countries. In 2023, amid the top importers, the country with the highest price was France ($4,640 per unit).
From 2013 to 2023, the most notable rate of growth in terms of prices was attained by the UK (+5.9%), while the other global leaders experienced more modest paces of growth.
Exports
World Exports of Motor Vehicles Compression-Ignition Internal Combustion Piston Engines
In 2023, the amount of motor vehicles compression-ignition internal combustion piston engines exported worldwide rose notably to 6.2M units, growing by 11% compared with the previous year's figure. Over the period under review, exports, however, recorded a perceptible slump. The global exports peaked at 9.6M units in 2014; however, from 2015 to 2023, the exports stood at a somewhat lower figure.
In value terms, internal combustion engines exports rose remarkably to $27.8B in 2023. In general, exports, however, continue to indicate a mild shrinkage. The most prominent rate of growth was recorded in 2021 when exports increased by 15% against the previous year. Over the period under review, the global exports attained the maximum at $35.5B in 2014; however, from 2015 to 2023, the exports failed to regain momentum.
Exports By Country
Poland (819K units), Germany (641K units), France (636K units), the UK (603K units), Italy (542K units), Thailand (446K units), the United States (428K units), Austria (300K units), Hungary (283K units), Mexico (206K units), Spain (190K units) and China (188K units) represented roughly 86% of total exports in 2023.
From 2013 to 2023, the biggest increases were recorded for Thailand (with a CAGR of +12.7%), while shipments for the other global leaders experienced more modest paces of growth.
In value terms, the largest internal combustion engines supplying countries worldwide were the United States ($5B), Germany ($4.1B) and Poland ($2.7B), together comprising 42% of global exports.
The United States, with a CAGR of +4.8%, recorded the highest rates of growth with regard to the value of exports, among the main exporting countries over the period under review, while shipments for the other global leaders experienced more modest paces of growth.
Export Prices By Country
In 2023, the average internal combustion engines export price amounted to $4,513 per unit, shrinking by -3.8% against the previous year. Over the last decade, it increased at an average annual rate of +1.9%. The most prominent rate of growth was recorded in 2018 an increase of 8.4%. Over the period under review, the average export prices attained the maximum at $4,693 per unit in 2022, and then declined in the following year.
Prices varied noticeably by country of origin: amid the top suppliers, the country with the highest price was the United States ($11,602 per unit), while France ($1,719 per unit) was amongst the lowest.
From 2013 to 2023, the most notable rate of growth in terms of prices was attained by Spain (+5.3%), while the other global leaders experienced more modest paces of growth.
This report provides an in-depth analysis of the global internal combustion engines market. Within it, you will discover the latest data on market trends and opportunities by country, consumption, production and price developments, as well as the global trade (imports and exports). The forecast exhibits the market prospects through 2030.
Product coverage:
- Prodcom 29101300 - Vehicle compression-ignition internal combustion piston engines (diesel or semi-diesel) (excluding for railway or tramway rolling stock)
Country coverage:
Worldwide - the report contains statistical data for 200 countries and includes detailed profiles of the 50 largest consuming countries:
- USA
- China
- Japan
- Germany
- United Kingdom
- France
- Brazil
- Italy
- Russian Federation
- India
- Canada
- Australia
- Republic of Korea
- Spain
- Mexico
- Indonesia
- Netherlands
- Turkey
- Saudi Arabia
- Switzerland
- Sweden
- Nigeria
- Poland
- Belgium
- Argentina
- Norway
- Austria
- Thailand
- United Arab Emirates
- Colombia
- Denmark
- South Africa
- Malaysia
- Israel
- Singapore
- Egypt
- Philippines
- Finland
- Chile
- Ireland
- Pakistan
- Greece
- Portugal
- Kazakhstan
- Algeria
- Czech Republic
- Qatar
- Peru
- Romania
- Vietnam
+ the largest producing countries
Data coverage:
- Global market volume and value
- Per Capita consumption
- Forecast of the market dynamics in the medium term
- Global production, split by region and country
- Global trade (exports and imports)
- Export and import prices
- Market trends, drivers and restraints
- Key market players and their profiles
Reasons to buy this report:
- Take advantage of the latest data
- Find deeper insights into current market developments
- Discover vital success factors affecting the market
This report is designed for manufacturers, distributors, importers, and wholesalers, as well as for investors, consultants and advisors.
In this report, you can find information that helps you to make informed decisions on the following issues:
- How to diversify your business and benefit from new market opportunities
- How to load your idle production capacity
- How to boost your sales on overseas markets
- How to increase your profit margins
- How to make your supply chain more sustainable
- How to reduce your production and supply chain costs
- How to outsource production to other countries
- How to prepare your business for global expansion
While doing this research, we combine the accumulated expertise of our analysts and the capabilities of artificial intelligence. The AI-based platform, developed by our data scientists, constitutes the key working tool for business analysts, empowering them to discover deep insights and ideas from the marketing data.
-
1. INTRODUCTION
Making Data-Driven Decisions to Grow Your Business
- REPORT DESCRIPTION
- RESEARCH METHODOLOGY AND AI PLATFORM
- DATA-DRIVEN DECISIONS FOR YOUR BUSINESS
- GLOSSARY AND SPECIFIC TERMS
-
2. EXECUTIVE SUMMARY
A Quick Overview of Market Performance
- KEY FINDINGS
- MARKET TRENDS This Chapter is Available Only for the Professional Edition PRO
-
3. MARKET OVERVIEW
Understanding the Current State of The Market and Its Prospects
- MARKET SIZE
- CONSUMPTION BY COUNTRY
- MARKET FORECAST TO 2030
-
4. MOST PROMISING PRODUCT
Finding New Products to Diversify Your Business
This Chapter is Available Only for the Professional Edition PRO- TOP PRODUCTS TO DIVERSIFY YOUR BUSINESS
- BEST-SELLING PRODUCTS
- MOST CONSUMED PRODUCT
- MOST TRADED PRODUCT
- MOST PROFITABLE PRODUCT FOR EXPORT
-
5. MOST PROMISING SUPPLYING COUNTRIES
Choosing the Best Countries to Establish Your Sustainable Supply Chain
This Chapter is Available Only for the Professional Edition PRO- TOP COUNTRIES TO SOURCE YOUR PRODUCT
- TOP PRODUCING COUNTRIES
- TOP EXPORTING COUNTRIES
- LOW-COST EXPORTING COUNTRIES
-
6. MOST PROMISING OVERSEAS MARKETS
Choosing the Best Countries to Boost Your Exports
This Chapter is Available Only for the Professional Edition PRO- TOP OVERSEAS MARKETS FOR EXPORTING YOUR PRODUCT
- TOP CONSUMING MARKETS
- UNSATURATED MARKETS
- TOP IMPORTING MARKETS
- MOST PROFITABLE MARKETS
7. GLOBAL PRODUCTION
The Latest Trends and Insights into The Industry
- PRODUCTION VOLUME AND VALUE
- PRODUCTION BY COUNTRY
8. GLOBAL IMPORTS
The Largest Importers on The Market and How They Succeed
- IMPORTS FROM 2012–2023
- IMPORTS BY COUNTRY
- IMPORT PRICES BY COUNTRY
9. GLOBAL EXPORTS
The Largest Exporters on The Market and How They Succeed
- EXPORTS FROM 2012–2023
- EXPORTS BY COUNTRY
- EXPORT PRICES BY COUNTRY
-
10. PROFILES OF MAJOR PRODUCERS
The Largest Producers on The Market and Their Profiles
This Chapter is Available Only for the Professional Edition PRO -
11. COUNTRY PROFILES
The Largest Markets And Their Profiles
This Chapter is Available Only for the Professional Edition PRO- United States
- China
- Japan
- Germany
- United Kingdom
- France
- Brazil
- Italy
- Russian Federation
- India
- Canada
- Australia
- Republic of Korea
- Spain
- Mexico
- Indonesia
- Netherlands
- Turkey
- Saudi Arabia
- Switzerland
- Sweden
- Nigeria
- Poland
- Belgium
- Argentina
- Norway
- Austria
- Thailand
- United Arab Emirates
- Colombia
- Denmark
- South Africa
- Malaysia
- Israel
- Singapore
- Egypt
- Philippines
- Finland
- Chile
- Ireland
- Pakistan
- Greece
- Portugal
- Kazakhstan
- Algeria
- Czech Republic
- Qatar
- Peru
- Romania
- Vietnam
-
LIST OF TABLES
- Key Findings In 2023
- Market Volume, In Physical Terms, 2012–2023
- Market Value, 2012–2023
- Per Capita Consumption, By Country, 2018–2023
- Production, In Physical Terms, By Country, 2012–2023
- Imports, In Physical Terms, By Country, 2012–2023
- Imports, In Value Terms, By Country, 2012–2023
- Import Prices, By Country Of Destination, 2012–2023
- Exports, In Physical Terms, By Country, 2012–2023
- Exports, In Value Terms, By Country, 2012–2023
- Export Prices, By Country Of Origin, 2012–2023
-
LIST OF FIGURES
- Market Volume, In Physical Terms, 2012–2023
- Market Value, 2012–2023
- Consumption, By Country, 2023
- Market Volume Forecast to 2030
- Market Value Forecast to 2030
- Products: Market Size And Growth, By Type
- Products: Average Per Capita Consumption, By Type
- Products: Exports And Growth, By Type
- Products: Export Prices And Growth, By Type
- Production Volume And Growth
- Exports And Growth
- Export Prices And Growth
- Market Size And Growth
- Per Capita Consumption
- Imports And Growth
- Import Prices
- Production, In Physical Terms, 2012–2023
- Production, In Value Terms, 2012–2023
- Production, By Country, 2023
- Production, In Physical Terms, By Country, 2012–2023
- Imports, In Physical Terms, 2012–2023
- Imports, In Value Terms, 2012–2023
- Imports, In Physical Terms, By Country, 2023
- Imports, In Physical Terms, By Country, 2012–2023
- Imports, In Value Terms, By Country, 2012–2023
- Import Prices, By Country, 2012–2023
- Exports, In Physical Terms, 2012–2023
- Exports, In Value Terms, 2012–2023
- Exports, In Physical Terms, By Country, 2023
- Exports, In Physical Terms, By Country, 2012–2023
- Exports, In Value Terms, By Country, 2012–2023
- Export Prices, 2012–2023


