
Italy - Cheese - Market Analysis, Forecast, Size, Trends and Insights
Get instant access to more than 2 million reports, dashboards, and datasets on the IndexBox Platform.
View PricingItaly's Cheese Export Rises by 2% Reaching $4.9 Billion in 2023
Italy Cheese Exports
After ten years of growth, shipments abroad of cheese decreased by -1.6% to 564K tons in 2023. In general, total exports indicated a buoyant expansion from 2013 to 2023: its volume increased at an average annual rate of +6.0% over the last decade. The trend pattern, however, indicated some noticeable fluctuations being recorded throughout the analyzed period. Based on 2023 figures, exports increased by +78.8% against 2013 indices. The pace of growth appeared the most rapid in 2021 with an increase of 14% against the previous year. Over the period under review, the exports hit record highs at 573K tons in 2022, and then reduced modestly in the following year.
In value terms, cheese exports rose slightly to $4.9B (IndexBox estimates) in 2023. Overall, total exports indicated a prominent increase from 2013 to 2023: its value increased at an average annual rate of +6.2% over the last decade. The trend pattern, however, indicated some noticeable fluctuations being recorded throughout the analyzed period. Based on 2023 figures, exports increased by +97.0% against 2015 indices. The growth pace was the most rapid in 2021 with an increase of 20%. The exports peaked in 2023 and are expected to retain growth in the near future.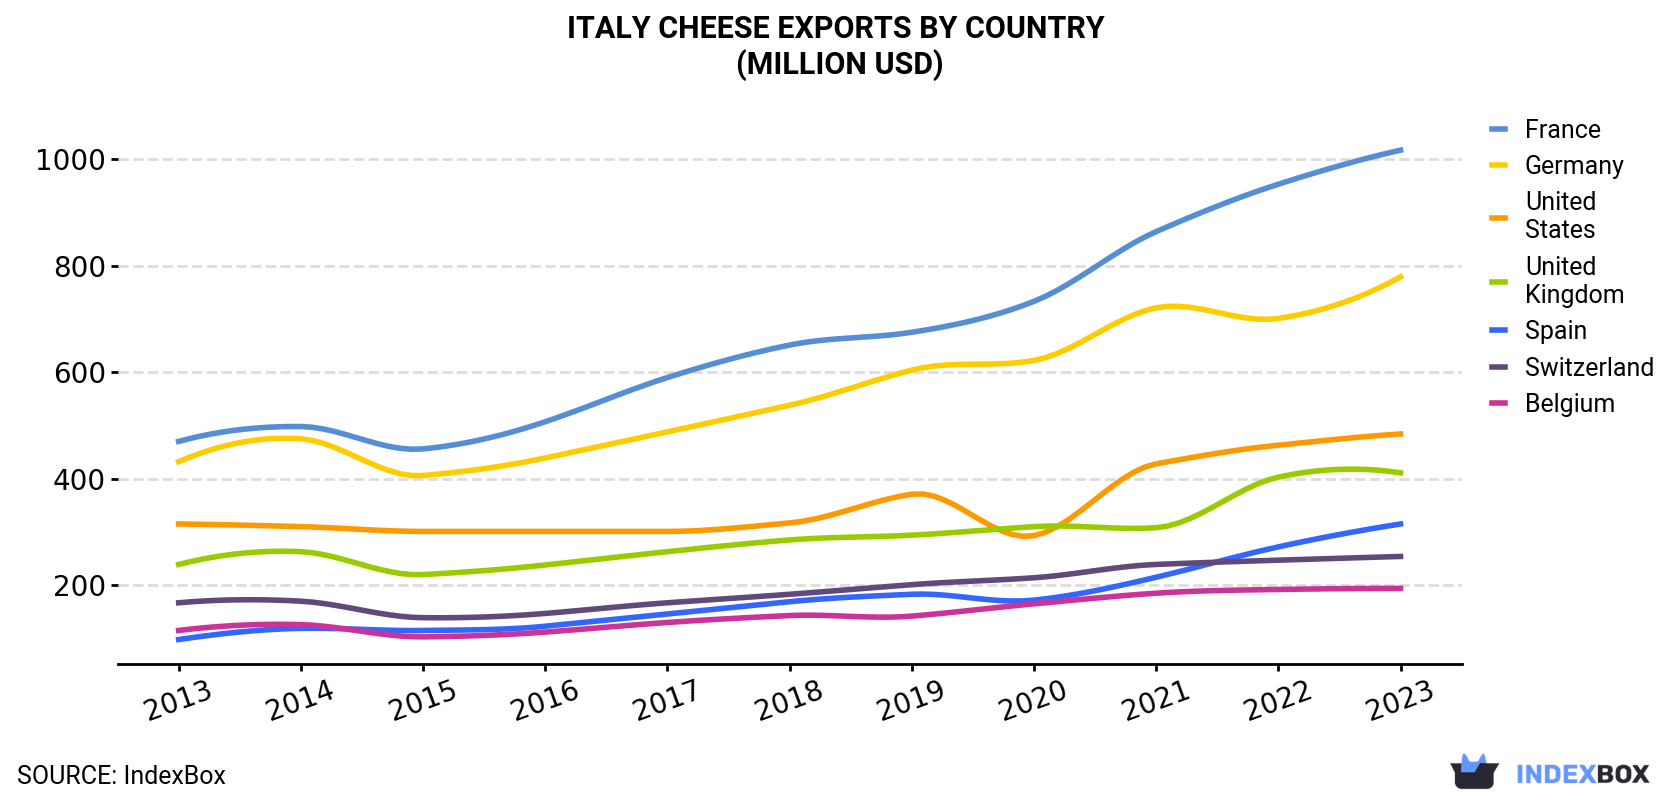
| COUNTRY | Export Value of Cheese in Italy (million USD) | ||||||||||
|---|---|---|---|---|---|---|---|---|---|---|---|
| 2013 | 2014 | 2015 | 2016 | 2017 | 2018 | 2019 | 2020 | 2021 | 2022 | 2023 | |
| France | 470 | 498 | 456 | 507 | 590 | 651 | 675 | 733 | 864 | 953 | 1,017 |
| Germany | 432 | 475 | 406 | 439 | 488 | 538 | 604 | 622 | 721 | 701 | 779 |
| United States | 315 | 310 | 301 | 301 | 301 | 317 | 371 | 293 | 428 | 463 | 484 |
| United Kingdom | 239 | 263 | 220 | 238 | 263 | 285 | 294 | 310 | 308 | 403 | 411 |
| Spain | 98.0 | 119 | 115 | 123 | 146 | 169 | 183 | 172 | 215 | 272 | 315 |
| Switzerland | 167 | 170 | 139 | 147 | 167 | 183 | 201 | 214 | 239 | 247 | 254 |
| Belgium | 115 | 126 | 103 | 112 | 130 | 143 | 142 | 165 | 185 | 192 | 194 |
| Others | 875 | 882 | 765 | 811 | 929 | 1,051 | 1,120 | 1,133 | 1,409 | 1,591 | 1,480 |
| Total | 2,712 | 2,841 | 2,505 | 2,679 | 3,014 | 3,337 | 3,589 | 3,643 | 4,368 | 4,822 | 4,934 |
Exports by Country
France (130K tons), Germany (80K tons) and the UK (45K tons) were the main destinations of cheese exports from Italy, with a combined 45% share of total exports. Spain, the United States, Switzerland and Belgium lagged somewhat behind, together accounting for a further 22%.
From 2013 to 2023, the biggest increases were recorded for Spain (with a CAGR of +11.4%), while shipments for the other leaders experienced more modest paces of growth.
In value terms, France ($1B), Germany ($779M) and the United States ($484M) were the largest markets for cheese exported from Italy worldwide, together comprising 46% of total exports. the UK, Spain, Switzerland and Belgium lagged somewhat behind, together comprising a further 24%.
In terms of the main countries of destination, Spain, with a CAGR of +12.4%, saw the highest growth rate of the value of exports, over the period under review, while shipments for the other leaders experienced more modest paces of growth.
Exports by Type
Unripened or uncured cheese (263K tons), cheese, other than blue-veined, grated, powdered or processed (204K tons) and cheese of all kinds, grated or powdered (61K tons) were the main products of cheese exports from Italy, together accounting for 94% of total exports.
From 2013 to 2023, the most notable rate of growth in terms of shipments, amongst the major product types, was attained by cheese of all kinds, grated or powdered (with a CAGR of +9.5%), while the other products experienced more modest paces of growth.
In value terms, cheese, other than blue-veined, grated, powdered or processed ($2.4B), unripened or uncured cheese ($1.6B) and cheese of all kinds, grated or powdered ($666M) appeared to be the most exported types of cheese from Italy worldwide, together comprising 95% of total exports.
Cheese of all kinds, grated or powdered, with a CAGR of +9.3%, recorded the highest rates of growth with regard to the value of exports, among the main product categories over the period under review, while shipments for the other products experienced more modest paces of growth.
Export Prices by Country
In 2023, the cheese price amounted to $8,748 per ton (FOB, Italy), picking up by 4% against the previous year. In general, the export price showed a relatively flat trend pattern. The pace of growth appeared the most rapid in 2018 when the average export price increased by 8.5% against the previous year. The export price peaked at $8,760 per ton in 2014; however, from 2015 to 2023, the export prices remained at a lower figure.
Prices varied noticeably by country of destination: amid the top suppliers, the country with the highest price was the United States ($16,030 per ton), while the average price for exports to Romania ($6,609 per ton) was amongst the lowest.
From 2013 to 2023, the most notable rate of growth in terms of prices was recorded for supplies to Poland (+2.9%), while the prices for the other major destinations experienced more modest paces of growth.
This report provides an in-depth analysis of the cheese market in Italy. Within it, you will discover the latest data on market trends and opportunities by country, consumption, production and price developments, as well as the global trade (imports and exports). The forecast exhibits the market prospects through 2030.
Product coverage:
- FCL 901 - Cheese from Whole Cow Milk
- FCL 904 - Cheese from Skimmed Cow Milk
- FCL 905 - Whey Cheese
- FCL 907 - Processed Cheese
- FCL 955 - Cheese of Buffalo Milk
- FCL 984 - Cheese of Sheep Milk
- FCL 1021 - Cheese of Goat Milk
Country coverage:
- Italy
Data coverage:
- Market volume and value
- Per Capita consumption
- Forecast of the market dynamics in the medium term
- Trade (exports and imports) in Italy
- Export and import prices
- Market trends, drivers and restraints
- Key market players and their profiles
Reasons to buy this report:
- Take advantage of the latest data
- Find deeper insights into current market developments
- Discover vital success factors affecting the market
This report is designed for manufacturers, distributors, importers, and wholesalers, as well as for investors, consultants and advisors.
In this report, you can find information that helps you to make informed decisions on the following issues:
- How to diversify your business and benefit from new market opportunities
- How to load your idle production capacity
- How to boost your sales on overseas markets
- How to increase your profit margins
- How to make your supply chain more sustainable
- How to reduce your production and supply chain costs
- How to outsource production to other countries
- How to prepare your business for global expansion
While doing this research, we combine the accumulated expertise of our analysts and the capabilities of artificial intelligence. The AI-based platform, developed by our data scientists, constitutes the key working tool for business analysts, empowering them to discover deep insights and ideas from the marketing data.
-
1. INTRODUCTION
Making Data-Driven Decisions to Grow Your Business
- REPORT DESCRIPTION
- RESEARCH METHODOLOGY AND AI PLATFORM
- DATA-DRIVEN DECISIONS FOR YOUR BUSINESS
- GLOSSARY AND SPECIFIC TERMS
-
2. EXECUTIVE SUMMARY
A Quick Overview of Market Performance
- KEY FINDINGS
- MARKET TRENDS This Chapter is Available Only for the Professional Edition PRO
-
3. MARKET OVERVIEW
Understanding the Current State of The Market and Its Prospects
- MARKET SIZE
- MARKET STRUCTURE
- TRADE BALANCE
- PER CAPITA CONSUMPTION
- MARKET FORECAST TO 2030
-
4. MOST PROMISING PRODUCT
Finding New Products to Diversify Your Business
This Chapter is Available Only for the Professional Edition PRO- TOP PRODUCTS TO DIVERSIFY YOUR BUSINESS
- BEST-SELLING PRODUCTS
- MOST CONSUMED PRODUCT
- MOST TRADED PRODUCT
- MOST PROFITABLE PRODUCT FOR EXPORT
-
5. MOST PROMISING SUPPLYING COUNTRIES
Choosing the Best Countries to Establish Your Sustainable Supply Chain
This Chapter is Available Only for the Professional Edition PRO- TOP COUNTRIES TO SOURCE YOUR PRODUCT
- TOP PRODUCING COUNTRIES
- TOP EXPORTING COUNTRIES
- LOW-COST EXPORTING COUNTRIES
-
6. MOST PROMISING OVERSEAS MARKETS
Choosing the Best Countries to Boost Your Exports
This Chapter is Available Only for the Professional Edition PRO- TOP OVERSEAS MARKETS FOR EXPORTING YOUR PRODUCT
- TOP CONSUMING MARKETS
- UNSATURATED MARKETS
- TOP IMPORTING MARKETS
- MOST PROFITABLE MARKETS
7. PRODUCTION
The Latest Trends and Insights into The Industry
- PRODUCTION VOLUME AND VALUE
8. IMPORTS
The Largest Import Supplying Countries
- IMPORTS FROM 2012–2023
- IMPORTS BY COUNTRY
- IMPORT PRICES BY COUNTRY
9. EXPORTS
The Largest Destinations for Exports
- EXPORTS FROM 2012–2023
- EXPORTS BY COUNTRY
- EXPORT PRICES BY COUNTRY
-
10. PROFILES OF MAJOR PRODUCERS
The Largest Producers on The Market and Their Profiles
This Chapter is Available Only for the Professional Edition PRO -
LIST OF TABLES
- Key Findings In 2023
- Market Volume, In Physical Terms, 2012–2023
- Market Value, 2012–2023
- Per Capita Consumption In 2012-2023
- Imports, In Physical Terms, By Country, 2012–2023
- Imports, In Value Terms, By Country, 2012–2023
- Import Prices, By Country Of Origin, 2012–2023
- Exports, In Physical Terms, By Country, 2012–2023
- Exports, In Value Terms, By Country, 2012–2023
- Export Prices, By Country Of Destination, 2012–2023
-
LIST OF FIGURES
- Market Volume, In Physical Terms, 2012–2023
- Market Value, 2012–2023
- Market Structure – Domestic Supply vs. Imports, In Physical Terms, 2012-2023
- Market Structure – Domestic Supply vs. Imports, In Value Terms, 2012-2023
- Trade Balance, In Physical Terms, 2012-2023
- Trade Balance, In Value Terms, 2012-2023
- Per Capita Consumption, 2012-2023
- Market Volume Forecast to 2030
- Market Value Forecast to 2030
- Products: Market Size And Growth, By Type
- Products: Average Per Capita Consumption, By Type
- Products: Exports And Growth, By Type
- Products: Export Prices And Growth, By Type
- Production Volume And Growth
- Exports And Growth
- Export Prices And Growth
- Market Size And Growth
- Per Capita Consumption
- Imports And Growth
- Import Prices
- Production, In Physical Terms, 2012–2023
- Production, In Value Terms, 2012–2023
- Imports, In Physical Terms, 2012–2023
- Imports, In Value Terms, 2012–2023
- Imports, In Physical Terms, By Country, 2023
- Imports, In Physical Terms, By Country, 2012–2023
- Imports, In Value Terms, By Country, 2012–2023
- Import Prices, By Country Of Origin, 2012–2023
- Exports, In Physical Terms, 2012–2023
- Exports, In Value Terms, 2012–2023
- Exports, In Physical Terms, By Country, 2023
- Exports, In Physical Terms, By Country, 2012–2023
- Exports, In Value Terms, By Country, 2012–2023
- Export Prices, By Country Of Destination, 2012–2023


