World - Lentils - Market Analysis, Forecast, Size, Trends and Insights
Get instant access to more than 2 million reports, dashboards, and datasets on the IndexBox Platform.
View PricingGlobal Lentils Market: Steady Growth Expected with a CAGR of +2.4% from 2023-2030
IndexBox has just published a new report: World - Lentils - Market Analysis, Forecast, Size, Trends and Insights.
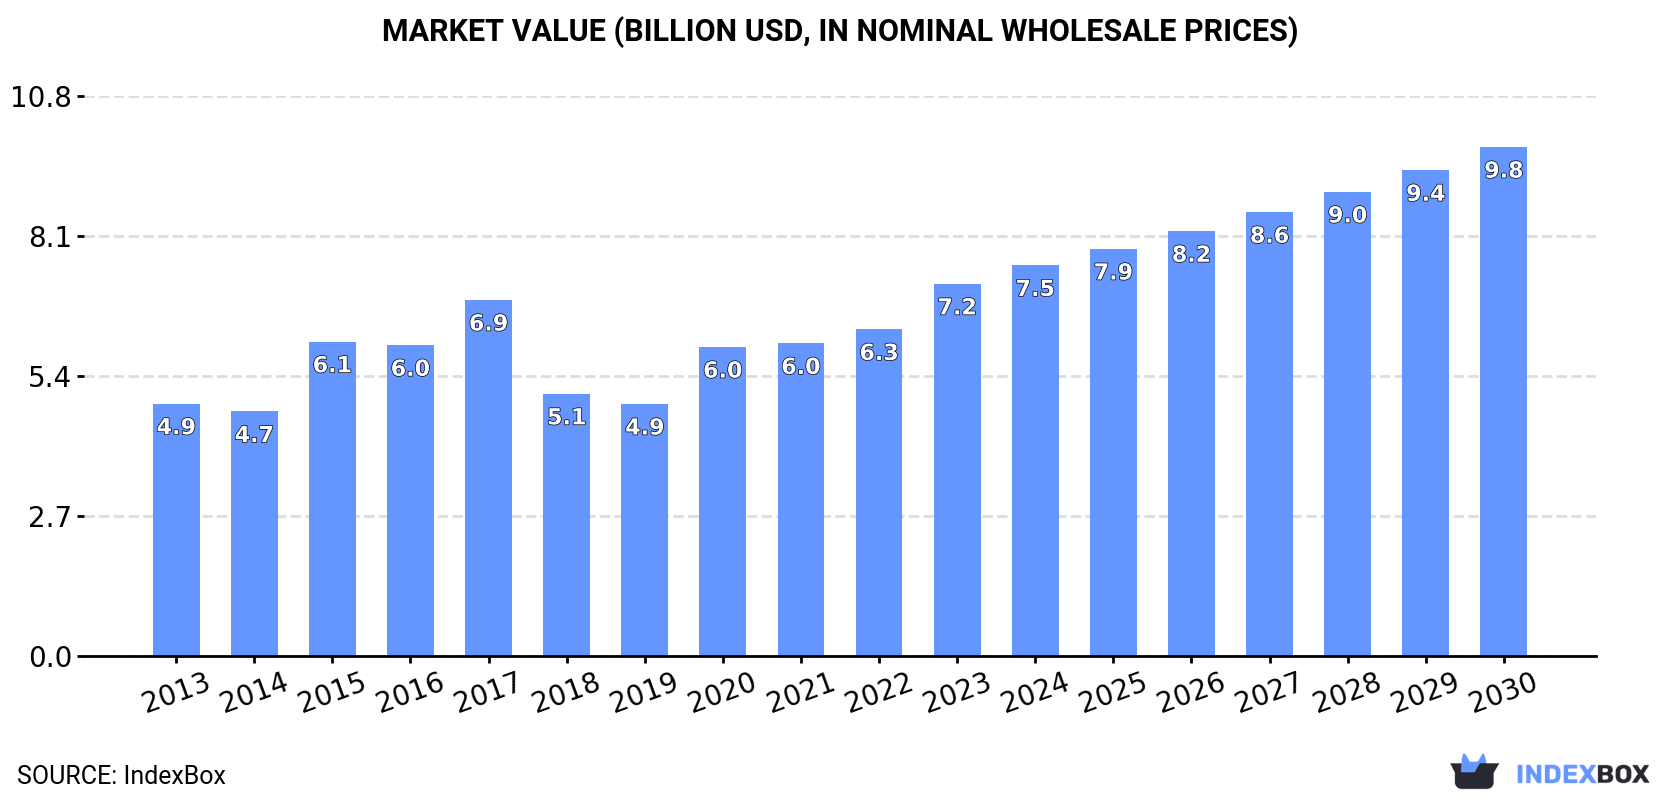
The article discusses the anticipated rise in consumption of lentils globally, with the market expected to grow steadily over the next seven years. By 2030, the market volume is projected to reach 10 million tons, while the market value is forecasted to hit $9.8 billion, reflecting a positive trend in the industry.
Market Forecast
Driven by increasing demand for lentils worldwide, the market is expected to continue an upward consumption trend over the next seven-year period. Market performance is forecast to decelerate, expanding with an anticipated CAGR of +2.4% for the period from 2023 to 2030, which is projected to bring the market volume to 10M tons by the end of 2030.
In value terms, the market is forecast to increase with an anticipated CAGR of +4.6% for the period from 2023 to 2030, which is projected to bring the market value to $9.8B (in nominal wholesale prices) by the end of 2030.
Consumption
World Consumption of Lentil
In 2023, the amount of lentils consumed worldwide reached 8.5M tons, growing by 12% compared with 2022. The total consumption volume increased at an average annual rate of +3.6% over the period from 2013 to 2023; however, the trend pattern indicated some noticeable fluctuations being recorded in certain years. Global consumption peaked in 2023 and is expected to retain growth in the immediate term.
The global lentil market size expanded sharply to $7.2B in 2023, with an increase of 14% against the previous year. This figure reflects the total revenues of producers and importers (excluding logistics costs, retail marketing costs, and retailers' margins, which will be included in the final consumer price). The market value increased at an average annual rate of +4.0% over the period from 2013 to 2023; however, the trend pattern indicated some noticeable fluctuations being recorded throughout the analyzed period. Global consumption peaked in 2023 and is likely to see steady growth in the near future.
Consumption By Country
India (2.9M tons) remains the largest lentil consuming country worldwide, comprising approx. 34% of total volume. Moreover, lentil consumption in India exceeded the figures recorded by the second-largest consumer, Australia (848K tons), threefold. Bangladesh (676K tons) ranked third in terms of total consumption with an 8% share.
In India, lentil consumption expanded at an average annual rate of +4.8% over the period from 2013-2023. In the other countries, the average annual rates were as follows: Australia (+2.4% per year) and Bangladesh (+9.9% per year).
In value terms, India ($3B) led the market, alone. The second position in the ranking was taken by Turkey ($460M). It was followed by Bangladesh.
From 2013 to 2023, the average annual growth rate of value in India totaled +4.2%. In the other countries, the average annual rates were as follows: Turkey (+3.9% per year) and Bangladesh (+9.2% per year).
The countries with the highest levels of lentil per capita consumption in 2023 were Australia (32 kg per person), the United Arab Emirates (23 kg per person) and Canada (10 kg per person).
From 2013 to 2023, the biggest increases were recorded for the United Arab Emirates (with a CAGR of +13.3%), while consumption for the other global leaders experienced more modest paces of growth.
Production
World Production of Lentil
In 2023, approx. 8.6M tons of lentils were produced worldwide; increasing by 10% compared with the year before. The total output volume increased at an average annual rate of +3.4% from 2013 to 2023; the trend pattern remained consistent, with somewhat noticeable fluctuations being recorded throughout the analyzed period. The most prominent rate of growth was recorded in 2020 with an increase of 17%. Over the period under review, global production hit record highs in 2023 and is expected to retain growth in the near future. The general positive trend in terms output was largely conditioned by a perceptible increase of the harvested area and a relatively flat trend pattern in yield figures.
In value terms, lentil production stood at $5B in 2023 estimated in export price. The total output value increased at an average annual rate of +1.1% from 2013 to 2023; the trend pattern indicated some noticeable fluctuations being recorded in certain years. The growth pace was the most rapid in 2015 with an increase of 32%. Global production peaked at $5.9B in 2016; however, from 2017 to 2023, production failed to regain momentum.
Production By Country
The countries with the highest volumes of production in 2023 were Australia (2.8M tons), Canada (2.3M tons) and India (1.4M tons), together comprising 75% of global production. Turkey, Nepal, Russia, the United States, Bangladesh, China and Kazakhstan lagged somewhat behind, together accounting for a further 18%.
From 2013 to 2023, the biggest increases were recorded for Russia (with a CAGR of +29.3%), while production for the other global leaders experienced more modest paces of growth.
Yield
The global average lentil yield expanded significantly to 1.6 tons per ha in 2023, growing by 13% compared with the year before. In general, the yield saw a relatively flat trend pattern. The growth pace was the most rapid in 2020 with an increase of 13%. As a result, the yield reached the peak level of 1.6 tons per ha; afterwards, it flattened through to 2023.
Harvested Area
In 2023, the global harvested area of lentils shrank to 5.5M ha, with a decrease of -1.9% on the year before. The harvested area increased at an average annual rate of +3.0% from 2013 to 2023; however, the trend pattern indicated some noticeable fluctuations being recorded in certain years. The pace of growth was the most pronounced in 2016 with an increase of 15%. The global harvested area peaked at 5.8M ha in 2017; however, from 2018 to 2023, the harvested area failed to regain momentum.
Imports
World Imports of Lentil
In 2023, purchases abroad of lentils increased by 43% to 5.4M tons for the first time since 2020, thus ending a two-year declining trend. Over the period under review, total imports indicated a prominent increase from 2013 to 2023: its volume increased at an average annual rate of +7.6% over the last decade. The trend pattern, however, indicated some noticeable fluctuations being recorded throughout the analyzed period. As a result, imports reached the peak and are likely to continue growth in the immediate term.
In value terms, lentil imports surged to $4.5B in 2023. Overall, imports recorded a resilient increase. The pace of growth appeared the most rapid in 2020 with an increase of 52%. Global imports peaked in 2023 and are likely to continue growth in the immediate term.
Imports By Country
In 2023, India (1.7M tons) represented the largest importer of lentils, making up 31% of total imports. Turkey (860K tons) held a 16% share (based on physical terms) of total imports, which put it in second place, followed by Bangladesh (9%) and the United Arab Emirates (6.5%). Sri Lanka (200K tons), Pakistan (151K tons), Canada (116K tons), Egypt (113K tons), Morocco (109K tons) and Iraq (98K tons) followed a long way behind the leaders.
From 2013 to 2023, the most notable rate of growth in terms of purchases, amongst the leading importing countries, was attained by Morocco (with a CAGR of +33.9%), while imports for the other global leaders experienced more modest paces of growth.
In value terms, India ($1.2B) constitutes the largest market for imported lentils worldwide, comprising 28% of global imports. The second position in the ranking was held by Turkey ($613M), with a 14% share of global imports. It was followed by Bangladesh, with a 7.3% share.
In India, lentil imports expanded at an average annual rate of +11.0% over the period from 2013-2023. The remaining importing countries recorded the following average annual rates of imports growth: Turkey (+13.6% per year) and Bangladesh (+10.1% per year).
Import Prices By Country
The average lentil import price stood at $823 per ton in 2023, declining by -11.1% against the previous year. Over the period under review, import price indicated a slight expansion from 2013 to 2023: its price increased at an average annual rate of +1.1% over the last decade. The trend pattern, however, indicated some noticeable fluctuations being recorded throughout the analyzed period. Based on 2023 figures, lentil import price increased by +64.5% against 2019 indices. The pace of growth appeared the most rapid in 2021 when the average import price increased by 27% against the previous year. Over the period under review, average import prices attained the peak figure at $926 per ton in 2022, and then fell in the following year.
Prices varied noticeably by country of destination: amid the top importers, the country with the highest price was Egypt ($1,189 per ton), while Bangladesh ($665 per ton) was amongst the lowest.
From 2013 to 2023, the most notable rate of growth in terms of prices was attained by Egypt (+27.2%), while the other global leaders experienced more modest paces of growth.
Exports
World Exports of Lentil
Global lentil exports soared to 5.5M tons in 2023, increasing by 38% against the previous year's figure. In general, total exports indicated prominent growth from 2013 to 2023: its volume increased at an average annual rate of +7.0% over the last decade. The trend pattern, however, indicated some noticeable fluctuations being recorded throughout the analyzed period. Based on 2023 figures, exports increased by +48.0% against 2021 indices. As a result, the exports reached the peak and are likely to continue growth in the immediate term.
In value terms, lentil exports skyrocketed to $4.4B in 2023. Over the period under review, exports enjoyed a remarkable increase. The growth pace was the most rapid in 2020 when exports increased by 64% against the previous year. The global exports peaked in 2023 and are likely to continue growth in years to come.
Exports By Country
In 2023, Canada (2M tons) and Australia (1.9M tons) were the main exporters of lentilsacross the globe, together generating 71% of total exports. Turkey (569K tons) held the next position in the ranking, followed by the United States (264K tons). All these countries together held approx. 15% share of total exports. The following exporters - Russia (172K tons), India (164K tons) and Kazakhstan (159K tons) - each reached a 9% share of total exports.
From 2013 to 2023, the biggest increases were recorded for India (with a CAGR of +69.5%), while shipments for the other global leaders experienced more modest paces of growth.
In value terms, Canada ($1.7B), Australia ($1.2B) and Turkey ($559M) constituted the countries with the highest levels of exports in 2023, with a combined 79% share of global exports. The United States, India, Russia and Kazakhstan lagged somewhat behind, together comprising a further 14%.
In terms of the main exporting countries, India, with a CAGR of +64.8%, recorded the highest growth rate of the value of exports, over the period under review, while shipments for the other global leaders experienced more modest paces of growth.
Export Prices By Country
In 2023, the average lentil export price amounted to $798 per ton, which is down by -8.4% against the previous year. In general, export price indicated a mild increase from 2013 to 2023: its price increased at an average annual rate of +1.5% over the last decade. The trend pattern, however, indicated some noticeable fluctuations being recorded throughout the analyzed period. Based on 2023 figures, lentil export price increased by +70.9% against 2019 indices. The most prominent rate of growth was recorded in 2021 an increase of 29%. The global export price peaked at $870 per ton in 2022, and then contracted in the following year.
Prices varied noticeably by country of origin: amid the top suppliers, the country with the highest price was the United States ($1,017 per ton), while Kazakhstan ($551 per ton) was amongst the lowest.
From 2013 to 2023, the most notable rate of growth in terms of prices was attained by the United States (+4.6%), while the other global leaders experienced more modest paces of growth.
This report provides an in-depth analysis of the global lentil market. Within it, you will discover the latest data on market trends and opportunities by country, consumption, production and price developments, as well as the global trade (imports and exports). The forecast exhibits the market prospects through 2030.
Product coverage:
- FCL 201 - Lentils, dry
Country coverage:
Worldwide - the report contains statistical data for 200 countries and includes detailed profiles of the 50 largest consuming countries:
- USA
- China
- Japan
- Germany
- United Kingdom
- France
- Brazil
- Italy
- Russian Federation
- India
- Canada
- Australia
- Republic of Korea
- Spain
- Mexico
- Indonesia
- Netherlands
- Turkey
- Saudi Arabia
- Switzerland
- Sweden
- Nigeria
- Poland
- Belgium
- Argentina
- Norway
- Austria
- Thailand
- United Arab Emirates
- Colombia
- Denmark
- South Africa
- Malaysia
- Israel
- Singapore
- Egypt
- Philippines
- Finland
- Chile
- Ireland
- Pakistan
- Greece
- Portugal
- Kazakhstan
- Algeria
- Czech Republic
- Qatar
- Peru
- Romania
- Vietnam
+ the largest producing countries
Data coverage:
- Global market volume and value
- Per Capita consumption
- Forecast of the market dynamics in the medium term
- Global production, split by region and country
- Global trade (exports and imports)
- Export and import prices
- Market trends, drivers and restraints
- Key market players and their profiles
Reasons to buy this report:
- Take advantage of the latest data
- Find deeper insights into current market developments
- Discover vital success factors affecting the market
This report is designed for manufacturers, distributors, importers, and wholesalers, as well as for investors, consultants and advisors.
In this report, you can find information that helps you to make informed decisions on the following issues:
- How to diversify your business and benefit from new market opportunities
- How to load your idle production capacity
- How to boost your sales on overseas markets
- How to increase your profit margins
- How to make your supply chain more sustainable
- How to reduce your production and supply chain costs
- How to outsource production to other countries
- How to prepare your business for global expansion
While doing this research, we combine the accumulated expertise of our analysts and the capabilities of artificial intelligence. The AI-based platform, developed by our data scientists, constitutes the key working tool for business analysts, empowering them to discover deep insights and ideas from the marketing data.
-
1. INTRODUCTION
Making Data-Driven Decisions to Grow Your Business
- REPORT DESCRIPTION
- RESEARCH METHODOLOGY AND AI PLATFORM
- DATA-DRIVEN DECISIONS FOR YOUR BUSINESS
- GLOSSARY AND SPECIFIC TERMS
-
2. EXECUTIVE SUMMARY
A Quick Overview of Market Performance
- KEY FINDINGS
- MARKET TRENDS This Chapter is Available Only for the Professional Edition PRO
-
3. MARKET OVERVIEW
Understanding the Current State of The Market and Its Prospects
- MARKET SIZE
- CONSUMPTION BY COUNTRY
- MARKET FORECAST TO 2030
-
4. MOST PROMISING PRODUCT
Finding New Products to Diversify Your Business
This Chapter is Available Only for the Professional Edition PRO- TOP PRODUCTS TO DIVERSIFY YOUR BUSINESS
- BEST-SELLING PRODUCTS
- MOST CONSUMED PRODUCT
- MOST TRADED PRODUCT
- MOST PROFITABLE PRODUCT FOR EXPORT
-
5. MOST PROMISING SUPPLYING COUNTRIES
Choosing the Best Countries to Establish Your Sustainable Supply Chain
This Chapter is Available Only for the Professional Edition PRO- TOP COUNTRIES TO SOURCE YOUR PRODUCT
- TOP PRODUCING COUNTRIES
- COUNTRIES WITH TOP YIELDS
- TOP EXPORTING COUNTRIES
- LOW-COST EXPORTING COUNTRIES
-
6. MOST PROMISING OVERSEAS MARKETS
Choosing the Best Countries to Boost Your Exports
This Chapter is Available Only for the Professional Edition PRO- TOP OVERSEAS MARKETS FOR EXPORTING YOUR PRODUCT
- TOP CONSUMING MARKETS
- UNSATURATED MARKETS
- TOP IMPORTING MARKETS
- MOST PROFITABLE MARKETS
7. GLOBAL PRODUCTION
The Latest Trends and Insights into The Industry
- PRODUCTION VOLUME AND VALUE
- PRODUCTION BY COUNTRY
- HARVESTED AREA AND YIELD BY COUNTRY
8. GLOBAL IMPORTS
The Largest Importers on The Market and How They Succeed
- IMPORTS FROM 2012–2023
- IMPORTS BY COUNTRY
- IMPORT PRICES BY COUNTRY
9. GLOBAL EXPORTS
The Largest Exporters on The Market and How They Succeed
- EXPORTS FROM 2012–2023
- EXPORTS BY COUNTRY
- EXPORT PRICES BY COUNTRY
-
10. PROFILES OF MAJOR PRODUCERS
The Largest Producers on The Market and Their Profiles
This Chapter is Available Only for the Professional Edition PRO -
11. COUNTRY PROFILES
The Largest Markets And Their Profiles
This Chapter is Available Only for the Professional Edition PRO- United States
- China
- Japan
- Germany
- United Kingdom
- France
- Brazil
- Italy
- Russian Federation
- India
- Canada
- Australia
- Republic of Korea
- Spain
- Mexico
- Indonesia
- Netherlands
- Turkey
- Saudi Arabia
- Switzerland
- Sweden
- Nigeria
- Poland
- Belgium
- Argentina
- Norway
- Austria
- Thailand
- United Arab Emirates
- Colombia
- Denmark
- South Africa
- Malaysia
- Israel
- Singapore
- Egypt
- Philippines
- Finland
- Chile
- Ireland
- Pakistan
- Greece
- Portugal
- Kazakhstan
- Algeria
- Czech Republic
- Qatar
- Peru
- Romania
- Vietnam
-
LIST OF TABLES
- Key Findings In 2023
- Market Volume, In Physical Terms, 2012–2023
- Market Value, 2012–2023
- Per Capita Consumption, By Country, 2018–2023
- Production, In Physical Terms, By Country, 2012–2023
- Harvested Area, By Country, 2012-2023
- Yield, By Country, 2012-2023
- Imports, In Physical Terms, By Country, 2012–2023
- Imports, In Value Terms, By Country, 2012–2023
- Import Prices, By Country Of Destination, 2012–2023
- Exports, In Physical Terms, By Country, 2012–2023
- Exports, In Value Terms, By Country, 2012–2023
- Export Prices, By Country Of Origin, 2012–2023
-
LIST OF FIGURES
- Market Volume, In Physical Terms, 2012–2023
- Market Value, 2012–2023
- Consumption, By Country, 2023
- Market Volume Forecast to 2030
- Market Value Forecast to 2030
- Products: Market Size And Growth, By Type
- Products: Average Per Capita Consumption, By Type
- Products: Exports And Growth, By Type
- Products: Export Prices And Growth, By Type
- Production Volume And Growth
- Yield And Growth
- Exports And Growth
- Export Prices And Growth
- Market Size And Growth
- Per Capita Consumption
- Imports And Growth
- Import Prices
- Production, In Physical Terms, 2012–2023
- Production, In Value Terms, 2012–2023
- Area Harvested, 2012–2023
- Yield, 2012–2023
- Production, By Country, 2023
- Production, In Physical Terms, By Country, 2012–2023
- Harvested Area, By Country, 2023
- Harvested Area, By Country, 2012-2023
- Yield, By Country, 2012-2023
- Imports, In Physical Terms, 2012–2023
- Imports, In Value Terms, 2012–2023
- Imports, In Physical Terms, By Country, 2023
- Imports, In Physical Terms, By Country, 2012–2023
- Imports, In Value Terms, By Country, 2012–2023
- Import Prices, By Country, 2012–2023
- Exports, In Physical Terms, 2012–2023
- Exports, In Value Terms, 2012–2023
- Exports, In Physical Terms, By Country, 2023
- Exports, In Physical Terms, By Country, 2012–2023
- Exports, In Value Terms, By Country, 2012–2023
- Export Prices, 2012–2023


