
World - Marble And Travertine - Market Analysis, Forecast, Size, Trends and Insights
Get instant access to more than 2 million reports, dashboards, and datasets on the IndexBox Platform.
View PricingGlobal Marble and Travertine Market to Surge with Anticipated CAGR of +1.4% by 2030
IndexBox has just published a new report: World - Marble And Travertine - Market Analysis, Forecast, Size, Trends and Insights.
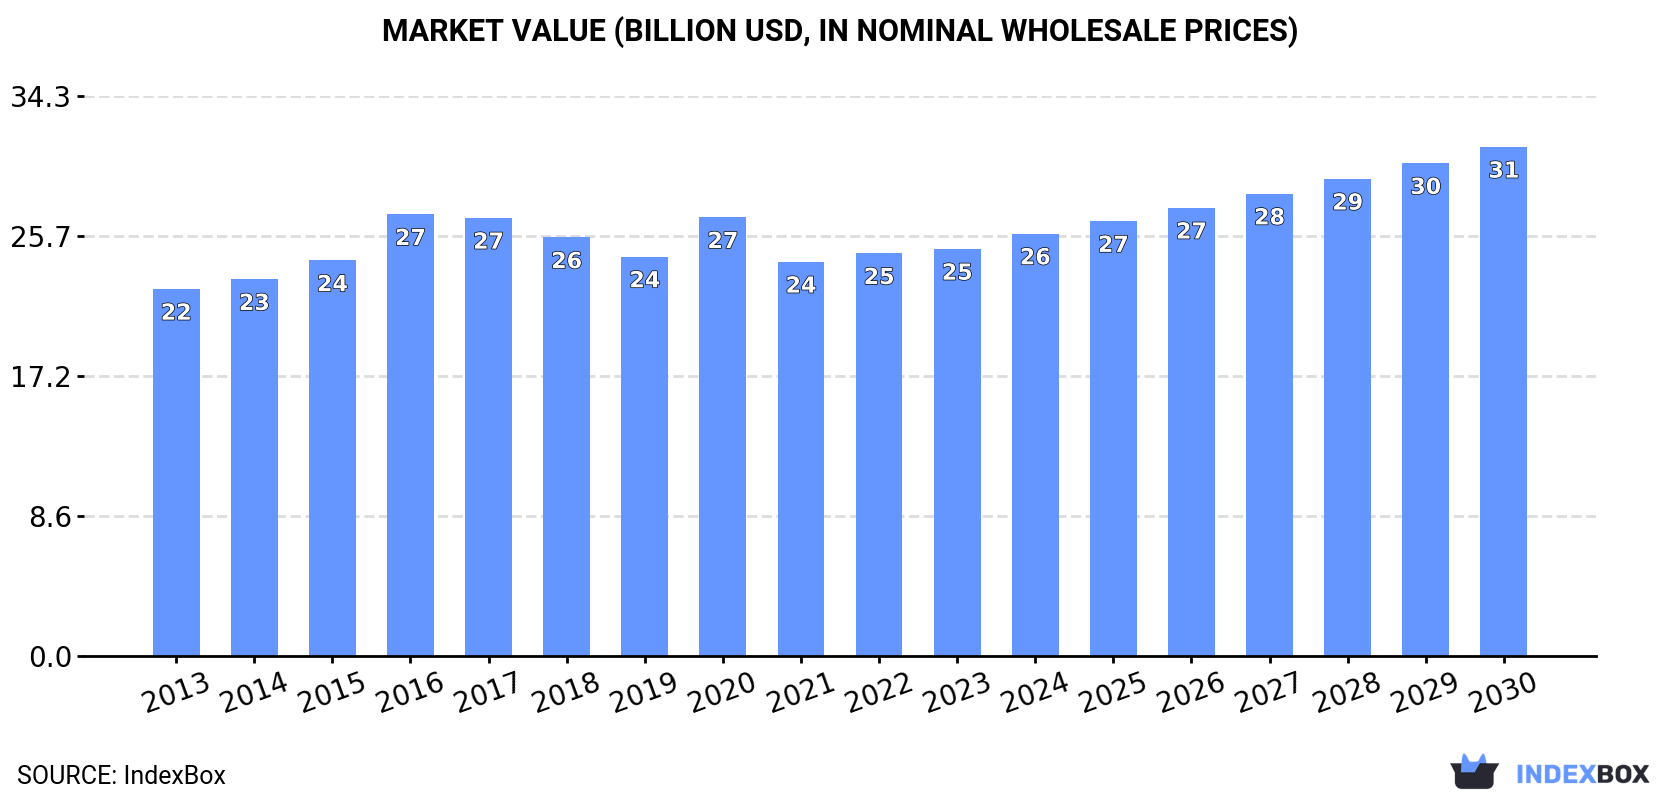
The global market for marble and travertine is expected to see continued growth driven by rising demand worldwide. By 2030, the market volume is projected to reach 77M tons, with a market value of $31.2B. This growth is anticipated to be propelled by a CAGR of +3.2% in value terms, indicating a promising outlook for the industry.
Market Forecast
Driven by increasing demand for marble and travertine worldwide, the market is expected to continue an upward consumption trend over the next seven years. Market performance is forecast to accelerate, expanding with an anticipated CAGR of +1.4% for the period from 2023 to 2030, which is projected to bring the market volume to 77M tons by the end of 2030.
In value terms, the market is forecast to increase with an anticipated CAGR of +3.2% for the period from 2023 to 2030, which is projected to bring the market value to $31.2B (in nominal wholesale prices) by the end of 2030.
Consumption
World Consumption of Marble And Travertine
In 2023, consumption of marble and travertine decreased by -1.2% to 69M tons for the first time since 2020, thus ending a two-year rising trend. In general, consumption, however, saw a relatively flat trend pattern. Over the period under review, global consumption attained the peak volume at 83M tons in 2017; however, from 2018 to 2023, consumption failed to regain momentum.
The global marble and travertine market size amounted to $24.9B in 2023, remaining constant against the previous year. This figure reflects the total revenues of producers and importers (excluding logistics costs, retail marketing costs, and retailers' margins, which will be included in the final consumer price). The market value increased at an average annual rate of +1.0% from 2013 to 2023; the trend pattern remained consistent, with somewhat noticeable fluctuations in certain years. As a result, consumption attained the peak level of $27.1B. From 2017 to 2023, the growth of the global market remained at a somewhat lower figure.
Consumption By Country
The countries with the highest volumes of consumption in 2023 were China (12M tons), the United States (7.5M tons) and India (4.8M tons), together accounting for 34% of global consumption. Spain, Romania, Russia, Pakistan, Nigeria, Indonesia, Turkey, France, Mexico and Italy lagged somewhat behind, together accounting for a further 28%.
From 2013 to 2023, the biggest increases were recorded for Turkey (with a CAGR of +5.2%), while consumption for the other global leaders experienced more modest paces of growth.
In value terms, the United States ($4.6B), China ($3.1B) and Romania ($1.5B) were the countries with the highest levels of market value in 2023, together comprising 37% of the global market. Mexico, Nigeria, India, Spain, Italy, Pakistan, Turkey, Russia, Indonesia and France lagged somewhat behind, together comprising a further 25%.
Among the main consuming countries, Nigeria, with a CAGR of +6.0%, saw the highest rates of growth with regard to market size over the period under review, while market for the other global leaders experienced more modest paces of growth.
In 2023, the highest levels of marble and travertine per capita consumption was registered in Romania (128 kg per person), followed by Spain (59 kg per person), France (22 kg per person) and the United States (22 kg per person), while the world average per capita consumption of marble and travertine was estimated at 8.7 kg per person.
From 2013 to 2023, the average annual growth rate of the marble and travertine per capita consumption in Romania totaled -5.4%. The remaining consuming countries recorded the following average annual rates of per capita consumption growth: Spain (+2.0% per year) and France (+1.0% per year).
Production
World Production of Marble And Travertine
In 2023, production of marble and travertine decreased by less than 0.1% to 70M tons for the first time since 2020, thus ending a two-year rising trend. Overall, production, however, recorded a relatively flat trend pattern. The growth pace was the most rapid in 2016 when the production volume increased by 11%. Global production peaked at 84M tons in 2017; however, from 2018 to 2023, production stood at a somewhat lower figure.
In value terms, marble and travertine production expanded modestly to $26.3B in 2023 estimated in export price. The total output value increased at an average annual rate of +1.4% from 2013 to 2023; the trend pattern remained relatively stable, with somewhat noticeable fluctuations in certain years. The pace of growth was the most pronounced in 2016 when the production volume increased by 11% against the previous year. As a result, production reached the peak level of $27.7B. From 2017 to 2023, global production growth remained at a lower figure.
Production By Country
The countries with the highest volumes of production in 2023 were the United States (7.5M tons), China (7.4M tons) and Turkey (5.3M tons), with a combined 29% share of global production.
From 2013 to 2023, the most notable rate of growth in terms of production, amongst the key producing countries, was attained by China (with a CAGR of +19.3%), while production for the other global leaders experienced more modest paces of growth.
Imports
World Imports of Marble And Travertine
Global marble and travertine imports declined to 7.5M tons in 2023, dropping by -11.9% compared with 2022 figures. Overall, imports saw a deep downturn. The pace of growth was the most pronounced in 2017 with an increase of 58% against the previous year. Global imports peaked at 13M tons in 2013; however, from 2014 to 2023, imports remained at a lower figure.
In value terms, marble and travertine imports shrank to $2B in 2023. In general, imports showed a noticeable shrinkage. The most prominent rate of growth was recorded in 2021 when imports increased by 39%. Global imports peaked at $2.8B in 2013; however, from 2014 to 2023, imports failed to regain momentum.
Imports By Country
China represented the key importing country with an import of around 4.2M tons, which finished at 57% of total imports. It was distantly followed by India (1.4M tons), achieving a 19% share of total imports. The following importers - Egypt (202K tons), Italy (197K tons) and Algeria (132K tons) - together made up 7.1% of total imports.
Imports into China decreased at an average annual rate of -7.8% from 2013 to 2023. At the same time, Egypt (+10.6%), India (+8.7%) and Algeria (+1.6%) displayed positive paces of growth. Moreover, Egypt emerged as the fastest-growing importer imported in the world, with a CAGR of +10.6% from 2013-2023. By contrast, Italy (-4.8%) illustrated a downward trend over the same period. India (+14 p.p.) and Egypt (+2.1 p.p.) significantly strengthened its position in terms of the global imports, while China saw its share reduced by -16.1% from 2013 to 2023, respectively. The shares of the other countries remained relatively stable throughout the analyzed period.
In value terms, China ($1.1B) constitutes the largest market for imported marble and travertine worldwide, comprising 57% of global imports. The second position in the ranking was taken by India ($319M), with a 16% share of global imports. It was followed by Italy, with a 4.3% share.
From 2013 to 2023, the average annual rate of growth in terms of value in China stood at -4.9%. The remaining importing countries recorded the following average annual rates of imports growth: India (+3.5% per year) and Italy (-2.9% per year).
Import Prices By Country
The average marble and travertine import price stood at $263 per ton in 2023, flattening at the previous year. Over the last decade, it increased at an average annual rate of +1.9%. The pace of growth was the most pronounced in 2016 when the average import price increased by 23%. Global import price peaked at $267 per ton in 2021; however, from 2022 to 2023, import prices stood at a somewhat lower figure.
Prices varied noticeably by country of destination: amid the top importers, the country with the highest price was Italy ($425 per ton), while Algeria ($168 per ton) was amongst the lowest.
From 2013 to 2023, the most notable rate of growth in terms of prices was attained by China (+3.1%), while the other global leaders experienced more modest paces of growth.
Exports
World Exports of Marble And Travertine
In 2023, approx. 8.4M tons of marble and travertine were exported worldwide; reducing by -2.1% on the previous year. Overall, exports saw a deep contraction. The growth pace was the most rapid in 2017 when exports increased by 25%. The global exports peaked at 14M tons in 2013; however, from 2014 to 2023, the exports remained at a lower figure.
In value terms, marble and travertine exports amounted to $1.9B in 2023. Over the period under review, exports continue to indicate a perceptible slump. The most prominent rate of growth was recorded in 2017 with an increase of 29%. Over the period under review, the global exports reached the peak figure at $2.9B in 2013; however, from 2014 to 2023, the exports failed to regain momentum.
Exports By Country
Turkey was the key exporting country with an export of around 3.4M tons, which reached 41% of total exports. Italy (878K tons) held the second position in the ranking, followed by Greece (633K tons), Portugal (592K tons) and Iran (526K tons). All these countries together held approx. 31% share of total exports. France (304K tons), Spain (234K tons), the United Arab Emirates (216K tons), India (204K tons) and North Macedonia (152K tons) held a relatively small share of total exports.
From 2013 to 2023, average annual rates of growth with regard to marble and travertine exports from Turkey stood at -5.0%. At the same time, the United Arab Emirates (+33.7%), France (+24.8%), North Macedonia (+9.1%) and Portugal (+1.0%) displayed positive paces of growth. Moreover, the United Arab Emirates emerged as the fastest-growing exporter exported in the world, with a CAGR of +33.7% from 2013-2023. Greece and Iran experienced a relatively flat trend pattern. By contrast, India (-1.5%), Italy (-4.7%) and Spain (-16.0%) illustrated a downward trend over the same period. France (+3.4 p.p.), Portugal (+3.2 p.p.), Greece (+2.9 p.p.), the United Arab Emirates (+2.5 p.p.) and Iran (+2.1 p.p.) significantly strengthened its position in terms of the global exports, while Spain saw its share reduced by -6.8% from 2013 to 2023, respectively. The shares of the other countries remained relatively stable throughout the analyzed period.
In value terms, the largest marble and travertine supplying countries worldwide were Turkey ($667M), Italy ($380M) and Greece ($164M), together comprising 62% of global exports. Iran, Portugal, the United Arab Emirates, Spain, North Macedonia, India and France lagged somewhat behind, together accounting for a further 23%.
Among the main exporting countries, the United Arab Emirates, with a CAGR of +34.8%, recorded the highest rates of growth with regard to the value of exports, over the period under review, while shipments for the other global leaders experienced more modest paces of growth.
Export Prices By Country
The average marble and travertine export price stood at $230 per ton in 2023, picking up by 6.8% against the previous year. Over the period from 2013 to 2023, it increased at an average annual rate of +1.2%. As a result, the export price attained the peak level and is likely to continue growth in the immediate term.
Prices varied noticeably by country of origin: amid the top suppliers, the country with the highest price was Italy ($433 per ton), while France ($28 per ton) was amongst the lowest.
From 2013 to 2023, the most notable rate of growth in terms of prices was attained by Italy (+3.4%), while the other global leaders experienced more modest paces of growth.
This report provides an in-depth analysis of the global marble and travertine market. Within it, you will discover the latest data on market trends and opportunities by country, consumption, production and price developments, as well as the global trade (imports and exports). The forecast exhibits the market prospects through 2030.
Product coverage:
- Prodcom 08111133 - Marble and travertine, crude or roughly trimmed
- Prodcom 08111136 - Marble and travertine merely cut into rectangular or square blocks or slabs
- Prodcom 08111150 - Ecaussine and other calcareous monumental or building stone of an apparent specific gravity . 2,5
Country coverage:
Worldwide - the report contains statistical data for 200 countries and includes detailed profiles of the 50 largest consuming countries:
- USA
- China
- Japan
- Germany
- United Kingdom
- France
- Brazil
- Italy
- Russian Federation
- India
- Canada
- Australia
- Republic of Korea
- Spain
- Mexico
- Indonesia
- Netherlands
- Turkey
- Saudi Arabia
- Switzerland
- Sweden
- Nigeria
- Poland
- Belgium
- Argentina
- Norway
- Austria
- Thailand
- United Arab Emirates
- Colombia
- Denmark
- South Africa
- Malaysia
- Israel
- Singapore
- Egypt
- Philippines
- Finland
- Chile
- Ireland
- Pakistan
- Greece
- Portugal
- Kazakhstan
- Algeria
- Czech Republic
- Qatar
- Peru
- Romania
- Vietnam
+ the largest producing countries
Data coverage:
- Global market volume and value
- Per Capita consumption
- Forecast of the market dynamics in the medium term
- Global production, split by region and country
- Global trade (exports and imports)
- Export and import prices
- Market trends, drivers and restraints
- Key market players and their profiles
Reasons to buy this report:
- Take advantage of the latest data
- Find deeper insights into current market developments
- Discover vital success factors affecting the market
This report is designed for manufacturers, distributors, importers, and wholesalers, as well as for investors, consultants and advisors.
In this report, you can find information that helps you to make informed decisions on the following issues:
- How to diversify your business and benefit from new market opportunities
- How to load your idle production capacity
- How to boost your sales on overseas markets
- How to increase your profit margins
- How to make your supply chain more sustainable
- How to reduce your production and supply chain costs
- How to outsource production to other countries
- How to prepare your business for global expansion
While doing this research, we combine the accumulated expertise of our analysts and the capabilities of artificial intelligence. The AI-based platform, developed by our data scientists, constitutes the key working tool for business analysts, empowering them to discover deep insights and ideas from the marketing data.
-
1. INTRODUCTION
Making Data-Driven Decisions to Grow Your Business
- REPORT DESCRIPTION
- RESEARCH METHODOLOGY AND AI PLATFORM
- DATA-DRIVEN DECISIONS FOR YOUR BUSINESS
- GLOSSARY AND SPECIFIC TERMS
-
2. EXECUTIVE SUMMARY
A Quick Overview of Market Performance
- KEY FINDINGS
- MARKET TRENDS This Chapter is Available Only for the Professional Edition PRO
-
3. MARKET OVERVIEW
Understanding the Current State of The Market and Its Prospects
- MARKET SIZE
- CONSUMPTION BY COUNTRY
- MARKET FORECAST TO 2030
-
4. MOST PROMISING PRODUCT
Finding New Products to Diversify Your Business
This Chapter is Available Only for the Professional Edition PRO- TOP PRODUCTS TO DIVERSIFY YOUR BUSINESS
- BEST-SELLING PRODUCTS
- MOST CONSUMED PRODUCT
- MOST TRADED PRODUCT
- MOST PROFITABLE PRODUCT FOR EXPORT
-
5. MOST PROMISING SUPPLYING COUNTRIES
Choosing the Best Countries to Establish Your Sustainable Supply Chain
This Chapter is Available Only for the Professional Edition PRO- TOP COUNTRIES TO SOURCE YOUR PRODUCT
- TOP PRODUCING COUNTRIES
- TOP EXPORTING COUNTRIES
- LOW-COST EXPORTING COUNTRIES
-
6. MOST PROMISING OVERSEAS MARKETS
Choosing the Best Countries to Boost Your Exports
This Chapter is Available Only for the Professional Edition PRO- TOP OVERSEAS MARKETS FOR EXPORTING YOUR PRODUCT
- TOP CONSUMING MARKETS
- UNSATURATED MARKETS
- TOP IMPORTING MARKETS
- MOST PROFITABLE MARKETS
7. GLOBAL PRODUCTION
The Latest Trends and Insights into The Industry
- PRODUCTION VOLUME AND VALUE
- PRODUCTION BY COUNTRY
8. GLOBAL IMPORTS
The Largest Importers on The Market and How They Succeed
- IMPORTS FROM 2012–2023
- IMPORTS BY COUNTRY
- IMPORT PRICES BY COUNTRY
9. GLOBAL EXPORTS
The Largest Exporters on The Market and How They Succeed
- EXPORTS FROM 2012–2023
- EXPORTS BY COUNTRY
- EXPORT PRICES BY COUNTRY
-
10. PROFILES OF MAJOR PRODUCERS
The Largest Producers on The Market and Their Profiles
This Chapter is Available Only for the Professional Edition PRO -
11. COUNTRY PROFILES
The Largest Markets And Their Profiles
This Chapter is Available Only for the Professional Edition PRO- United States
- China
- Japan
- Germany
- United Kingdom
- France
- Brazil
- Italy
- Russian Federation
- India
- Canada
- Australia
- Republic of Korea
- Spain
- Mexico
- Indonesia
- Netherlands
- Turkey
- Saudi Arabia
- Switzerland
- Sweden
- Nigeria
- Poland
- Belgium
- Argentina
- Norway
- Austria
- Thailand
- United Arab Emirates
- Colombia
- Denmark
- South Africa
- Malaysia
- Israel
- Singapore
- Egypt
- Philippines
- Finland
- Chile
- Ireland
- Pakistan
- Greece
- Portugal
- Kazakhstan
- Algeria
- Czech Republic
- Qatar
- Peru
- Romania
- Vietnam
-
LIST OF TABLES
- Key Findings In 2023
- Market Volume, In Physical Terms, 2012–2023
- Market Value, 2012–2023
- Per Capita Consumption, By Country, 2018–2023
- Production, In Physical Terms, By Country, 2012–2023
- Imports, In Physical Terms, By Country, 2012–2023
- Imports, In Value Terms, By Country, 2012–2023
- Import Prices, By Country Of Destination, 2012–2023
- Exports, In Physical Terms, By Country, 2012–2023
- Exports, In Value Terms, By Country, 2012–2023
- Export Prices, By Country Of Origin, 2012–2023
-
LIST OF FIGURES
- Market Volume, In Physical Terms, 2012–2023
- Market Value, 2012–2023
- Consumption, By Country, 2023
- Market Volume Forecast to 2030
- Market Value Forecast to 2030
- Products: Market Size And Growth, By Type
- Products: Average Per Capita Consumption, By Type
- Products: Exports And Growth, By Type
- Products: Export Prices And Growth, By Type
- Production Volume And Growth
- Exports And Growth
- Export Prices And Growth
- Market Size And Growth
- Per Capita Consumption
- Imports And Growth
- Import Prices
- Production, In Physical Terms, 2012–2023
- Production, In Value Terms, 2012–2023
- Production, By Country, 2023
- Production, In Physical Terms, By Country, 2012–2023
- Imports, In Physical Terms, 2012–2023
- Imports, In Value Terms, 2012–2023
- Imports, In Physical Terms, By Country, 2023
- Imports, In Physical Terms, By Country, 2012–2023
- Imports, In Value Terms, By Country, 2012–2023
- Import Prices, By Country, 2012–2023
- Exports, In Physical Terms, 2012–2023
- Exports, In Value Terms, 2012–2023
- Exports, In Physical Terms, By Country, 2023
- Exports, In Physical Terms, By Country, 2012–2023
- Exports, In Value Terms, By Country, 2012–2023
- Export Prices, 2012–2023


