
Mexico - Plastic Sacks And Bags - Market Analysis, Forecast, Size, Trends and Insights
Get instant access to more than 2 million reports, dashboards, and datasets on the IndexBox Platform.
View PricingMexican Plastic Bag Imports Fall to $707M in 2023
Mexico Plastic Bag Imports
In 2023, the amount of plastic sacks and bags imported into Mexico shrank modestly to 160K tons, reducing by -2.3% compared with the previous year. Over the period under review, imports saw a relatively flat trend pattern. The pace of growth was the most pronounced in 2022 when imports increased by 25%. As a result, imports attained the peak of 164K tons, and then reduced modestly in the following year.
In value terms, plastic bag imports fell to $707M (IndexBox estimates) in 2023. In general, total imports indicated a noticeable increase from 2013 to 2023: its value increased at an average annual rate of +4.7% over the last decade. The trend pattern, however, indicated some noticeable fluctuations being recorded throughout the analyzed period. Based on 2023 figures, imports increased by +58.9% against 2013 indices. The growth pace was the most rapid in 2021 when imports increased by 21% against the previous year. Over the period under review, imports attained the peak figure at $781M in 2022, and then reduced in the following year.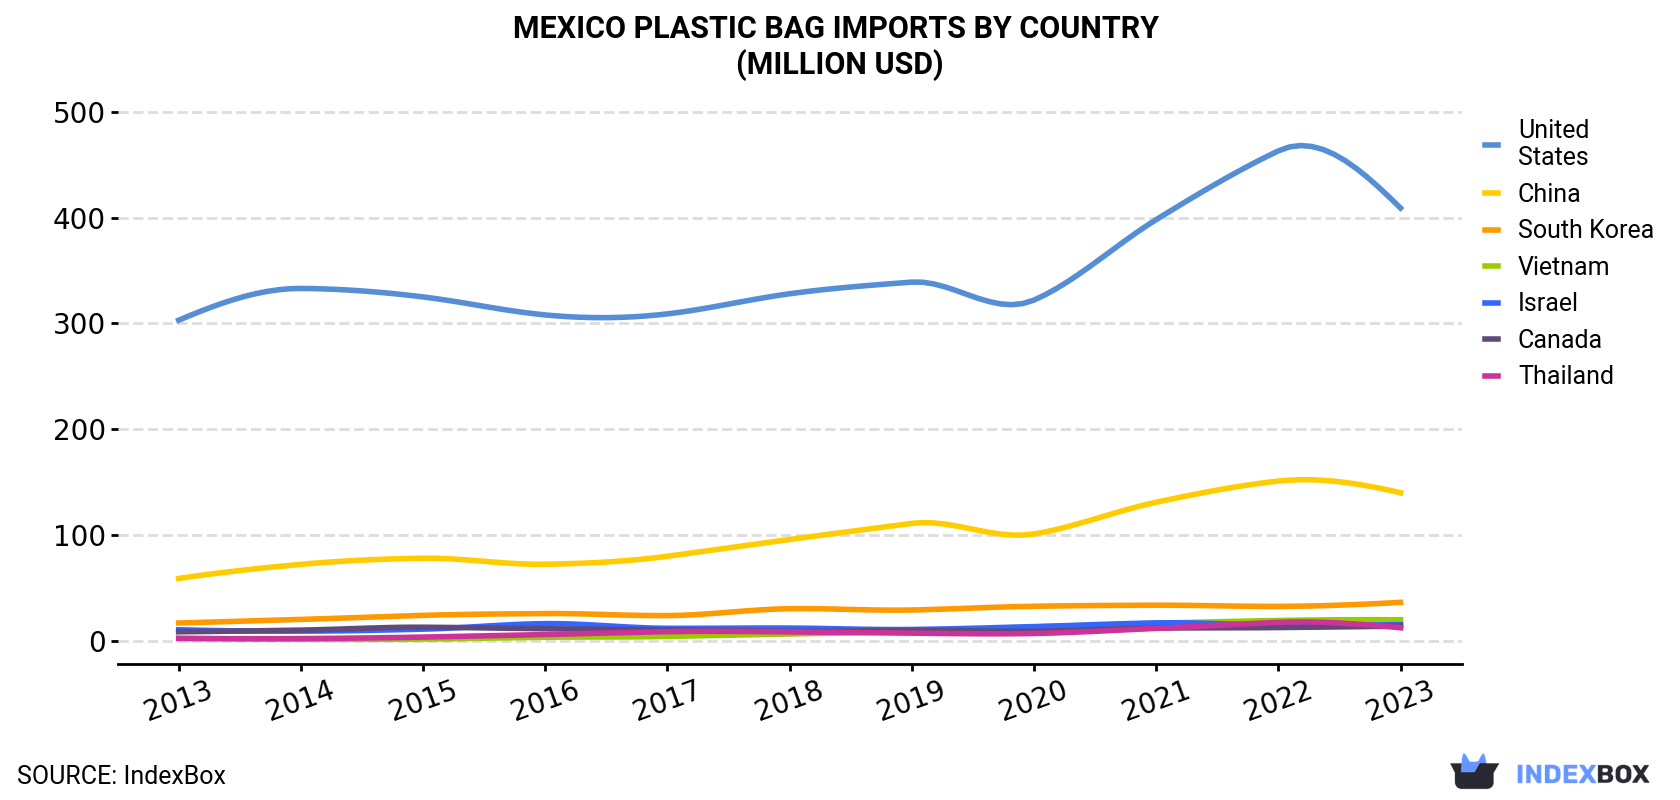
| COUNTRY | Import Value of Plastic Bag in Mexico (million USD) | ||||||||||
|---|---|---|---|---|---|---|---|---|---|---|---|
| 2013 | 2014 | 2015 | 2016 | 2017 | 2018 | 2019 | 2020 | 2021 | 2022 | 2023 | |
| United States | 303 | 333 | 325 | 308 | 309 | 328 | 339 | 322 | 398 | 463 | 409 |
| China | 59.0 | 72.3 | 78.1 | 72.4 | 80.0 | 95.8 | 111 | 101 | 131 | 151 | 140 |
| South Korea | 16.9 | 20.3 | 24.1 | 25.8 | 23.9 | 30.4 | 29.2 | 32.7 | 33.7 | 32.6 | 36.4 |
| Vietnam | 2.3 | 1.6 | 1.7 | 3.4 | 4.2 | 6.5 | 8.8 | 13.2 | 16.6 | 19.3 | 20.0 |
| Israel | 10.5 | 9.2 | 11.1 | 16.3 | 11.9 | 12.1 | 10.8 | 13.5 | 17.0 | 14.9 | 15.4 |
| Canada | 8.6 | 10.2 | 12.9 | 11.5 | 10.3 | 9.1 | 9.9 | 9.1 | 12.1 | 12.6 | 14.0 |
| Thailand | 2.4 | 2.2 | 3.6 | 6.0 | 8.7 | 8.5 | 7.3 | 7.0 | 11.8 | 17.5 | 12.4 |
| Others | 42.2 | 46.5 | 51.5 | 55.1 | 59.8 | 62.3 | 66.6 | 66.0 | 62.2 | 69.2 | 59.0 |
| Total | 445 | 495 | 508 | 499 | 508 | 553 | 582 | 564 | 682 | 781 | 707 |
Imports by Country
the United States (88K tons), China (48K tons) and South Korea (4.5K tons) were the main suppliers of plastic bag imports to Mexico, together accounting for 88% of total imports. Thailand, Vietnam, Canada and Israel lagged somewhat behind, together comprising a further 6.5%.
From 2013 to 2023, the most notable rate of growth in terms of purchases, amongst the main suppliers, was attained by Thailand (with a CAGR of +19.8%), while imports for the other leaders experienced more modest paces of growth.
In value terms, the United States ($409M) constituted the largest supplier of plastic sacks and bags to Mexico, comprising 58% of total imports. The second position in the ranking was taken by China ($140M), with a 20% share of total imports. It was followed by South Korea, with a 5.2% share.
From 2013 to 2023, the average annual growth rate of value from the United States amounted to +3.1%. The remaining supplying countries recorded the following average annual rates of imports growth: China (+9.1% per year) and South Korea (+8.0% per year).
Imports by Type
Sacks and bags of polymers of ethylene (88K tons) and plastics (72K tons) were the main products of plastic bag imports to Mexico.
From 2013 to 2023, the most notable rate of growth in terms of purchases, amongst the major product types, was attained by plastics (with a CAGR of +0.1%).
In value terms, sacks and bags of polymers of ethylene ($407M) and plastics ($300M) were the most imported types of plastic sacks and bags in Mexico.
Import Prices by Country
In 2023, the plastic bag price amounted to $4,418 per ton (CIF, Mexico), waning by -7.3% against the previous year. Over the period under review, import price indicated a noticeable increase from 2013 to 2023: its price increased at an average annual rate of +4.8% over the last decade. The trend pattern, however, indicated some noticeable fluctuations being recorded throughout the analyzed period. Based on 2023 figures, plastic bag import price decreased by -14.8% against 2021 indices. The pace of growth was the most pronounced in 2014 when the average import price increased by 23% against the previous year. Over the period under review, average import prices reached the peak figure at $5,187 per ton in 2021; however, from 2022 to 2023, import prices remained at a lower figure.
There were significant differences in the average prices amongst the major supplying countries. In 2023, amid the top importers, the country with the highest price was Israel ($10,804 per ton), while the price for China ($2,903 per ton) was amongst the lowest.
From 2013 to 2023, the most notable rate of growth in terms of prices was attained by South Korea (+8.4%), while the prices for the other major suppliers experienced more modest paces of growth.
This report provides an in-depth analysis of the plastic bag market in Mexico. Within it, you will discover the latest data on market trends and opportunities by country, consumption, production and price developments, as well as the global trade (imports and exports). The forecast exhibits the market prospects through 2030.
Product coverage:
- Prodcom 22221100 - Sacks and bags of polymers of ethylene (including cones)
- Prodcom 22221200 - Plastic sacks and bags (including cones) (excluding of polymers of ethylene)
Country coverage:
- Mexico
Data coverage:
- Market volume and value
- Per Capita consumption
- Forecast of the market dynamics in the medium term
- Trade (exports and imports) in Mexico
- Export and import prices
- Market trends, drivers and restraints
- Key market players and their profiles
Reasons to buy this report:
- Take advantage of the latest data
- Find deeper insights into current market developments
- Discover vital success factors affecting the market
This report is designed for manufacturers, distributors, importers, and wholesalers, as well as for investors, consultants and advisors.
In this report, you can find information that helps you to make informed decisions on the following issues:
- How to diversify your business and benefit from new market opportunities
- How to load your idle production capacity
- How to boost your sales on overseas markets
- How to increase your profit margins
- How to make your supply chain more sustainable
- How to reduce your production and supply chain costs
- How to outsource production to other countries
- How to prepare your business for global expansion
While doing this research, we combine the accumulated expertise of our analysts and the capabilities of artificial intelligence. The AI-based platform, developed by our data scientists, constitutes the key working tool for business analysts, empowering them to discover deep insights and ideas from the marketing data.
-
1. INTRODUCTION
Making Data-Driven Decisions to Grow Your Business
- REPORT DESCRIPTION
- RESEARCH METHODOLOGY AND AI PLATFORM
- DATA-DRIVEN DECISIONS FOR YOUR BUSINESS
- GLOSSARY AND SPECIFIC TERMS
-
2. EXECUTIVE SUMMARY
A Quick Overview of Market Performance
- KEY FINDINGS
- MARKET TRENDS This Chapter is Available Only for the Professional Edition PRO
-
3. MARKET OVERVIEW
Understanding the Current State of The Market and Its Prospects
- MARKET SIZE
- MARKET STRUCTURE
- TRADE BALANCE
- PER CAPITA CONSUMPTION
- MARKET FORECAST TO 2030
-
4. MOST PROMISING PRODUCT
Finding New Products to Diversify Your Business
This Chapter is Available Only for the Professional Edition PRO- TOP PRODUCTS TO DIVERSIFY YOUR BUSINESS
- BEST-SELLING PRODUCTS
- MOST CONSUMED PRODUCT
- MOST TRADED PRODUCT
- MOST PROFITABLE PRODUCT FOR EXPORT
-
5. MOST PROMISING SUPPLYING COUNTRIES
Choosing the Best Countries to Establish Your Sustainable Supply Chain
This Chapter is Available Only for the Professional Edition PRO- TOP COUNTRIES TO SOURCE YOUR PRODUCT
- TOP PRODUCING COUNTRIES
- TOP EXPORTING COUNTRIES
- LOW-COST EXPORTING COUNTRIES
-
6. MOST PROMISING OVERSEAS MARKETS
Choosing the Best Countries to Boost Your Exports
This Chapter is Available Only for the Professional Edition PRO- TOP OVERSEAS MARKETS FOR EXPORTING YOUR PRODUCT
- TOP CONSUMING MARKETS
- UNSATURATED MARKETS
- TOP IMPORTING MARKETS
- MOST PROFITABLE MARKETS
7. PRODUCTION
The Latest Trends and Insights into The Industry
- PRODUCTION VOLUME AND VALUE
8. IMPORTS
The Largest Import Supplying Countries
- IMPORTS FROM 2012–2023
- IMPORTS BY COUNTRY
- IMPORT PRICES BY COUNTRY
9. EXPORTS
The Largest Destinations for Exports
- EXPORTS FROM 2012–2023
- EXPORTS BY COUNTRY
- EXPORT PRICES BY COUNTRY
-
10. PROFILES OF MAJOR PRODUCERS
The Largest Producers on The Market and Their Profiles
This Chapter is Available Only for the Professional Edition PRO -
LIST OF TABLES
- Key Findings In 2023
- Market Volume, In Physical Terms, 2012–2023
- Market Value, 2012–2023
- Per Capita Consumption In 2012-2023
- Imports, In Physical Terms, By Country, 2012–2023
- Imports, In Value Terms, By Country, 2012–2023
- Import Prices, By Country Of Origin, 2012–2023
- Exports, In Physical Terms, By Country, 2012–2023
- Exports, In Value Terms, By Country, 2012–2023
- Export Prices, By Country Of Destination, 2012–2023
-
LIST OF FIGURES
- Market Volume, In Physical Terms, 2012–2023
- Market Value, 2012–2023
- Market Structure – Domestic Supply vs. Imports, In Physical Terms, 2012-2023
- Market Structure – Domestic Supply vs. Imports, In Value Terms, 2012-2023
- Trade Balance, In Physical Terms, 2012-2023
- Trade Balance, In Value Terms, 2012-2023
- Per Capita Consumption, 2012-2023
- Market Volume Forecast to 2030
- Market Value Forecast to 2030
- Products: Market Size And Growth, By Type
- Products: Average Per Capita Consumption, By Type
- Products: Exports And Growth, By Type
- Products: Export Prices And Growth, By Type
- Production Volume And Growth
- Exports And Growth
- Export Prices And Growth
- Market Size And Growth
- Per Capita Consumption
- Imports And Growth
- Import Prices
- Production, In Physical Terms, 2012–2023
- Production, In Value Terms, 2012–2023
- Imports, In Physical Terms, 2012–2023
- Imports, In Value Terms, 2012–2023
- Imports, In Physical Terms, By Country, 2023
- Imports, In Physical Terms, By Country, 2012–2023
- Imports, In Value Terms, By Country, 2012–2023
- Import Prices, By Country Of Origin, 2012–2023
- Exports, In Physical Terms, 2012–2023
- Exports, In Value Terms, 2012–2023
- Exports, In Physical Terms, By Country, 2023
- Exports, In Physical Terms, By Country, 2012–2023
- Exports, In Value Terms, By Country, 2012–2023
- Export Prices, By Country Of Destination, 2012–2023


