Import of Signs in Mexico Rises by 8% to $58 Million in 2023
Mexico Sign Imports
In 2023, the amount of sign imported into Mexico surged to 2.7K tons, with an increase of 27% on the previous year's figure. Overall, imports, however, showed a perceptible curtailment. Imports peaked at 4.2K tons in 2014; however, from 2015 to 2023, imports stood at a somewhat lower figure.
In value terms, sign imports expanded significantly to $58M (IndexBox estimates) in 2023. In general, imports continue to indicate a relatively flat trend pattern. The pace of growth appeared the most rapid in 2018 when imports increased by 30% against the previous year. As a result, imports attained the peak of $75M. From 2019 to 2023, the growth of imports remained at a lower figure.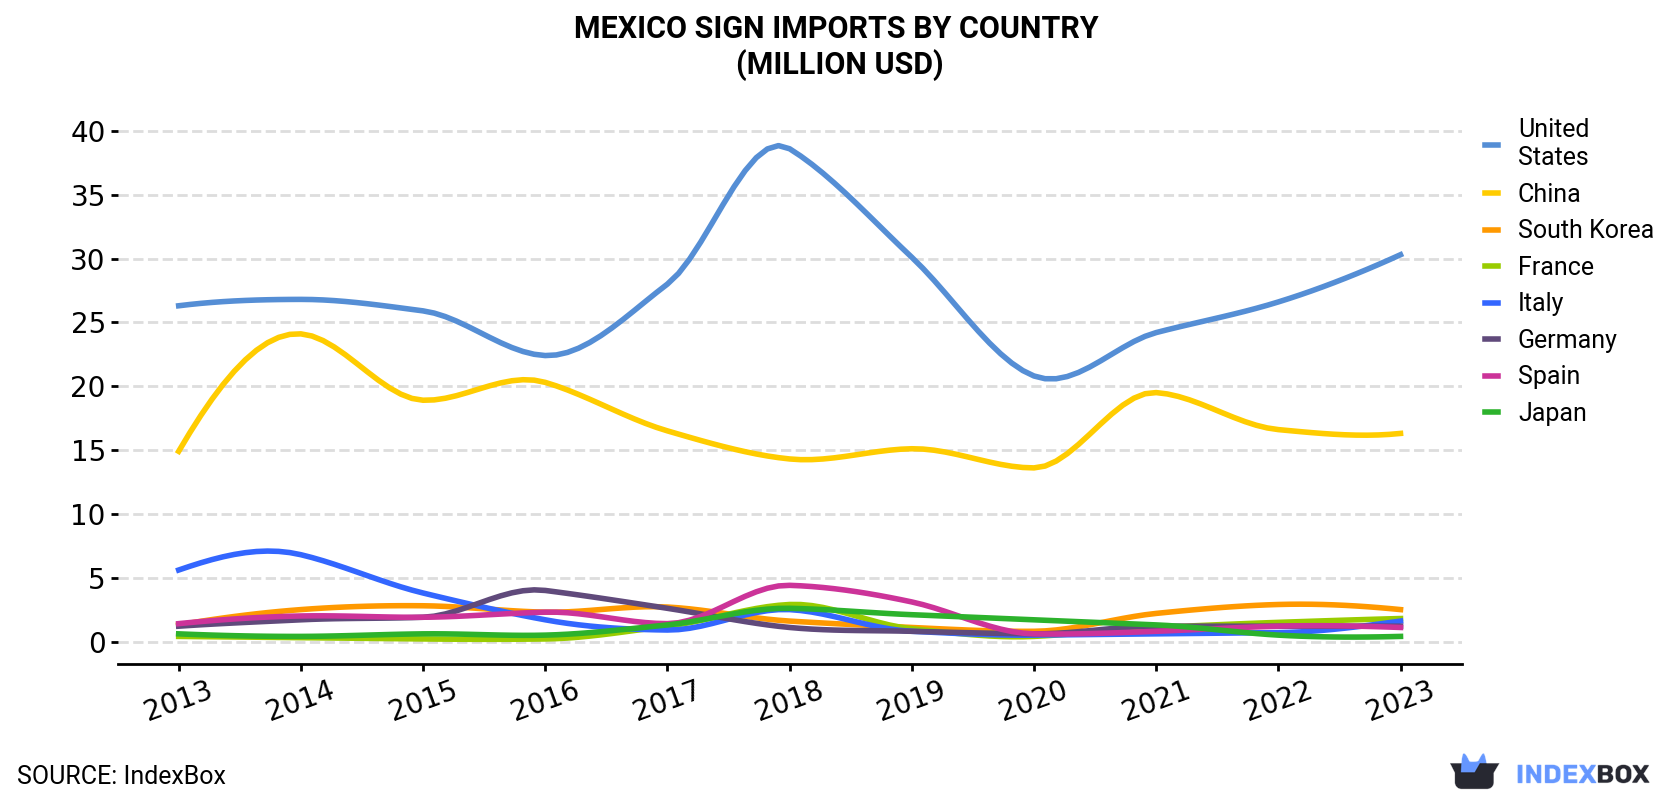
| COUNTRY | Import Value of Sign in Mexico (million USD) | ||||||||||
|---|---|---|---|---|---|---|---|---|---|---|---|
| 2013 | 2014 | 2015 | 2016 | 2017 | 2018 | 2019 | 2020 | 2021 | 2022 | 2023 | |
| United States | 26.3 | 26.8 | 25.9 | 22.4 | 28.0 | 38.6 | 30.1 | 20.8 | 24.2 | 26.6 | 30.3 |
| China | 14.9 | 24.1 | 18.9 | 20.3 | 16.5 | 14.3 | 15.1 | 13.6 | 19.5 | 16.6 | 16.3 |
| South Korea | 1.3 | 2.5 | 2.8 | 2.3 | 2.7 | 1.6 | 1.1 | 0.8 | 2.2 | 2.9 | 2.5 |
| France | 0.4 | 0.3 | 0.2 | 0.2 | 1.2 | 2.9 | 1.0 | 0.4 | 1.1 | 1.5 | 1.8 |
| Italy | 5.6 | 6.8 | 3.8 | 1.7 | 0.9 | 2.5 | 0.8 | 0.5 | 0.6 | 0.7 | 1.6 |
| Germany | 1.2 | 1.7 | 1.9 | 4.0 | 2.6 | 1.1 | 0.8 | 0.6 | 1.2 | 1.2 | 1.2 |
| Spain | 1.4 | 2.0 | 1.9 | 2.3 | 1.4 | 4.4 | 3.1 | 0.6 | 0.8 | 1.2 | 1.1 |
| Japan | 0.6 | 0.4 | 0.6 | 0.5 | 1.3 | 2.6 | 2.1 | 1.7 | 1.3 | 0.5 | 0.4 |
| Others | 2.4 | 3.3 | 3.2 | 2.3 | 3.0 | 7.1 | 6.6 | 4.0 | 2.9 | 2.4 | 2.6 |
| Total | 54.2 | 67.8 | 59.3 | 56.0 | 57.7 | 75.2 | 60.6 | 43.0 | 53.8 | 53.7 | 57.9 |
Imports by Country
The United States (1.4K tons), China (898 tons) and Italy (128 tons) were the main suppliers of sign imports to Mexico, with a combined 89% share of total imports. South Korea, France, Spain, Germany and Japan lagged somewhat behind, together accounting for a further 7.5%.
From 2013 to 2023, the most notable rate of growth in terms of purchases, amongst the main suppliers, was attained by France (with a CAGR of +11.5%), while imports for the other leaders experienced more modest paces of growth.
In value terms, the United States ($30M), China ($16M) and South Korea ($2.5M) constituted the largest sign suppliers to Mexico, together comprising 85% of total imports. France, Italy, Germany, Spain and Japan lagged somewhat behind, together comprising a further 11%.
In terms of the main suppliers, France, with a CAGR of +16.1%, recorded the highest rates of growth with regard to the value of imports, over the period under review, while purchases for the other leaders experienced more modest paces of growth.
Imports by Type
In 2023, metal advertising signs (2.3K tons) constituted the largest type of sign supplied to Mexico, accounting for a 83% share of total imports. Moreover, metal advertising signs exceeded the figures recorded for the second-largest type, illuminated signs and illuminated name-plates (460 tons), fivefold.
From 2013 to 2023, the average annual rate of growth in terms of the volume of metal advertising signs imports stood at -3.4%.
In value terms, metal advertising signs ($46M) constituted the largest type of sign supplied to Mexico, comprising 80% of total imports. The second position in the ranking was taken by illuminated signs and illuminated name-plates ($12M), with a 20% share of total imports.
Import Prices by Country
In 2023, the sign price amounted to $21,350 per ton (CIF, Mexico), waning by -15.2% against the previous year. In general, import price indicated a temperate increase from 2013 to 2023: its price increased at an average annual rate of +3.5% over the last decade. The trend pattern, however, indicated some noticeable fluctuations being recorded throughout the analyzed period. The growth pace was the most rapid in 2021 when the average import price increased by 12%. The import price peaked at $25,189 per ton in 2022, and then declined markedly in the following year.
There were significant differences in the average prices amongst the major supplying countries. In 2023, amid the top importers, the country with the highest price was Germany ($38,662 per ton), while the price for Italy ($12,813 per ton) was amongst the lowest.
From 2013 to 2023, the most notable rate of growth in terms of prices was attained by the United States (+8.6%), while the prices for the other major suppliers experienced mixed trend patterns.
-
1. INTRODUCTION
Making Data-Driven Decisions to Grow Your Business
- REPORT DESCRIPTION
- RESEARCH METHODOLOGY AND AI PLATFORM
- DATA-DRIVEN DECISIONS FOR YOUR BUSINESS
- GLOSSARY AND SPECIFIC TERMS
-
2. EXECUTIVE SUMMARY
A Quick Overview of Market Performance
- KEY FINDINGS
- MARKET TRENDS This Chapter is Available Only for the Professional Edition PRO
-
3. MARKET OVERVIEW
Understanding the Current State of The Market and Its Prospects
- MARKET SIZE
- MARKET STRUCTURE
- TRADE BALANCE
- PER CAPITA CONSUMPTION
- MARKET FORECAST TO 2030
-
4. MOST PROMISING PRODUCT
Finding New Products to Diversify Your Business
This Chapter is Available Only for the Professional Edition PRO- TOP PRODUCTS TO DIVERSIFY YOUR BUSINESS
- BEST-SELLING PRODUCTS
- MOST CONSUMED PRODUCT
- MOST TRADED PRODUCT
- MOST PROFITABLE PRODUCT FOR EXPORT
-
5. MOST PROMISING SUPPLYING COUNTRIES
Choosing the Best Countries to Establish Your Sustainable Supply Chain
This Chapter is Available Only for the Professional Edition PRO- TOP COUNTRIES TO SOURCE YOUR PRODUCT
- TOP PRODUCING COUNTRIES
- TOP EXPORTING COUNTRIES
- LOW-COST EXPORTING COUNTRIES
-
6. MOST PROMISING OVERSEAS MARKETS
Choosing the Best Countries to Boost Your Exports
This Chapter is Available Only for the Professional Edition PRO- TOP OVERSEAS MARKETS FOR EXPORTING YOUR PRODUCT
- TOP CONSUMING MARKETS
- UNSATURATED MARKETS
- TOP IMPORTING MARKETS
- MOST PROFITABLE MARKETS
7. PRODUCTION
The Latest Trends and Insights into The Industry
- PRODUCTION VOLUME AND VALUE
8. IMPORTS
The Largest Import Supplying Countries
- IMPORTS FROM 2012–2023
- IMPORTS BY COUNTRY
- IMPORT PRICES BY COUNTRY
9. EXPORTS
The Largest Destinations for Exports
- EXPORTS FROM 2012–2023
- EXPORTS BY COUNTRY
- EXPORT PRICES BY COUNTRY
-
10. PROFILES OF MAJOR PRODUCERS
The Largest Producers on The Market and Their Profiles
This Chapter is Available Only for the Professional Edition PRO -
LIST OF TABLES
- Key Findings In 2023
- Market Volume, In Physical Terms, 2012–2023
- Market Value, 2012–2023
- Per Capita Consumption In 2012-2023
- Imports, In Physical Terms, By Country, 2012–2023
- Imports, In Value Terms, By Country, 2012–2023
- Import Prices, By Country Of Origin, 2012–2023
- Exports, In Physical Terms, By Country, 2012–2023
- Exports, In Value Terms, By Country, 2012–2023
- Export Prices, By Country Of Destination, 2012–2023
-
LIST OF FIGURES
- Market Volume, In Physical Terms, 2012–2023
- Market Value, 2012–2023
- Market Structure – Domestic Supply vs. Imports, In Physical Terms, 2012-2023
- Market Structure – Domestic Supply vs. Imports, In Value Terms, 2012-2023
- Trade Balance, In Physical Terms, 2012-2023
- Trade Balance, In Value Terms, 2012-2023
- Per Capita Consumption, 2012-2023
- Market Volume Forecast to 2030
- Market Value Forecast to 2030
- Products: Market Size And Growth, By Type
- Products: Average Per Capita Consumption, By Type
- Products: Exports And Growth, By Type
- Products: Export Prices And Growth, By Type
- Production Volume And Growth
- Exports And Growth
- Export Prices And Growth
- Market Size And Growth
- Per Capita Consumption
- Imports And Growth
- Import Prices
- Production, In Physical Terms, 2012–2023
- Production, In Value Terms, 2012–2023
- Imports, In Physical Terms, 2012–2023
- Imports, In Value Terms, 2012–2023
- Imports, In Physical Terms, By Country, 2023
- Imports, In Physical Terms, By Country, 2012–2023
- Imports, In Value Terms, By Country, 2012–2023
- Import Prices, By Country Of Origin, 2012–2023
- Exports, In Physical Terms, 2012–2023
- Exports, In Value Terms, 2012–2023
- Exports, In Physical Terms, By Country, 2023
- Exports, In Physical Terms, By Country, 2012–2023
- Exports, In Value Terms, By Country, 2012–2023
- Export Prices, By Country Of Destination, 2012–2023


