World - Mixtures Of Fruit And Vegetable Juices - Market Analysis, Forecast, Size, Trends And Insights
Get instant access to more than 2 million reports, dashboards, and datasets on the IndexBox Platform.
View PricingGlobal Mixed Juices Market Expected to Grow at a CAGR of +3.5% from 2023 to 2030
IndexBox has just published a new report: World - Mixtures Of Fruit And Vegetable Juices - Market Analysis, Forecast, Size, Trends And Insights.
The market for mixed juices is expected to see a steady increase in demand, with a forecasted CAGR of +3.5% in volume and +5.0% in value from 2023 to 2030. This upward trend is expected to bring the market to new heights by the end of the decade.
Market Forecast
Driven by rising demand for mixed juices worldwide, the market is expected to start an upward consumption trend over the next seven-year period. The performance of the market is forecast to increase slightly, with an anticipated CAGR of +3.5% for the period from 2023 to 2030, which is projected to bring the market volume to 25M tons by the end of 2030.
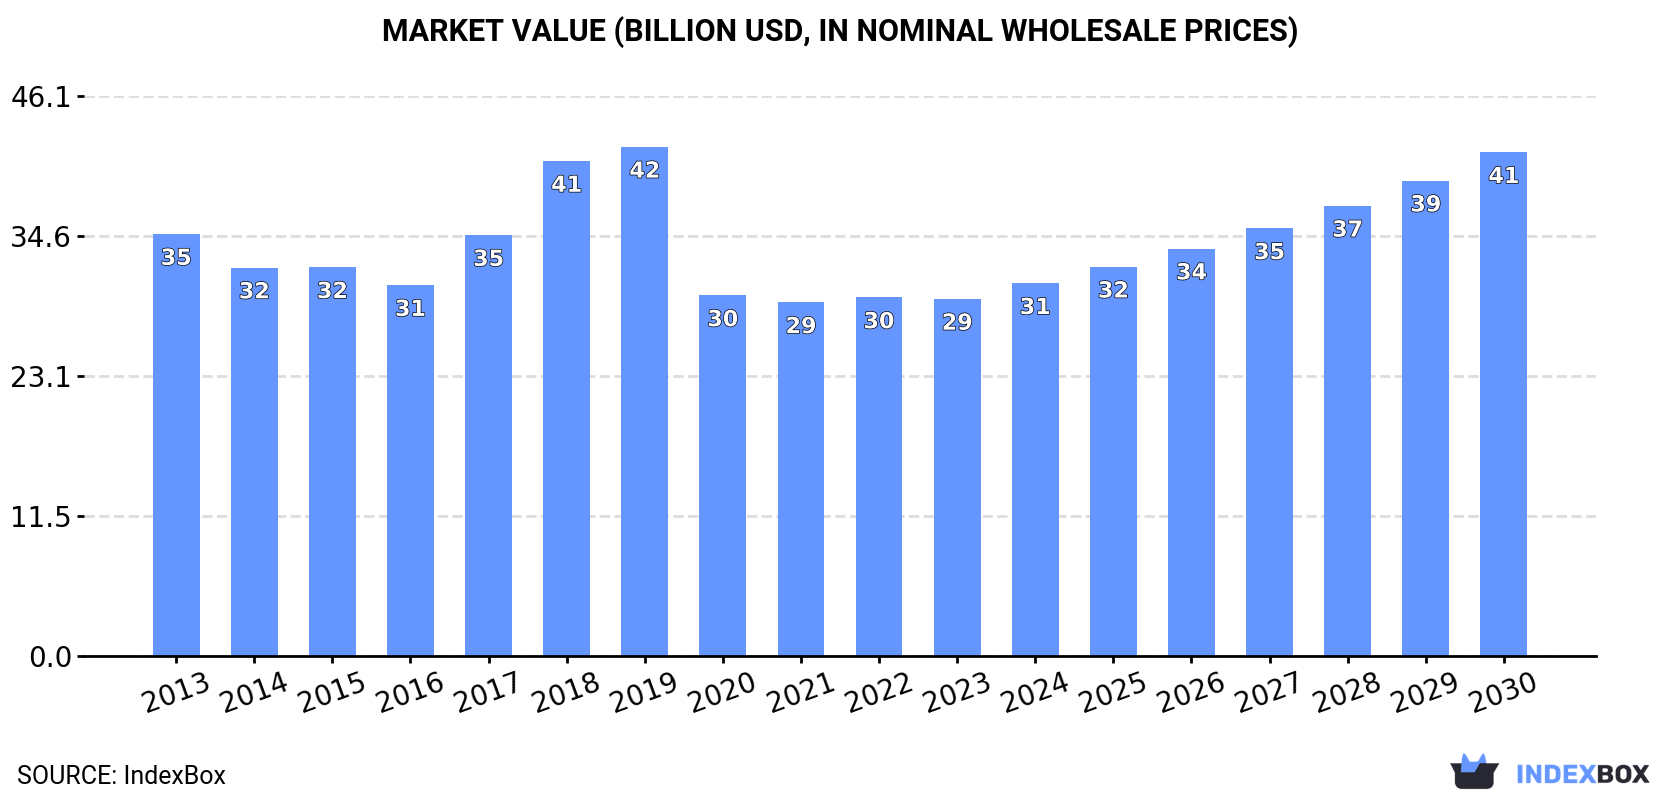
In value terms, the market is forecast to increase with an anticipated CAGR of +5.0% for the period from 2023 to 2030, which is projected to bring the market value to $41.5B (in in nominal wholesale prices) by the end of 2030.
Consumption
World Consumption of Mixtures Of Fruit And Vegetable Juices
In 2023, approx. 20M tons of mixtures of fruit and vegetable juices were consumed worldwide; standing approx. at the previous year. Overall, consumption, however, showed a mild decline. Over the period under review, global consumption attained the peak volume at 30M tons in 2019; however, from 2020 to 2023, consumption failed to regain momentum.
The global mixed juices market size dropped slightly to $29.4B in 2023, remaining constant against the previous year. This figure reflects the total revenues of producers and importers (excluding logistics costs, retail marketing costs, and retailers' margins, which will be included in the final consumer price). In general, consumption, however, showed a slight contraction. Global consumption peaked at $41.9B in 2019; however, from 2020 to 2023, consumption stood at a somewhat lower figure.
Consumption By Country
The countries with the highest volumes of consumption in 2023 were China (3.3M tons), Turkey (2.4M tons) and the United States (1.7M tons), together accounting for 37% of global consumption.
From 2013 to 2023, the biggest increases were recorded for Turkey (with a CAGR of +4.3%), while consumption for the other global leaders experienced more modest paces of growth.
In value terms, the largest mixed juices markets worldwide were China ($6.8B), the United States ($3.8B) and Turkey ($2.9B), with a combined 46% share of the global market.
In terms of the main consuming countries, Turkey, with a CAGR of +4.6%, recorded the highest rates of growth with regard to market size over the period under review, while market for the other global leaders experienced more modest paces of growth.
In 2023, the highest levels of mixed juices per capita consumption was registered in Turkey (28 kg per person), followed by Germany (7.8 kg per person), the United States (5 kg per person) and Japan (4 kg per person), while the world average per capita consumption of mixed juices was estimated at 2.5 kg per person.
In Turkey, mixed juices per capita consumption increased at an average annual rate of +3.0% over the period from 2013-2023. The remaining consuming countries recorded the following average annual rates of per capita consumption growth: Germany (+2.5% per year) and the United States (-3.6% per year).
Production
World Production of Mixtures Of Fruit And Vegetable Juices
In 2023, approx. 20M tons of mixtures of fruit and vegetable juices were produced worldwide; approximately mirroring 2022 figures. Overall, production, however, continues to indicate a slight slump. The most prominent rate of growth was recorded in 2018 with an increase of 21% against the previous year. Over the period under review, global production attained the maximum volume at 30M tons in 2019; however, from 2020 to 2023, production remained at a lower figure.
In value terms, mixed juices production reduced modestly to $29.6B in 2023 estimated in export price. Over the period under review, production, however, showed a slight contraction. The pace of growth appeared the most rapid in 2018 when the production volume increased by 18%. Global production peaked at $42.1B in 2019; however, from 2020 to 2023, production stood at a somewhat lower figure.
Production By Country
The countries with the highest volumes of production in 2023 were China (3.3M tons), Turkey (2.4M tons) and the United States (1.7M tons), with a combined 36% share of global production. India, Germany, Japan, Indonesia, Brazil, Pakistan, the Netherlands, Mexico, Saudi Arabia and Thailand lagged somewhat behind, together comprising a further 24%.
From 2013 to 2023, the biggest increases were recorded for the Netherlands (with a CAGR of +6.5%), while production for the other global leaders experienced more modest paces of growth.
Imports
World Imports of Mixtures Of Fruit And Vegetable Juices
In 2023, overseas purchases of mixtures of fruit and vegetable juices decreased by -4.1% to 1.2M tons, falling for the seventh year in a row after two years of growth. Over the period under review, imports showed a pronounced decrease. The most prominent rate of growth was recorded in 2016 with an increase of 17%. As a result, imports attained the peak of 2.2M tons. From 2017 to 2023, the growth of global imports remained at a lower figure.
In value terms, mixed juices imports rose notably to $1.7B in 2023. Overall, imports continue to indicate a mild shrinkage. The most prominent rate of growth was recorded in 2017 when imports increased by 13% against the previous year. Global imports peaked at $2.2B in 2018; however, from 2019 to 2023, imports stood at a somewhat lower figure.
Imports By Country
In 2023, France (131K tons) and the UK (121K tons) represented the key importers of mixtures of fruit and vegetable juicesacross the globe, together resulting at approx. 22% of total imports. Sweden (46K tons), Germany (46K tons), the United States (39K tons), Denmark (35K tons), Belgium (33K tons), Kuwait (30K tons), Canada (30K tons), Poland (30K tons), Austria (20K tons), the United Arab Emirates (20K tons) and Oman (19K tons) followed a long way behind the leaders.
From 2013 to 2023, the most notable rate of growth in terms of purchases, amongst the leading importing countries, was attained by Sweden (with a CAGR of +7.2%), while imports for the other global leaders experienced more modest paces of growth.
In value terms, the largest mixed juices importing markets worldwide were the UK ($172M), France ($167M) and Germany ($95M), with a combined 26% share of global imports. The United States, Sweden, Belgium, Poland, Canada, Kuwait, Austria, the United Arab Emirates, Denmark and Oman lagged somewhat behind, together comprising a further 27%.
Among the main importing countries, Poland, with a CAGR of +12.0%, recorded the highest growth rate of the value of imports, over the period under review, while purchases for the other global leaders experienced more modest paces of growth.
Import Prices By Country
The average mixed juices import price stood at $1,428 per ton in 2023, picking up by 12% against the previous year. Over the last decade, it increased at an average annual rate of +3.0%. The growth pace was the most rapid in 2017 an increase of 17% against the previous year. Over the period under review, average import prices attained the peak figure in 2023 and is likely to see steady growth in years to come.
There were significant differences in the average prices amongst the major importing countries. In 2023, amid the top importers, the country with the highest price was the United States ($2,264 per ton), while Oman ($723 per ton) was amongst the lowest.
From 2013 to 2023, the most notable rate of growth in terms of prices was attained by the United States (+8.5%), while the other global leaders experienced more modest paces of growth.
Exports
World Exports of Mixtures Of Fruit And Vegetable Juices
In 2023, shipments abroad of mixtures of fruit and vegetable juices decreased by -4.2% to 1.4M tons, falling for the fifth consecutive year after two years of growth. Overall, exports saw a pronounced slump. The pace of growth was the most pronounced in 2014 with an increase of 8.7% against the previous year. Over the period under review, the global exports attained the peak figure at 2.1M tons in 2018; however, from 2019 to 2023, the exports remained at a lower figure.
In value terms, mixed juices exports reached $1.9B in 2023. Over the period under review, exports, however, recorded a relatively flat trend pattern. The pace of growth appeared the most rapid in 2018 when exports increased by 12% against the previous year. As a result, the exports reached the peak of $2.1B. From 2019 to 2023, the growth of the global exports remained at a somewhat lower figure.
Exports By Country
In 2023, Spain (169K tons), the Netherlands (146K tons), Germany (135K tons), Saudi Arabia (107K tons), Thailand (83K tons), South Africa (81K tons), Nepal (56K tons), Belgium (50K tons), Egypt (43K tons), Poland (37K tons), the United States (32K tons) and the Dominican Republic (31K tons) was the key exporter of mixtures of fruit and vegetable juices in the world, achieving 71% of total export. Austria (30K tons) followed a long way behind the leaders.
From 2013 to 2023, the most notable rate of growth in terms of shipments, amongst the key exporting countries, was attained by the Dominican Republic (with a CAGR of +13.4%), while the other global leaders experienced more modest paces of growth.
In value terms, the Netherlands ($334M), Spain ($200M) and Germany ($170M) constituted the countries with the highest levels of exports in 2023, with a combined 37% share of global exports. Saudi Arabia, the United States, Thailand, Egypt, South Africa, Belgium, Austria, Poland, Nepal and the Dominican Republic lagged somewhat behind, together comprising a further 36%.
The Dominican Republic, with a CAGR of +22.2%, recorded the highest growth rate of the value of exports, in terms of the main exporting countries over the period under review, while shipments for the other global leaders experienced more modest paces of growth.
Export Prices By Country
The average mixed juices export price stood at $1,420 per ton in 2023, rising by 12% against the previous year. Over the last decade, it increased at an average annual rate of +3.8%. As a result, the export price reached the peak level and is likely to continue growth in the immediate term.
There were significant differences in the average prices amongst the major exporting countries. In 2023, amid the top suppliers, the country with the highest price was the United States ($3,216 per ton), while Nepal ($603 per ton) was amongst the lowest.
From 2013 to 2023, the most notable rate of growth in terms of prices was attained by Egypt (+8.3%), while the other global leaders experienced more modest paces of growth.
This report provides an in-depth analysis of the global mixed juices market. Within it, you will discover the latest data on market trends and opportunities by country, consumption, production and price developments, as well as the global trade (imports and exports). The forecast exhibits the market prospects through 2030.
Product coverage:
- Prodcom 10321700 - Mixtures of fruit and vegetable juices
Country coverage:
Worldwide - the report contains statistical data for 200 countries and includes detailed profiles of the 50 largest consuming countries:
- USA
- China
- Japan
- Germany
- United Kingdom
- France
- Brazil
- Italy
- Russian Federation
- India
- Canada
- Australia
- Republic of Korea
- Spain
- Mexico
- Indonesia
- Netherlands
- Turkey
- Saudi Arabia
- Switzerland
- Sweden
- Nigeria
- Poland
- Belgium
- Argentina
- Norway
- Austria
- Thailand
- United Arab Emirates
- Colombia
- Denmark
- South Africa
- Malaysia
- Israel
- Singapore
- Egypt
- Philippines
- Finland
- Chile
- Ireland
- Pakistan
- Greece
- Portugal
- Kazakhstan
- Algeria
- Czech Republic
- Qatar
- Peru
- Romania
- Vietnam
+ the largest producing countries
Data coverage:
- Global market volume and value
- Per Capita consumption
- Forecast of the market dynamics in the medium term
- Global production, split by region and country
- Global trade (exports and imports)
- Export and import prices
- Market trends, drivers and restraints
- Key market players and their profiles
Reasons to buy this report:
- Take advantage of the latest data
- Find deeper insights into current market developments
- Discover vital success factors affecting the market
This report is designed for manufacturers, distributors, importers, and wholesalers, as well as for investors, consultants and advisors.
In this report, you can find information that helps you to make informed decisions on the following issues:
- How to diversify your business and benefit from new market opportunities
- How to load your idle production capacity
- How to boost your sales on overseas markets
- How to increase your profit margins
- How to make your supply chain more sustainable
- How to reduce your production and supply chain costs
- How to outsource production to other countries
- How to prepare your business for global expansion
While doing this research, we combine the accumulated expertise of our analysts and the capabilities of artificial intelligence. The AI-based platform, developed by our data scientists, constitutes the key working tool for business analysts, empowering them to discover deep insights and ideas from the marketing data.
-
1. INTRODUCTION
Making Data-Driven Decisions to Grow Your Business
- REPORT DESCRIPTION
- RESEARCH METHODOLOGY AND AI PLATFORM
- DATA-DRIVEN DECISIONS FOR YOUR BUSINESS
- GLOSSARY AND SPECIFIC TERMS
-
2. EXECUTIVE SUMMARY
A Quick Overview of Market Performance
- KEY FINDINGS
- MARKET TRENDS This Chapter is Available Only for the Professional Edition PRO
-
3. MARKET OVERVIEW
Understanding the Current State of The Market and Its Prospects
- MARKET SIZE
- CONSUMPTION BY COUNTRY
- MARKET FORECAST TO 2030
-
4. MOST PROMISING PRODUCT
Finding New Products to Diversify Your Business
This Chapter is Available Only for the Professional Edition PRO- TOP PRODUCTS TO DIVERSIFY YOUR BUSINESS
- BEST-SELLING PRODUCTS
- MOST CONSUMED PRODUCT
- MOST TRADED PRODUCT
- MOST PROFITABLE PRODUCT FOR EXPORT
-
5. MOST PROMISING SUPPLYING COUNTRIES
Choosing the Best Countries to Establish Your Sustainable Supply Chain
This Chapter is Available Only for the Professional Edition PRO- TOP COUNTRIES TO SOURCE YOUR PRODUCT
- TOP PRODUCING COUNTRIES
- TOP EXPORTING COUNTRIES
- LOW-COST EXPORTING COUNTRIES
-
6. MOST PROMISING OVERSEAS MARKETS
Choosing the Best Countries to Boost Your Exports
This Chapter is Available Only for the Professional Edition PRO- TOP OVERSEAS MARKETS FOR EXPORTING YOUR PRODUCT
- TOP CONSUMING MARKETS
- UNSATURATED MARKETS
- TOP IMPORTING MARKETS
- MOST PROFITABLE MARKETS
7. GLOBAL PRODUCTION
The Latest Trends and Insights into The Industry
- PRODUCTION VOLUME AND VALUE
- PRODUCTION BY COUNTRY
8. GLOBAL IMPORTS
The Largest Importers on The Market and How They Succeed
- IMPORTS FROM 2012–2023
- IMPORTS BY COUNTRY
- IMPORT PRICES BY COUNTRY
9. GLOBAL EXPORTS
The Largest Exporters on The Market and How They Succeed
- EXPORTS FROM 2012–2023
- EXPORTS BY COUNTRY
- EXPORT PRICES BY COUNTRY
-
10. PROFILES OF MAJOR PRODUCERS
The Largest Producers on The Market and Their Profiles
This Chapter is Available Only for the Professional Edition PRO -
11. COUNTRY PROFILES
The Largest Markets And Their Profiles
This Chapter is Available Only for the Professional Edition PRO- United States
- China
- Japan
- Germany
- United Kingdom
- France
- Brazil
- Italy
- Russian Federation
- India
- Canada
- Australia
- Republic of Korea
- Spain
- Mexico
- Indonesia
- Netherlands
- Turkey
- Saudi Arabia
- Switzerland
- Sweden
- Nigeria
- Poland
- Belgium
- Argentina
- Norway
- Austria
- Thailand
- United Arab Emirates
- Colombia
- Denmark
- South Africa
- Malaysia
- Israel
- Singapore
- Egypt
- Philippines
- Finland
- Chile
- Ireland
- Pakistan
- Greece
- Portugal
- Kazakhstan
- Algeria
- Czech Republic
- Qatar
- Peru
- Romania
- Vietnam
-
LIST OF TABLES
- Key Findings In 2023
- Market Volume, In Physical Terms, 2012–2023
- Market Value, 2012–2023
- Per Capita Consumption, By Country, 2018–2023
- Production, In Physical Terms, By Country, 2012–2023
- Imports, In Physical Terms, By Country, 2012–2023
- Imports, In Value Terms, By Country, 2012–2023
- Import Prices, By Country Of Destination, 2012–2023
- Exports, In Physical Terms, By Country, 2012–2023
- Exports, In Value Terms, By Country, 2012–2023
- Export Prices, By Country Of Origin, 2012–2023
-
LIST OF FIGURES
- Market Volume, In Physical Terms, 2012–2023
- Market Value, 2012–2023
- Consumption, By Country, 2023
- Market Volume Forecast to 2030
- Market Value Forecast to 2030
- Products: Market Size And Growth, By Type
- Products: Average Per Capita Consumption, By Type
- Products: Exports And Growth, By Type
- Products: Export Prices And Growth, By Type
- Production Volume And Growth
- Exports And Growth
- Export Prices And Growth
- Market Size And Growth
- Per Capita Consumption
- Imports And Growth
- Import Prices
- Production, In Physical Terms, 2012–2023
- Production, In Value Terms, 2012–2023
- Production, By Country, 2023
- Production, In Physical Terms, By Country, 2012–2023
- Imports, In Physical Terms, 2012–2023
- Imports, In Value Terms, 2012–2023
- Imports, In Physical Terms, By Country, 2023
- Imports, In Physical Terms, By Country, 2012–2023
- Imports, In Value Terms, By Country, 2012–2023
- Import Prices, By Country, 2012–2023
- Exports, In Physical Terms, 2012–2023
- Exports, In Value Terms, 2012–2023
- Exports, In Physical Terms, By Country, 2023
- Exports, In Physical Terms, By Country, 2012–2023
- Exports, In Value Terms, By Country, 2012–2023
- Export Prices, 2012–2023


