
Netherlands - Amplifiers - Market Analysis, Forecast, Size, Trends and Insights
Get instant access to more than 2 million reports, dashboards, and datasets on the IndexBox Platform.
View PricingThe Netherlands Sees Remarkable Decline in Amplifier Exports to $219M in 2023
Netherlands Amplifier Exports
After four years of growth, shipments abroad of amplifiers decreased by -18% to 1.6M units in 2023. Over the period under review, exports, however, continue to indicate a resilient expansion. The pace of growth was the most pronounced in 2019 when exports increased by 179% against the previous year. Over the period under review, the exports attained the maximum at 1.9M units in 2022, and then contracted significantly in the following year.
In value terms, amplifier exports declined to $219M (IndexBox estimates) in 2023. In general, exports, however, enjoyed a strong increase. The pace of growth was the most pronounced in 2020 when exports increased by 99% against the previous year. Over the period under review, the exports hit record highs at $245M in 2022, and then fell in the following year.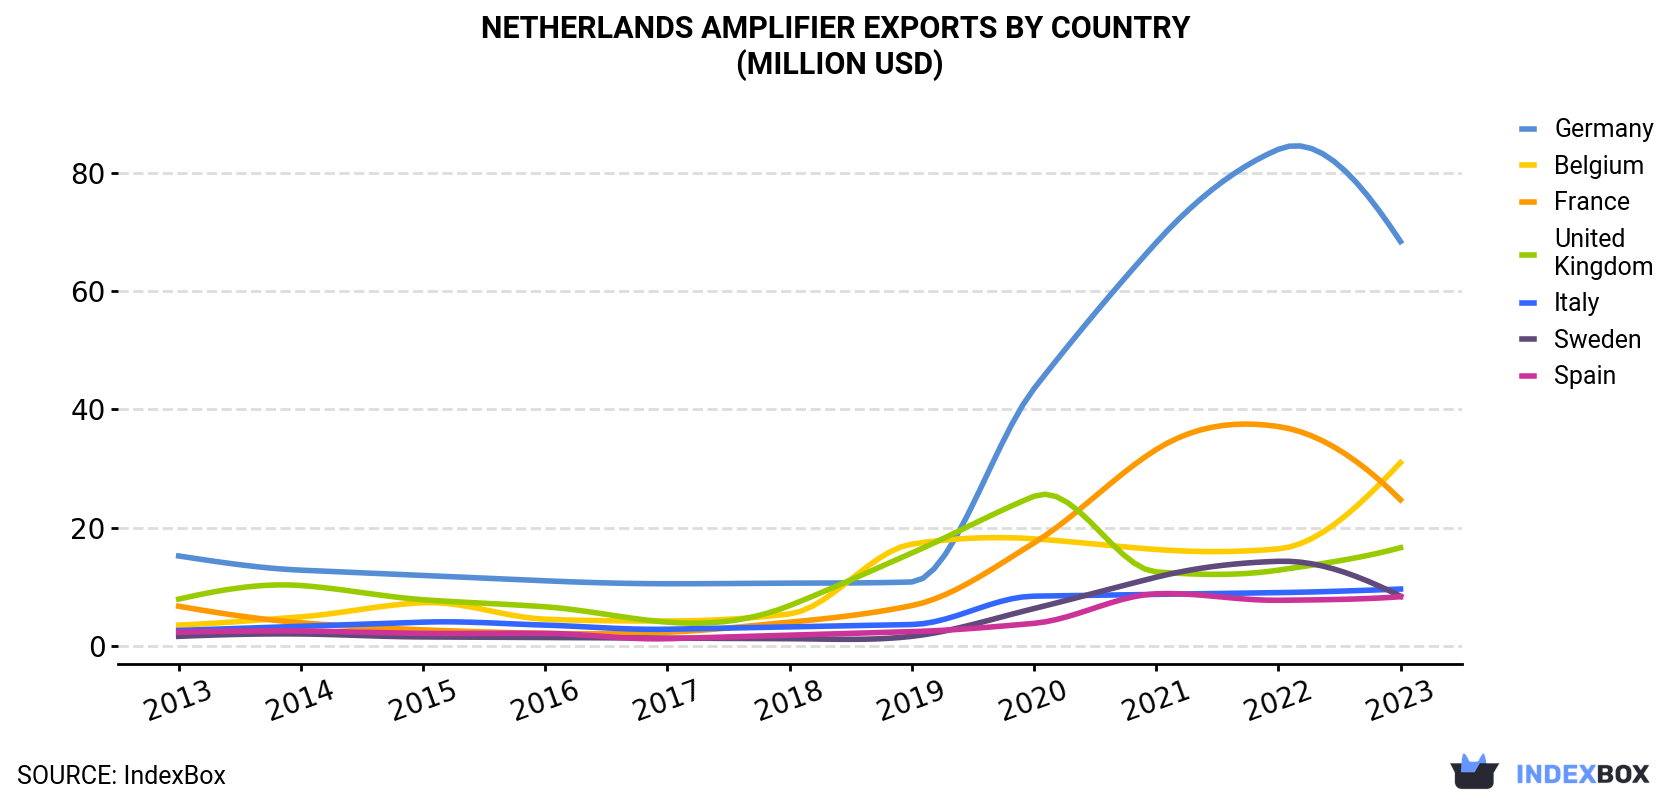
| COUNTRY | Export Value of Amplifier in Netherlands (million USD) | ||||||||||
|---|---|---|---|---|---|---|---|---|---|---|---|
| 2013 | 2014 | 2015 | 2016 | 2017 | 2018 | 2019 | 2020 | 2021 | 2022 | 2023 | |
| Germany | 15.2 | 12.8 | 11.9 | 11.0 | 10.5 | 10.6 | 10.8 | 43.5 | 68.2 | 84.0 | 68.4 |
| Belgium | 3.5 | 4.9 | 7.3 | 4.5 | 4.2 | 5.4 | 17.2 | 18.1 | 16.3 | 16.4 | 31.0 |
| France | 6.7 | 3.9 | 2.7 | 2.1 | 2.3 | 4.0 | 6.8 | 17.4 | 33.2 | 37.1 | 24.7 |
| United Kingdom | 7.9 | 10.2 | 7.8 | 6.6 | 4.0 | 6.8 | 15.7 | 25.3 | 12.5 | 12.8 | 16.6 |
| Italy | 2.6 | 3.3 | 4.0 | 3.5 | 2.8 | 3.2 | 3.6 | 8.4 | 8.7 | 9.0 | 9.6 |
| Sweden | 1.6 | 2.0 | 1.5 | 1.4 | 1.3 | 1.2 | 1.6 | 6.3 | 11.6 | 14.3 | 8.4 |
| Spain | 2.3 | 2.5 | 2.1 | 2.1 | 1.2 | 1.8 | 2.4 | 3.8 | 8.8 | 7.7 | 8.3 |
| Others | 21.8 | 23.4 | 22.6 | 21.4 | 17.7 | 25.3 | 30.0 | 52.8 | 68.7 | 63.6 | 52.0 |
| Total | 61.6 | 63.0 | 59.9 | 52.8 | 44.0 | 58.3 | 88.1 | 176 | 228 | 245 | 219 |
Exports by Country
Germany (478K units), Belgium (368K units) and the UK (123K units) were the main destinations of amplifier exports from the Netherlands, with a combined 61% share of total exports.
From 2013 to 2023, the biggest increases were recorded for Belgium (with a CAGR of +33.9%), while shipments for the other leaders experienced more modest paces of growth.
In value terms, Germany ($68M) remains the key foreign market for amplifiers exports from the Netherlands, comprising 31% of total exports. The second position in the ranking was held by Belgium ($31M), with a 14% share of total exports. It was followed by France, with an 11% share.
From 2013 to 2023, the average annual growth rate of value to Germany amounted to +16.2%. Exports to the other major destinations recorded the following average annual rates of exports growth: Belgium (+24.5% per year) and France (+13.9% per year).
Exports by Type
Electric sound amplifier sets (1.1M units) was the largest type of amplifiers exported from the Netherlands, accounting for a 71% share of total exports. Moreover, electric sound amplifier sets exceeded the volume of the second product type, amplifiers; audio-frequency electric (455K units), twofold.
From 2013 to 2023, the average annual growth rate of the volume of electric sound amplifier sets exports stood at +14.1%.
In value terms, electric sound amplifier sets ($134M) and amplifiers; audio-frequency electric ($85M) constituted the most exported types of amplifiers from the Netherlands worldwide.
Electric sound amplifier sets, with a CAGR of +21.0%, saw the highest rates of growth with regard to the value of exports, in terms of the main product categories over the period under review.
Export Prices by Country
In 2023, the amplifier price amounted to $138 per unit (FOB, Netherlands), with an increase of 9% against the previous year. In general, the export price, however, showed a relatively flat trend pattern. The pace of growth appeared the most rapid in 2015 an increase of 174%. Over the period under review, the average export prices attained the maximum at $215 per unit in 2018; however, from 2019 to 2023, the export prices failed to regain momentum.
There were significant differences in the average prices for the major overseas markets. In 2023, amid the top suppliers, the country with the highest price was Sweden ($233 per unit), while the average price for exports to Poland ($61 per unit) was amongst the lowest.
From 2013 to 2023, the most notable rate of growth in terms of prices was recorded for supplies to Sweden (+4.2%), while the prices for the other major destinations experienced more modest paces of growth.
This report provides an in-depth analysis of the amplifier market in the Netherlands. Within it, you will discover the latest data on market trends and opportunities by country, consumption, production and price developments, as well as the global trade (imports and exports). The forecast exhibits the market prospects through 2030.
Product coverage:
- Prodcom 26404355 - Telephonic and measurement amplifiers (excluding high or intermediate frequency amplifiers)
- Prodcom 26404359 - Audio-frequency electric amplifiers (including hi-fi amplifiers) (excluding high or intermediate frequency amplifiers, t elephonic and measurement amplifiers)
- Prodcom 26404370 - Electric sound amplifier sets (including public address systems with microphone and speaker)
Country coverage:
- Netherlands
Data coverage:
- Market volume and value
- Per Capita consumption
- Forecast of the market dynamics in the medium term
- Trade (exports and imports) in the Netherlands
- Export and import prices
- Market trends, drivers and restraints
- Key market players and their profiles
Reasons to buy this report:
- Take advantage of the latest data
- Find deeper insights into current market developments
- Discover vital success factors affecting the market
This report is designed for manufacturers, distributors, importers, and wholesalers, as well as for investors, consultants and advisors.
In this report, you can find information that helps you to make informed decisions on the following issues:
- How to diversify your business and benefit from new market opportunities
- How to load your idle production capacity
- How to boost your sales on overseas markets
- How to increase your profit margins
- How to make your supply chain more sustainable
- How to reduce your production and supply chain costs
- How to outsource production to other countries
- How to prepare your business for global expansion
While doing this research, we combine the accumulated expertise of our analysts and the capabilities of artificial intelligence. The AI-based platform, developed by our data scientists, constitutes the key working tool for business analysts, empowering them to discover deep insights and ideas from the marketing data.
-
1. INTRODUCTION
Making Data-Driven Decisions to Grow Your Business
- REPORT DESCRIPTION
- RESEARCH METHODOLOGY AND AI PLATFORM
- DATA-DRIVEN DECISIONS FOR YOUR BUSINESS
- GLOSSARY AND SPECIFIC TERMS
-
2. EXECUTIVE SUMMARY
A Quick Overview of Market Performance
- KEY FINDINGS
- MARKET TRENDS This Chapter is Available Only for the Professional Edition PRO
-
3. MARKET OVERVIEW
Understanding the Current State of The Market and Its Prospects
- MARKET SIZE
- MARKET STRUCTURE
- TRADE BALANCE
- PER CAPITA CONSUMPTION
- MARKET FORECAST TO 2030
-
4. MOST PROMISING PRODUCT
Finding New Products to Diversify Your Business
This Chapter is Available Only for the Professional Edition PRO- TOP PRODUCTS TO DIVERSIFY YOUR BUSINESS
- BEST-SELLING PRODUCTS
- MOST CONSUMED PRODUCT
- MOST TRADED PRODUCT
- MOST PROFITABLE PRODUCT FOR EXPORT
-
5. MOST PROMISING SUPPLYING COUNTRIES
Choosing the Best Countries to Establish Your Sustainable Supply Chain
This Chapter is Available Only for the Professional Edition PRO- TOP COUNTRIES TO SOURCE YOUR PRODUCT
- TOP PRODUCING COUNTRIES
- TOP EXPORTING COUNTRIES
- LOW-COST EXPORTING COUNTRIES
-
6. MOST PROMISING OVERSEAS MARKETS
Choosing the Best Countries to Boost Your Exports
This Chapter is Available Only for the Professional Edition PRO- TOP OVERSEAS MARKETS FOR EXPORTING YOUR PRODUCT
- TOP CONSUMING MARKETS
- UNSATURATED MARKETS
- TOP IMPORTING MARKETS
- MOST PROFITABLE MARKETS
7. PRODUCTION
The Latest Trends and Insights into The Industry
- PRODUCTION VOLUME AND VALUE
8. IMPORTS
The Largest Import Supplying Countries
- IMPORTS FROM 2012–2023
- IMPORTS BY COUNTRY
- IMPORT PRICES BY COUNTRY
9. EXPORTS
The Largest Destinations for Exports
- EXPORTS FROM 2012–2023
- EXPORTS BY COUNTRY
- EXPORT PRICES BY COUNTRY
-
10. PROFILES OF MAJOR PRODUCERS
The Largest Producers on The Market and Their Profiles
This Chapter is Available Only for the Professional Edition PRO -
LIST OF TABLES
- Key Findings In 2023
- Market Volume, In Physical Terms, 2012–2023
- Market Value, 2012–2023
- Per Capita Consumption In 2012-2023
- Imports, In Physical Terms, By Country, 2012–2023
- Imports, In Value Terms, By Country, 2012–2023
- Import Prices, By Country Of Origin, 2012–2023
- Exports, In Physical Terms, By Country, 2012–2023
- Exports, In Value Terms, By Country, 2012–2023
- Export Prices, By Country Of Destination, 2012–2023
-
LIST OF FIGURES
- Market Volume, In Physical Terms, 2012–2023
- Market Value, 2012–2023
- Market Structure – Domestic Supply vs. Imports, In Physical Terms, 2012-2023
- Market Structure – Domestic Supply vs. Imports, In Value Terms, 2012-2023
- Trade Balance, In Physical Terms, 2012-2023
- Trade Balance, In Value Terms, 2012-2023
- Per Capita Consumption, 2012-2023
- Market Volume Forecast to 2030
- Market Value Forecast to 2030
- Products: Market Size And Growth, By Type
- Products: Average Per Capita Consumption, By Type
- Products: Exports And Growth, By Type
- Products: Export Prices And Growth, By Type
- Production Volume And Growth
- Exports And Growth
- Export Prices And Growth
- Market Size And Growth
- Per Capita Consumption
- Imports And Growth
- Import Prices
- Production, In Physical Terms, 2012–2023
- Production, In Value Terms, 2012–2023
- Imports, In Physical Terms, 2012–2023
- Imports, In Value Terms, 2012–2023
- Imports, In Physical Terms, By Country, 2023
- Imports, In Physical Terms, By Country, 2012–2023
- Imports, In Value Terms, By Country, 2012–2023
- Import Prices, By Country Of Origin, 2012–2023
- Exports, In Physical Terms, 2012–2023
- Exports, In Value Terms, 2012–2023
- Exports, In Physical Terms, By Country, 2023
- Exports, In Physical Terms, By Country, 2012–2023
- Exports, In Value Terms, By Country, 2012–2023
- Export Prices, By Country Of Destination, 2012–2023


