Netherlands - Chalk And Dolomite - Market Analysis, Forecast, Size, Trends And Insights
Get instant access to more than 2 million reports, dashboards, and datasets on the IndexBox Platform.
View PricingSignificant Drop in Chalk and Dolomite Imports to the Netherlands, Falling to $29M in 2023
Netherlands Chalk And Dolomite Imports
In 2023, purchases abroad of chalk and dolomite decreased by -12.9% to 829K tons, falling for the second year in a row after two years of growth. Over the period under review, imports saw a pronounced contraction. The pace of growth appeared the most rapid in 2016 when imports increased by 35%. Imports peaked at 1.1M tons in 2014; however, from 2015 to 2023, imports stood at a somewhat lower figure.
In value terms, chalk and dolomite imports fell to $29M (IndexBox estimates) in 2023. In general, imports showed a abrupt slump. The most prominent rate of growth was recorded in 2020 when imports increased by 27% against the previous year. Imports peaked at $59M in 2013; however, from 2014 to 2023, imports remained at a lower figure.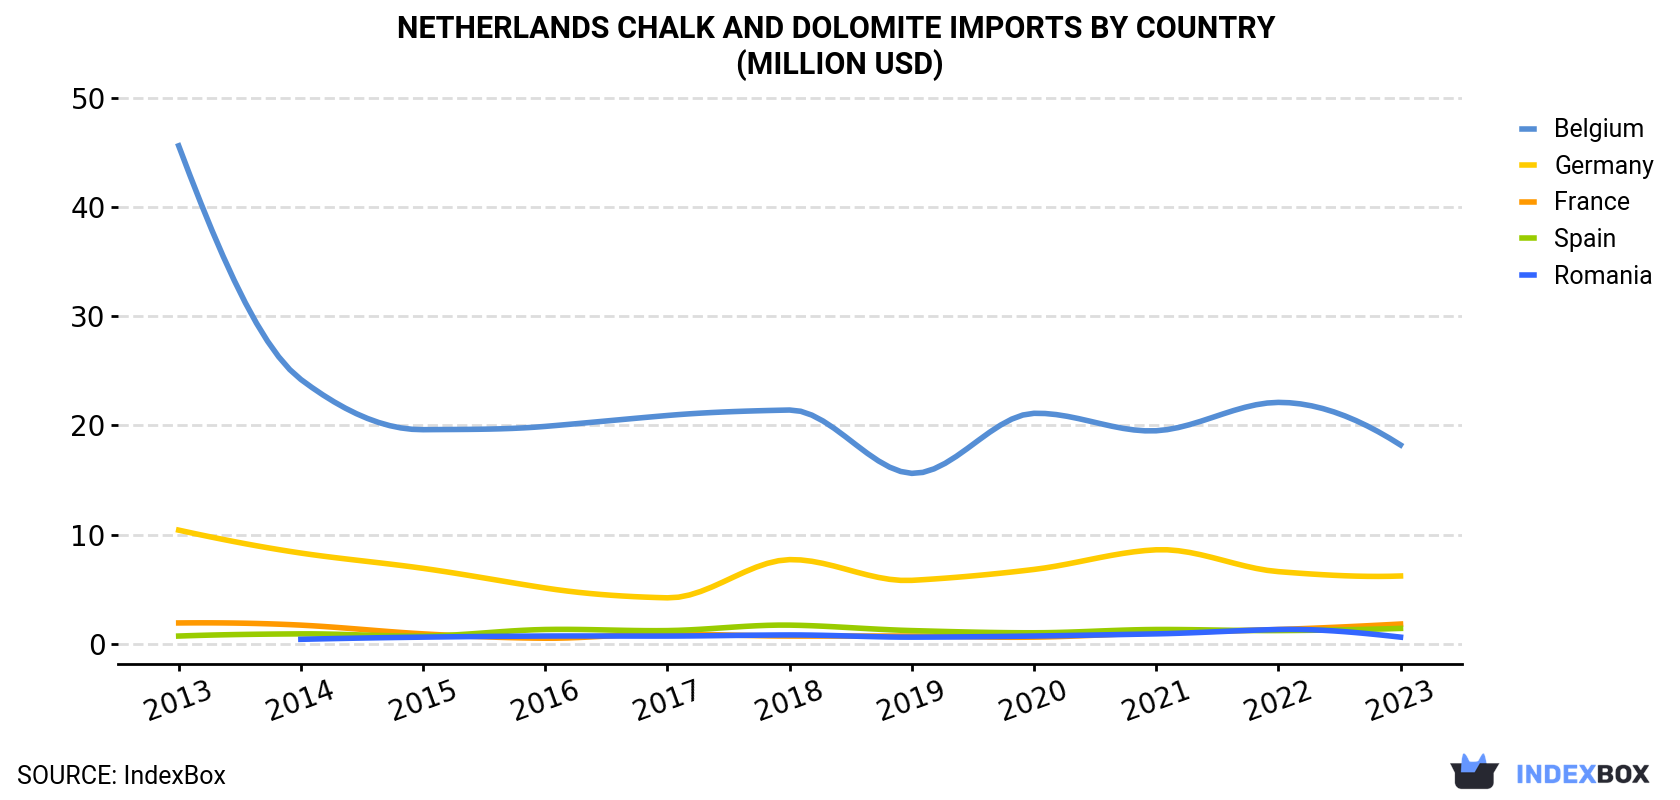
| COUNTRY | Import Value of Chalk And Dolomite in Netherlands (million USD) | ||||||||||
|---|---|---|---|---|---|---|---|---|---|---|---|
| 2013 | 2014 | 2015 | 2016 | 2017 | 2018 | 2019 | 2020 | 2021 | 2022 | 2023 | |
| Belgium | 45.6 | 24.2 | 19.6 | 19.9 | 20.9 | 21.4 | 15.6 | 21.1 | 19.5 | 22.1 | 18.2 |
| Germany | 10.4 | 8.3 | 6.9 | 5.1 | 4.2 | 7.7 | 5.8 | 6.8 | 8.6 | 6.6 | 6.2 |
| France | 1.9 | 1.7 | 0.9 | 0.5 | 0.9 | 0.7 | 0.7 | 0.6 | 1.0 | 1.3 | 1.8 |
| Spain | 0.7 | 0.9 | 0.7 | 1.3 | 1.2 | 1.7 | 1.2 | 1.0 | 1.3 | 1.2 | 1.4 |
| Romania | N/A | 0.4 | 0.6 | 0.7 | 0.7 | 0.8 | 0.6 | 0.7 | 0.9 | 1.3 | 0.6 |
| Others | 0.6 | 2.6 | 2.3 | 1.4 | 0.3 | 0.2 | 0.2 | 0.5 | 0.5 | 1.0 | 0.7 |
| Total | 59.3 | 38.2 | 31.2 | 29.0 | 28.2 | 32.5 | 24.1 | 30.7 | 31.8 | 33.5 | 28.7 |
Imports by Country
In 2023, Belgium (705K tons) constituted the largest supplier of chalk and dolomite to the Netherlands, with a 85% share of total imports. Moreover, chalk and dolomite imports from Belgium exceeded the figures recorded by the second-largest supplier, Germany (80K tons), ninefold. The third position in this ranking was taken by France (20K tons), with a 2.4% share.
From 2013 to 2023, the average annual rate of growth in terms of volume from Belgium amounted to -3.4%. The remaining supplying countries recorded the following average annual rates of imports growth: Germany (-0.6% per year) and France (+4.1% per year).
In value terms, Belgium ($18M) constituted the largest supplier of chalk and dolomite to the Netherlands, comprising 63% of total imports. The second position in the ranking was held by Germany ($6.2M), with a 21% share of total imports. It was followed by France, with a 6.1% share.
From 2013 to 2023, the average annual growth rate of value from Belgium totaled -8.8%. The remaining supplying countries recorded the following average annual rates of imports growth: Germany (-5.1% per year) and France (-0.8% per year).
Imports by Type
In 2023, dolomite (586K tons) constituted the largest type of chalk and dolomite supplied to the Netherlands, accounting for a 71% share of total imports. Moreover, dolomite exceeded the figures recorded for the second-largest type, chalk (243K tons), twofold.
From 2013 to 2023, the average annual growth rate of the volume of dolomite imports amounted to +1.9%.
In value terms, dolomite ($15M) and chalk ($14M) constituted the most imported types of chalk and dolomite in the Netherlands.
Import Prices by Country
In 2023, the chalk and dolomite price amounted to $35 per ton (CIF, Netherlands), leveling off at the previous year. Overall, the import price recorded a noticeable reduction. The most prominent rate of growth was recorded in 2015 an increase of 37% against the previous year. Over the period under review, average import prices hit record highs at $54 per ton in 2013; however, from 2014 to 2023, import prices stood at a somewhat lower figure.
Prices varied noticeably by country of origin: amid the top importers, the country with the highest price was France ($89 per ton), while the price for Belgium ($26 per ton) was amongst the lowest.
From 2013 to 2023, the most notable rate of growth in terms of prices was attained by Spain (-0.9%), while the prices for the other major suppliers experienced a decline.
This report provides an in-depth analysis of the chalk and dolomite market in the Netherlands. Within it, you will discover the latest data on market trends and opportunities by country, consumption, production and price developments, as well as the global trade (imports and exports). The forecast exhibits the market prospects through 2030.
Product coverage:
- Prodcom 08113010 - Chalk
- Prodcom 08113030 - Dolomite, crude, roughly trimmed or merely cut into rectangular or square blocks or slabs (excluding calcined or sintered dolomite, agglomerated dolomite and broken or crushed dolomite for concrete aggregates, road metalling or railway or other ballast)
Country coverage:
- Netherlands
Data coverage:
- Market volume and value
- Per Capita consumption
- Forecast of the market dynamics in the medium term
- Trade (exports and imports) in the Netherlands
- Export and import prices
- Market trends, drivers and restraints
- Key market players and their profiles
Reasons to buy this report:
- Take advantage of the latest data
- Find deeper insights into current market developments
- Discover vital success factors affecting the market
This report is designed for manufacturers, distributors, importers, and wholesalers, as well as for investors, consultants and advisors.
In this report, you can find information that helps you to make informed decisions on the following issues:
- How to diversify your business and benefit from new market opportunities
- How to load your idle production capacity
- How to boost your sales on overseas markets
- How to increase your profit margins
- How to make your supply chain more sustainable
- How to reduce your production and supply chain costs
- How to outsource production to other countries
- How to prepare your business for global expansion
While doing this research, we combine the accumulated expertise of our analysts and the capabilities of artificial intelligence. The AI-based platform, developed by our data scientists, constitutes the key working tool for business analysts, empowering them to discover deep insights and ideas from the marketing data.
-
1. INTRODUCTION
Making Data-Driven Decisions to Grow Your Business
- REPORT DESCRIPTION
- RESEARCH METHODOLOGY AND AI PLATFORM
- DATA-DRIVEN DECISIONS FOR YOUR BUSINESS
- GLOSSARY AND SPECIFIC TERMS
-
2. EXECUTIVE SUMMARY
A Quick Overview of Market Performance
- KEY FINDINGS
- MARKET TRENDS This Chapter is Available Only for the Professional Edition PRO
-
3. MARKET OVERVIEW
Understanding the Current State of The Market and Its Prospects
- MARKET SIZE
- MARKET STRUCTURE
- TRADE BALANCE
- PER CAPITA CONSUMPTION
- MARKET FORECAST TO 2030
-
4. MOST PROMISING PRODUCT
Finding New Products to Diversify Your Business
This Chapter is Available Only for the Professional Edition PRO- TOP PRODUCTS TO DIVERSIFY YOUR BUSINESS
- BEST-SELLING PRODUCTS
- MOST CONSUMED PRODUCT
- MOST TRADED PRODUCT
- MOST PROFITABLE PRODUCT FOR EXPORT
-
5. MOST PROMISING SUPPLYING COUNTRIES
Choosing the Best Countries to Establish Your Sustainable Supply Chain
This Chapter is Available Only for the Professional Edition PRO- TOP COUNTRIES TO SOURCE YOUR PRODUCT
- TOP PRODUCING COUNTRIES
- TOP EXPORTING COUNTRIES
- LOW-COST EXPORTING COUNTRIES
-
6. MOST PROMISING OVERSEAS MARKETS
Choosing the Best Countries to Boost Your Exports
This Chapter is Available Only for the Professional Edition PRO- TOP OVERSEAS MARKETS FOR EXPORTING YOUR PRODUCT
- TOP CONSUMING MARKETS
- UNSATURATED MARKETS
- TOP IMPORTING MARKETS
- MOST PROFITABLE MARKETS
7. PRODUCTION
The Latest Trends and Insights into The Industry
- PRODUCTION VOLUME AND VALUE
8. IMPORTS
The Largest Import Supplying Countries
- IMPORTS FROM 2012–2023
- IMPORTS BY COUNTRY
- IMPORT PRICES BY COUNTRY
9. EXPORTS
The Largest Destinations for Exports
- EXPORTS FROM 2012–2023
- EXPORTS BY COUNTRY
- EXPORT PRICES BY COUNTRY
-
10. PROFILES OF MAJOR PRODUCERS
The Largest Producers on The Market and Their Profiles
This Chapter is Available Only for the Professional Edition PRO -
LIST OF TABLES
- Key Findings In 2023
- Market Volume, In Physical Terms, 2012–2023
- Market Value, 2012–2023
- Per Capita Consumption In 2012-2023
- Imports, In Physical Terms, By Country, 2012–2023
- Imports, In Value Terms, By Country, 2012–2023
- Import Prices, By Country Of Origin, 2012–2023
- Exports, In Physical Terms, By Country, 2012–2023
- Exports, In Value Terms, By Country, 2012–2023
- Export Prices, By Country Of Destination, 2012–2023
-
LIST OF FIGURES
- Market Volume, In Physical Terms, 2012–2023
- Market Value, 2012–2023
- Market Structure – Domestic Supply vs. Imports, In Physical Terms, 2012-2023
- Market Structure – Domestic Supply vs. Imports, In Value Terms, 2012-2023
- Trade Balance, In Physical Terms, 2012-2023
- Trade Balance, In Value Terms, 2012-2023
- Per Capita Consumption, 2012-2023
- Market Volume Forecast to 2030
- Market Value Forecast to 2030
- Products: Market Size And Growth, By Type
- Products: Average Per Capita Consumption, By Type
- Products: Exports And Growth, By Type
- Products: Export Prices And Growth, By Type
- Production Volume And Growth
- Exports And Growth
- Export Prices And Growth
- Market Size And Growth
- Per Capita Consumption
- Imports And Growth
- Import Prices
- Production, In Physical Terms, 2012–2023
- Production, In Value Terms, 2012–2023
- Imports, In Physical Terms, 2012–2023
- Imports, In Value Terms, 2012–2023
- Imports, In Physical Terms, By Country, 2023
- Imports, In Physical Terms, By Country, 2012–2023
- Imports, In Value Terms, By Country, 2012–2023
- Import Prices, By Country Of Origin, 2012–2023
- Exports, In Physical Terms, 2012–2023
- Exports, In Value Terms, 2012–2023
- Exports, In Physical Terms, By Country, 2023
- Exports, In Physical Terms, By Country, 2012–2023
- Exports, In Value Terms, By Country, 2012–2023
- Export Prices, By Country Of Destination, 2012–2023


