Netherlands - Clays - Market Analysis, Forecast, Size, Trends and Insights
Get instant access to more than 2 million reports, dashboards, and datasets on the IndexBox Platform.
View PricingClay Imports Drop Sharply by 17% in the Netherlands, Reaching $187M in 2023
Netherlands Clay Imports
In 2023, imports of clays into the Netherlands expanded modestly to 952K tons, increasing by 1.8% against 2022 figures. Overall, imports, however, saw a slight reduction. The most prominent rate of growth was recorded in 2019 when imports increased by 26% against the previous year. Over the period under review, imports attained the maximum at 1.1M tons in 2013; however, from 2014 to 2023, imports remained at a lower figure.
In value terms, clay imports declined sharply to $187M (IndexBox estimates) in 2023. Over the period under review, imports saw a remarkable increase. The most prominent rate of growth was recorded in 2020 with an increase of 20%. Over the period under review, imports hit record highs at $225M in 2022, and then reduced remarkably in the following year.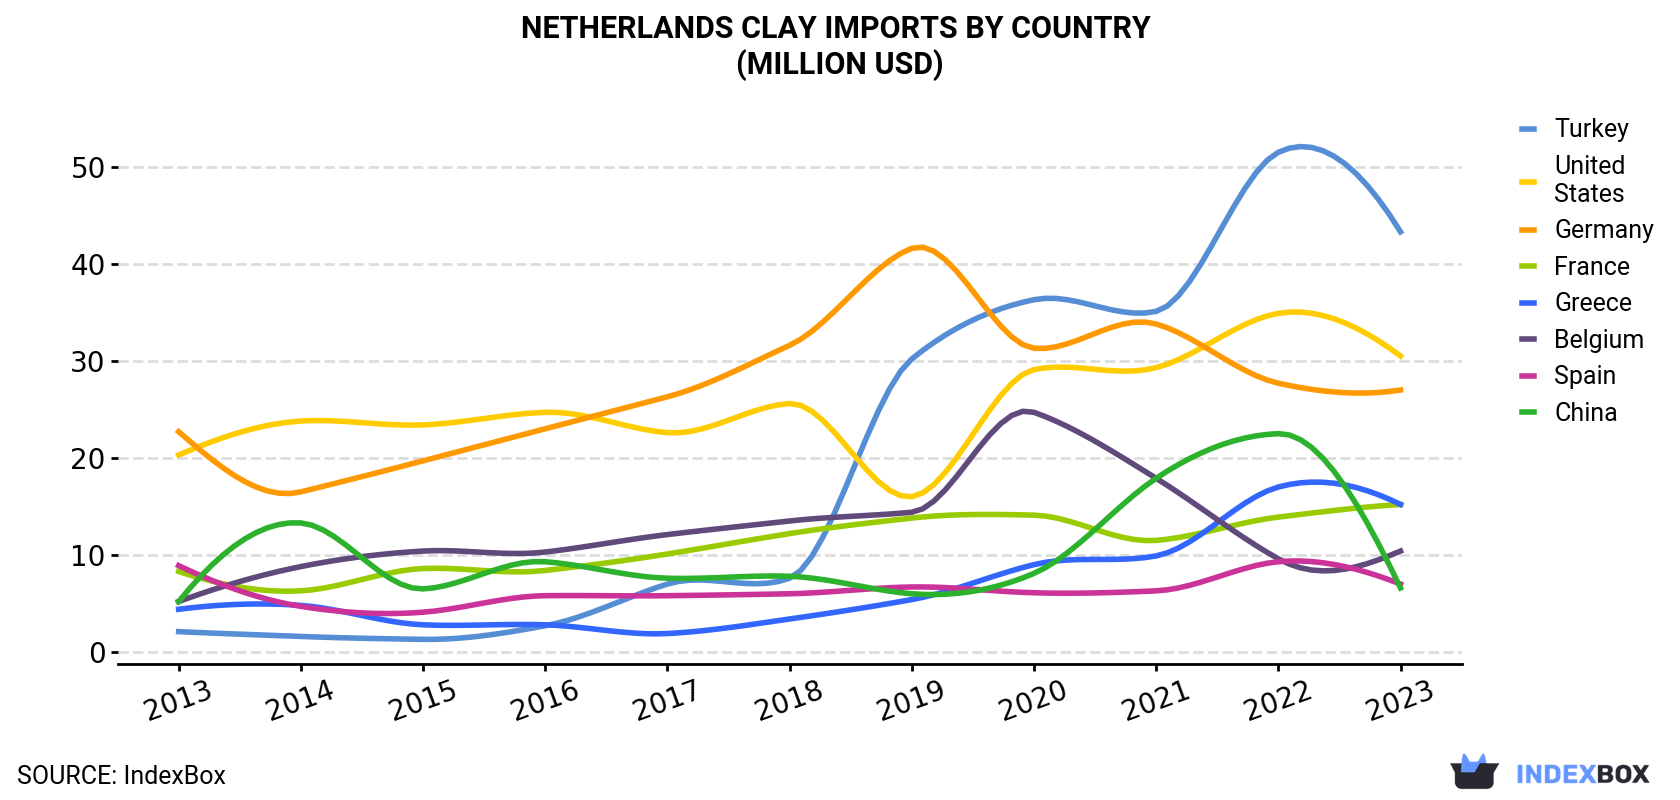
| COUNTRY | Import Value of Clay in Netherlands (million USD) | ||||||||||
|---|---|---|---|---|---|---|---|---|---|---|---|
| 2013 | 2014 | 2015 | 2016 | 2017 | 2018 | 2019 | 2020 | 2021 | 2022 | 2023 | |
| Turkey | 2.1 | 1.6 | 1.3 | 2.7 | 7.0 | 7.6 | 30.2 | 36.3 | 35.1 | 51.5 | 43.3 |
| United States | 20.3 | 23.8 | 23.4 | 24.7 | 22.6 | 25.6 | 16.0 | 29.1 | 29.3 | 34.9 | 30.5 |
| Germany | 22.7 | 16.5 | 19.7 | 23.0 | 26.3 | 31.6 | 41.6 | 31.3 | 33.8 | 27.7 | 27.0 |
| France | 8.3 | 6.3 | 8.6 | 8.4 | 10.1 | 12.2 | 13.8 | 14.1 | 11.5 | 13.9 | 15.2 |
| Greece | 4.4 | 4.8 | 2.8 | 2.8 | 1.9 | 3.4 | 5.4 | 9.0 | 9.9 | 17.0 | 15.2 |
| Belgium | 5.2 | 8.8 | 10.4 | 10.3 | 12.1 | 13.5 | 14.4 | 24.7 | 17.9 | 9.6 | 10.4 |
| Spain | 8.9 | 4.7 | 4.1 | 5.8 | 5.8 | 6.0 | 6.7 | 6.1 | 6.3 | 9.3 | 7.0 |
| China | 5.2 | 13.3 | 6.5 | 9.3 | 7.6 | 7.8 | 6.0 | 8.1 | 17.9 | 22.5 | 6.6 |
| Others | 37.7 | 36.3 | 32.4 | 24.7 | 22.3 | 24.6 | 21.5 | 28.4 | 39.3 | 38.7 | 32.0 |
| Total | 115 | 116 | 109 | 112 | 116 | 132 | 156 | 187 | 201 | 225 | 187 |
Imports by Country
Germany (407K tons), Turkey (234K tons) and the United States (68K tons) were the main suppliers of clay imports to the Netherlands, together accounting for 75% of total imports.
From 2013 to 2023, the biggest increases were recorded for Turkey (with a CAGR of +34.6%), while purchases for the other leaders experienced more modest paces of growth.
In value terms, the largest clay suppliers to the Netherlands were Turkey ($43M), the United States ($31M) and Germany ($27M), together comprising 54% of total imports.
Among the main suppliers, Turkey, with a CAGR of +35.1%, saw the highest growth rate of the value of imports, over the period under review, while purchases for the other leaders experienced more modest paces of growth.
Imports by Type
Clays for construction and industrial use (489K tons), bentonite (333K tons) and kaolin and kaolinic clays (88K tons) were the main products of clay imports to the Netherlands, with a combined 96% share of total imports.
From 2013 to 2023, the most notable rate of growth in terms of purchases, amongst the major product types, was attained by bentonite (with a CAGR of +4.1%), while imports for the other products experienced mixed trend patterns.
In value terms, clays with the largest imports in the Netherlands were bentonite ($90M), clays for construction and industrial use ($71M) and kaolin and kaolinic clays ($21M), together accounting for 97% of total imports.
Import Prices by Country
In 2023, the clay price amounted to $197 per ton (CIF, Netherlands), declining by -18.4% against the previous year. Overall, import price indicated a resilient expansion from 2013 to 2023: its price increased at an average annual rate of +6.3% over the last decade. The trend pattern, however, indicated some noticeable fluctuations being recorded throughout the analyzed period. The pace of growth was the most pronounced in 2014 an increase of 40% against the previous year. Over the period under review, average import prices attained the peak figure at $241 per ton in 2022, and then declined dramatically in the following year.
Prices varied noticeably by country of origin: amid the top importers, the country with the highest price was Greece ($734 per ton), while the price for Germany ($66 per ton) was amongst the lowest.
From 2013 to 2023, the most notable rate of growth in terms of prices was attained by Cyprus (+20.2%), while the prices for the other major suppliers experienced more modest paces of growth.
This report provides an in-depth analysis of the clay market in the Netherlands. Within it, you will discover the latest data on market trends and opportunities by country, consumption, production and price developments, as well as the global trade (imports and exports). The forecast exhibits the market prospects through 2030.
Product coverage:
- Prodcom 08122140 - Kaolin
- Prodcom 08122160 - Kaolinitic clays (ball and plastic clays)
- Prodcom 08122210 - Bentonite
- Prodcom 08122230 - Fireclay
- Prodcom 08122250 - Common clays and shales for construction use (excluding bentonite, fireclay, expanded clays, kaolin and kaolinic clays), a ndalusite, kyanite and sillimanite, mullite, chamotte or dinas earths
Country coverage:
- Netherlands
Data coverage:
- Market volume and value
- Per Capita consumption
- Forecast of the market dynamics in the medium term
- Trade (exports and imports) in the Netherlands
- Export and import prices
- Market trends, drivers and restraints
- Key market players and their profiles
Reasons to buy this report:
- Take advantage of the latest data
- Find deeper insights into current market developments
- Discover vital success factors affecting the market
This report is designed for manufacturers, distributors, importers, and wholesalers, as well as for investors, consultants and advisors.
In this report, you can find information that helps you to make informed decisions on the following issues:
- How to diversify your business and benefit from new market opportunities
- How to load your idle production capacity
- How to boost your sales on overseas markets
- How to increase your profit margins
- How to make your supply chain more sustainable
- How to reduce your production and supply chain costs
- How to outsource production to other countries
- How to prepare your business for global expansion
While doing this research, we combine the accumulated expertise of our analysts and the capabilities of artificial intelligence. The AI-based platform, developed by our data scientists, constitutes the key working tool for business analysts, empowering them to discover deep insights and ideas from the marketing data.
-
1. INTRODUCTION
Making Data-Driven Decisions to Grow Your Business
- REPORT DESCRIPTION
- RESEARCH METHODOLOGY AND AI PLATFORM
- DATA-DRIVEN DECISIONS FOR YOUR BUSINESS
- GLOSSARY AND SPECIFIC TERMS
-
2. EXECUTIVE SUMMARY
A Quick Overview of Market Performance
- KEY FINDINGS
- MARKET TRENDS This Chapter is Available Only for the Professional Edition PRO
-
3. MARKET OVERVIEW
Understanding the Current State of The Market and Its Prospects
- MARKET SIZE
- MARKET STRUCTURE
- TRADE BALANCE
- PER CAPITA CONSUMPTION
- MARKET FORECAST TO 2030
-
4. MOST PROMISING PRODUCT
Finding New Products to Diversify Your Business
This Chapter is Available Only for the Professional Edition PRO- TOP PRODUCTS TO DIVERSIFY YOUR BUSINESS
- BEST-SELLING PRODUCTS
- MOST CONSUMED PRODUCT
- MOST TRADED PRODUCT
- MOST PROFITABLE PRODUCT FOR EXPORT
-
5. MOST PROMISING SUPPLYING COUNTRIES
Choosing the Best Countries to Establish Your Sustainable Supply Chain
This Chapter is Available Only for the Professional Edition PRO- TOP COUNTRIES TO SOURCE YOUR PRODUCT
- TOP PRODUCING COUNTRIES
- TOP EXPORTING COUNTRIES
- LOW-COST EXPORTING COUNTRIES
-
6. MOST PROMISING OVERSEAS MARKETS
Choosing the Best Countries to Boost Your Exports
This Chapter is Available Only for the Professional Edition PRO- TOP OVERSEAS MARKETS FOR EXPORTING YOUR PRODUCT
- TOP CONSUMING MARKETS
- UNSATURATED MARKETS
- TOP IMPORTING MARKETS
- MOST PROFITABLE MARKETS
7. PRODUCTION
The Latest Trends and Insights into The Industry
- PRODUCTION VOLUME AND VALUE
8. IMPORTS
The Largest Import Supplying Countries
- IMPORTS FROM 2012–2023
- IMPORTS BY COUNTRY
- IMPORT PRICES BY COUNTRY
9. EXPORTS
The Largest Destinations for Exports
- EXPORTS FROM 2012–2023
- EXPORTS BY COUNTRY
- EXPORT PRICES BY COUNTRY
-
10. PROFILES OF MAJOR PRODUCERS
The Largest Producers on The Market and Their Profiles
This Chapter is Available Only for the Professional Edition PRO -
LIST OF TABLES
- Key Findings In 2023
- Market Volume, In Physical Terms, 2012–2023
- Market Value, 2012–2023
- Per Capita Consumption In 2012-2023
- Imports, In Physical Terms, By Country, 2012–2023
- Imports, In Value Terms, By Country, 2012–2023
- Import Prices, By Country Of Origin, 2012–2023
- Exports, In Physical Terms, By Country, 2012–2023
- Exports, In Value Terms, By Country, 2012–2023
- Export Prices, By Country Of Destination, 2012–2023
-
LIST OF FIGURES
- Market Volume, In Physical Terms, 2012–2023
- Market Value, 2012–2023
- Market Structure – Domestic Supply vs. Imports, In Physical Terms, 2012-2023
- Market Structure – Domestic Supply vs. Imports, In Value Terms, 2012-2023
- Trade Balance, In Physical Terms, 2012-2023
- Trade Balance, In Value Terms, 2012-2023
- Per Capita Consumption, 2012-2023
- Market Volume Forecast to 2030
- Market Value Forecast to 2030
- Products: Market Size And Growth, By Type
- Products: Average Per Capita Consumption, By Type
- Products: Exports And Growth, By Type
- Products: Export Prices And Growth, By Type
- Production Volume And Growth
- Exports And Growth
- Export Prices And Growth
- Market Size And Growth
- Per Capita Consumption
- Imports And Growth
- Import Prices
- Production, In Physical Terms, 2012–2023
- Production, In Value Terms, 2012–2023
- Imports, In Physical Terms, 2012–2023
- Imports, In Value Terms, 2012–2023
- Imports, In Physical Terms, By Country, 2023
- Imports, In Physical Terms, By Country, 2012–2023
- Imports, In Value Terms, By Country, 2012–2023
- Import Prices, By Country Of Origin, 2012–2023
- Exports, In Physical Terms, 2012–2023
- Exports, In Value Terms, 2012–2023
- Exports, In Physical Terms, By Country, 2023
- Exports, In Physical Terms, By Country, 2012–2023
- Exports, In Value Terms, By Country, 2012–2023
- Export Prices, By Country Of Destination, 2012–2023


