Netherlands - Fertilizers - Market Analysis, Forecast, Size, Trends and Insights
Get instant access to more than 2 million reports, dashboards, and datasets on the IndexBox Platform.
View PricingDutch Fertilizer Exports Plummet to $2.6B in 2023
Netherlands Fertilizers Exports
In 2023, the amount of fertilizers exported from the Netherlands dropped slightly to 6.3M tons, which is down by -4.3% against the previous year's figure. In general, exports showed a perceptible setback. The most prominent rate of growth was recorded in 2016 when exports increased by 18% against the previous year. As a result, the exports attained the peak of 9.1M tons. From 2017 to 2023, the growth of the exports failed to regain momentum.
In value terms, fertilizer exports reduced dramatically to $2.6B (IndexBox estimates) in 2023. Overall, exports recorded a relatively flat trend pattern. The pace of growth was the most pronounced in 2021 with an increase of 51%. The exports peaked at $4B in 2022, and then contracted remarkably in the following year.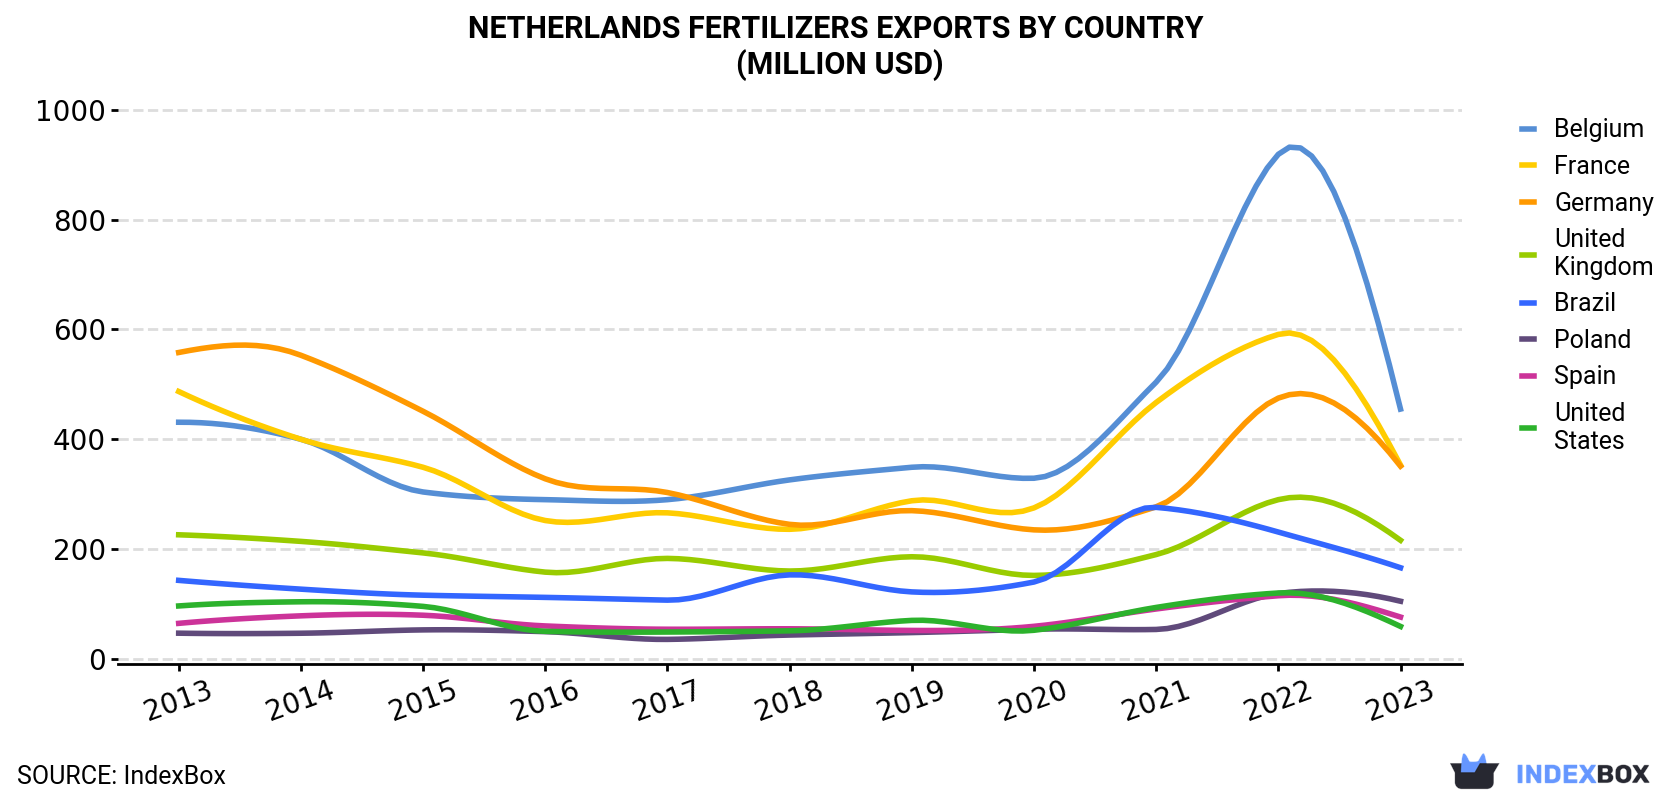
| COUNTRY | Export Value of Fertilizers in Netherlands (million USD) | ||||||||||
|---|---|---|---|---|---|---|---|---|---|---|---|
| 2013 | 2014 | 2015 | 2016 | 2017 | 2018 | 2019 | 2020 | 2021 | 2022 | 2023 | |
| Belgium | 431 | 400 | 304 | 290 | 290 | 326 | 349 | 329 | 504 | 919 | 455 |
| France | 487 | 400 | 349 | 252 | 266 | 236 | 288 | 275 | 467 | 591 | 353 |
| Germany | 558 | 553 | 451 | 328 | 303 | 245 | 270 | 235 | 277 | 475 | 351 |
| United Kingdom | 226 | 214 | 193 | 158 | 183 | 160 | 186 | 152 | 190 | 290 | 216 |
| Brazil | 143 | 127 | 116 | 112 | 107 | 153 | 122 | 140 | 276 | 231 | 166 |
| Poland | 46.8 | 46.7 | 52.8 | 49.6 | 35.5 | 43.4 | 47.9 | 54.0 | 53.6 | 119 | 105 |
| Spain | 64.7 | 78.4 | 79.5 | 60.0 | 54.0 | 54.8 | 51.8 | 59.3 | 90.9 | 115 | 76.2 |
| United States | 96.4 | 104 | 95.6 | 50.2 | 48.9 | 51.1 | 70.1 | 52.1 | 93.7 | 120 | 59.1 |
| Others | 627 | 656 | 600 | 534 | 595 | 570 | 565 | 554 | 848 | 1,158 | 786 |
| Total | 2,681 | 2,579 | 2,241 | 1,834 | 1,882 | 1,839 | 1,949 | 1,850 | 2,800 | 4,018 | 2,567 |
Exports by Country
Belgium (1.5M tons), France (1M tons) and Germany (783K tons) were the main destinations of fertilizer exports from the Netherlands, with a combined 53% share of total exports. the UK, Brazil, Poland, the United States and Spain lagged somewhat behind, together accounting for a further 25%.
From 2013 to 2023, the biggest increases were recorded for Poland (with a CAGR of +8.2%), while shipments for the other leaders experienced mixed trend patterns.
In value terms, the largest markets for fertilizer exported from the Netherlands were Belgium ($455M), France ($353M) and Germany ($351M), together comprising 45% of total exports. the UK, Brazil, Poland, Spain and the United States lagged somewhat behind, together comprising a further 24%.
Poland, with a CAGR of +8.4%, saw the highest rates of growth with regard to the value of exports, in terms of the main countries of destination over the period under review, while shipments for the other leaders experienced more modest paces of growth.
Exports by Type
Calcium ammonium nitrate (CAN) (1.8M tons), urea (1.4M tons) and mixed phosphorus and potassium (PK) fertilizers (616K tons) were the main products of fertilizer exports from the Netherlands, together accounting for 60% of total exports. Ammonium sulphate, mixtures of urea and ammonium nitrate in aqueous or ammoniacal solution, carnallite, sylvite and other crude natural potassium salts, potassium magnesium sulphate and mixtures of potassic fertilisers, potassium chloride (MOP), mixed nitrogen, phosphorus and potassium (NPK) fertilizers, superphosphates, nitrogenous fertilizers n.e.c., potassium nitrates, mixed nitrogen and phosphorus (NP) fertilizers, diammonium phosphate, monoammonium phosphate (MAP), ammonium nitrate, potassium sulphate (SOP), sodium nitrate and phosphatic fertilizers other than superphosphates lagged somewhat behind, together accounting for a further 40%.
From 2013 to 2023, the most notable rate of growth in terms of shipments, amongst the major product types, was attained by carnallite, sylvite and other crude natural potassium salts, potassium magnesium sulphate and mixtures of potassic fertilisers (with a CAGR of +25.8%), while the other products experienced more modest paces of growth.
In value terms, fertilizers with the largest exports in the Netherlands were calcium ammonium nitrate (CAN) ($629M), urea ($536M) and mixed nitrogen, phosphorus and potassium (NPK) fertilizers ($320M), with a combined 58% share of total exports. Mixtures of urea and ammonium nitrate in aqueous or ammoniacal solution, potassium chloride (MOP), mixed phosphorus and potassium (PK) fertilizers, ammonium sulphate, superphosphates, potassium nitrates, nitrogenous fertilizers n.e.c., mixed nitrogen and phosphorus (NP) fertilizers, diammonium phosphate, monoammonium phosphate (MAP), carnallite, sylvite and other crude natural potassium salts, potassium magnesium sulphate and mixtures of potassic fertilisers, phosphatic fertilizers other than superphosphates, sodium nitrate, potassium sulphate (SOP) and ammonium nitrate lagged somewhat behind, together accounting for a further 42%.
Phosphatic fertilizers other than superphosphates, with a CAGR of +73.5%, saw the highest rates of growth with regard to the value of exports, among the main product categories over the period under review, while shipments for the other products experienced more modest paces of growth.
Export Prices by Country
In 2023, the fertilizers price stood at $410 per ton (FOB, Netherlands), with a decrease of -33.3% against the previous year. Overall, the export price, however, showed measured growth. The most prominent rate of growth was recorded in 2022 when the average export price increased by 81% against the previous year. As a result, the export price attained the peak level of $614 per ton, and then shrank dramatically in the following year.
Prices varied noticeably by country of destination: amid the top suppliers, the country with the highest price was Spain ($602 per ton), while the average price for exports to Mexico ($294 per ton) was amongst the lowest.
From 2013 to 2023, the most notable rate of growth in terms of prices was recorded for supplies to Ireland (+5.5%), while the prices for the other major destinations experienced more modest paces of growth.
This report provides an in-depth analysis of the fertilizer market in the Netherlands. Within it, you will discover the latest data on market trends and opportunities by country, consumption, production and price developments, as well as the global trade (imports and exports). The forecast exhibits the market prospects through 2030.
Product coverage:
- FCL 4025 - Potassium nitrate
- FCL 4004 - Calcium ammonium nitrate (CAN) and other mixtures with calcium carbonate
- FCL 4005 - Sodium nitrate
- FCL 4023 - Monoammonium phosphate (MAP)
- FCL 4001 - Urea
- FCL 4002 - Ammonium sulphate
- FCL 4003 - Ammonium nitrate (AN)
- FCL 4006 - Urea and ammonium nitrate solutions (UAN)
- FCL 4016 - Potassium chloride (muriate of potash) (MOP)
- FCL 4021 - NPK fertilizers
- FCL 4014 - Other phosphatic fertilizers, n.e.c.
- FCL 4022 - Diammonium phosphate (DAP)
- FCL 4027 - PK compounds
- FCL 4024 - Other NP compounds
- FCL 4008 - Other nitrogenous fertilizers, n.e.c.
- FCL 4012 - Superphosphates above 35%
- FCL 4013 - Superphosphates, other
- FCL 4018 - Other potassic fertilizers, n.e.c.
Country coverage:
- Netherlands
Data coverage:
- Market volume and value
- Per Capita consumption
- Forecast of the market dynamics in the medium term
- Trade (exports and imports) in the Netherlands
- Export and import prices
- Market trends, drivers and restraints
- Key market players and their profiles
Reasons to buy this report:
- Take advantage of the latest data
- Find deeper insights into current market developments
- Discover vital success factors affecting the market
This report is designed for manufacturers, distributors, importers, and wholesalers, as well as for investors, consultants and advisors.
In this report, you can find information that helps you to make informed decisions on the following issues:
- How to diversify your business and benefit from new market opportunities
- How to load your idle production capacity
- How to boost your sales on overseas markets
- How to increase your profit margins
- How to make your supply chain more sustainable
- How to reduce your production and supply chain costs
- How to outsource production to other countries
- How to prepare your business for global expansion
While doing this research, we combine the accumulated expertise of our analysts and the capabilities of artificial intelligence. The AI-based platform, developed by our data scientists, constitutes the key working tool for business analysts, empowering them to discover deep insights and ideas from the marketing data.
-
1. INTRODUCTION
Making Data-Driven Decisions to Grow Your Business
- REPORT DESCRIPTION
- RESEARCH METHODOLOGY AND AI PLATFORM
- DATA-DRIVEN DECISIONS FOR YOUR BUSINESS
- GLOSSARY AND SPECIFIC TERMS
-
2. EXECUTIVE SUMMARY
A Quick Overview of Market Performance
- KEY FINDINGS
- MARKET TRENDS This Chapter is Available Only for the Professional Edition PRO
-
3. MARKET OVERVIEW
Understanding the Current State of The Market and Its Prospects
- MARKET SIZE
- MARKET STRUCTURE
- TRADE BALANCE
- PER CAPITA CONSUMPTION
- MARKET FORECAST TO 2030
-
4. MOST PROMISING PRODUCT
Finding New Products to Diversify Your Business
This Chapter is Available Only for the Professional Edition PRO- TOP PRODUCTS TO DIVERSIFY YOUR BUSINESS
- BEST-SELLING PRODUCTS
- MOST CONSUMED PRODUCT
- MOST TRADED PRODUCT
- MOST PROFITABLE PRODUCT FOR EXPORT
-
5. MOST PROMISING SUPPLYING COUNTRIES
Choosing the Best Countries to Establish Your Sustainable Supply Chain
This Chapter is Available Only for the Professional Edition PRO- TOP COUNTRIES TO SOURCE YOUR PRODUCT
- TOP PRODUCING COUNTRIES
- TOP EXPORTING COUNTRIES
- LOW-COST EXPORTING COUNTRIES
-
6. MOST PROMISING OVERSEAS MARKETS
Choosing the Best Countries to Boost Your Exports
This Chapter is Available Only for the Professional Edition PRO- TOP OVERSEAS MARKETS FOR EXPORTING YOUR PRODUCT
- TOP CONSUMING MARKETS
- UNSATURATED MARKETS
- TOP IMPORTING MARKETS
- MOST PROFITABLE MARKETS
7. PRODUCTION
The Latest Trends and Insights into The Industry
- PRODUCTION VOLUME AND VALUE
8. IMPORTS
The Largest Import Supplying Countries
- IMPORTS FROM 2012–2023
- IMPORTS BY COUNTRY
- IMPORT PRICES BY COUNTRY
9. EXPORTS
The Largest Destinations for Exports
- EXPORTS FROM 2012–2023
- EXPORTS BY COUNTRY
- EXPORT PRICES BY COUNTRY
-
10. PROFILES OF MAJOR PRODUCERS
The Largest Producers on The Market and Their Profiles
This Chapter is Available Only for the Professional Edition PRO -
LIST OF TABLES
- Key Findings In 2023
- Market Volume, In Physical Terms, 2012–2023
- Market Value, 2012–2023
- Per Capita Consumption In 2012-2023
- Imports, In Physical Terms, By Country, 2012–2023
- Imports, In Value Terms, By Country, 2012–2023
- Import Prices, By Country Of Origin, 2012–2023
- Exports, In Physical Terms, By Country, 2012–2023
- Exports, In Value Terms, By Country, 2012–2023
- Export Prices, By Country Of Destination, 2012–2023
-
LIST OF FIGURES
- Market Volume, In Physical Terms, 2012–2023
- Market Value, 2012–2023
- Market Structure – Domestic Supply vs. Imports, In Physical Terms, 2012-2023
- Market Structure – Domestic Supply vs. Imports, In Value Terms, 2012-2023
- Trade Balance, In Physical Terms, 2012-2023
- Trade Balance, In Value Terms, 2012-2023
- Per Capita Consumption, 2012-2023
- Market Volume Forecast to 2030
- Market Value Forecast to 2030
- Products: Market Size And Growth, By Type
- Products: Average Per Capita Consumption, By Type
- Products: Exports And Growth, By Type
- Products: Export Prices And Growth, By Type
- Production Volume And Growth
- Exports And Growth
- Export Prices And Growth
- Market Size And Growth
- Per Capita Consumption
- Imports And Growth
- Import Prices
- Production, In Physical Terms, 2012–2023
- Production, In Value Terms, 2012–2023
- Imports, In Physical Terms, 2012–2023
- Imports, In Value Terms, 2012–2023
- Imports, In Physical Terms, By Country, 2023
- Imports, In Physical Terms, By Country, 2012–2023
- Imports, In Value Terms, By Country, 2012–2023
- Import Prices, By Country Of Origin, 2012–2023
- Exports, In Physical Terms, 2012–2023
- Exports, In Value Terms, 2012–2023
- Exports, In Physical Terms, By Country, 2023
- Exports, In Physical Terms, By Country, 2012–2023
- Exports, In Value Terms, By Country, 2012–2023
- Export Prices, By Country Of Destination, 2012–2023


