
Netherlands - Video Monitors - Market Analysis, Forecast, Size, Trends and Insights
Get instant access to more than 2 million reports, dashboards, and datasets on the IndexBox Platform.
View PricingThe Netherlands' Export of Video Monitors Plummets to $4.5 Billion in 2023
Netherlands Video Monitor Exports
In 2023, after three years of growth, there was significant decline in overseas shipments of video monitors, when their volume decreased by -23.7% to 18M units. Overall, exports, however, enjoyed temperate growth. The pace of growth appeared the most rapid in 2020 with an increase of 92%. Over the period under review, the exports hit record highs at 24M units in 2022, and then dropped notably in the following year.
In value terms, video monitor exports reduced dramatically to $4.5B (IndexBox estimates) in 2023. In general, exports, however, enjoyed a buoyant expansion. The pace of growth was the most pronounced in 2020 with an increase of 67% against the previous year. The exports peaked at $5.5B in 2022, and then declined markedly in the following year.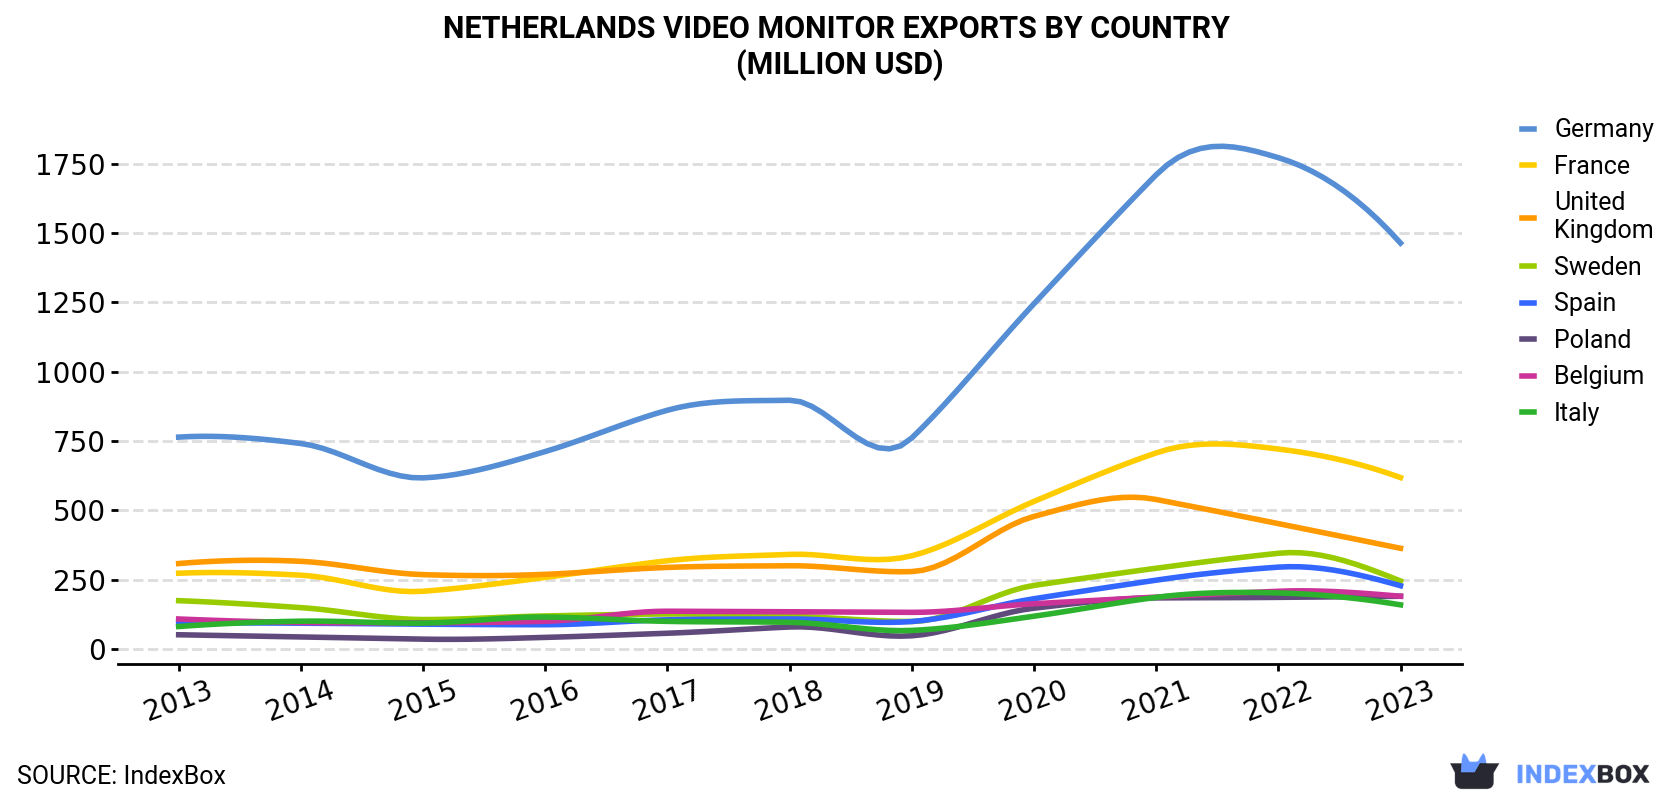
| COUNTRY | Export Value of Video Monitor in Netherlands (million USD) | ||||||||||
|---|---|---|---|---|---|---|---|---|---|---|---|
| 2013 | 2014 | 2015 | 2016 | 2017 | 2018 | 2019 | 2020 | 2021 | 2022 | 2023 | |
| Germany | 764 | 741 | 617 | 712 | 861 | 897 | 761 | 1,245 | 1,710 | 1,772 | 1,464 |
| France | 273 | 266 | 208 | 258 | 318 | 341 | 336 | 532 | 707 | 721 | 618 |
| United Kingdom | 308 | 316 | 268 | 269 | 294 | 300 | 279 | 478 | 539 | 452 | 363 |
| Sweden | 174 | 149 | 106 | 119 | 126 | 118 | 99.0 | 229 | 291 | 345 | 245 |
| Spain | 94.5 | 92.8 | 89.3 | 87.3 | 105 | 108 | 98.9 | 181 | 248 | 295 | 228 |
| Poland | 51.1 | 43.2 | 35.3 | 41.6 | 56.6 | 79.1 | 47.4 | 147 | 184 | 186 | 190 |
| Belgium | 108 | 95.6 | 94.2 | 99.8 | 136 | 134 | 132 | 163 | 187 | 208 | 190 |
| Italy | 80.8 | 100 | 93.2 | 115 | 99.4 | 96.1 | 66.8 | 118 | 186 | 202 | 159 |
| Others | 647 | 564 | 438 | 542 | 609 | 583 | 568 | 908 | 1,137 | 1,315 | 1,049 |
| Total | 2,499 | 2,368 | 1,950 | 2,244 | 2,605 | 2,657 | 2,389 | 4,001 | 5,189 | 5,496 | 4,506 |
Exports by Country
Germany (5.5M units), France (2.9M units) and the UK (1.3M units) were the main destinations of video monitor exports from the Netherlands, with a combined 53% share of total exports. Spain, Sweden, Italy, Poland and Belgium lagged somewhat behind, together comprising a further 24%.
From 2013 to 2023, the most notable rate of growth in terms of shipments, amongst the main countries of destination, was attained by Poland (with a CAGR of +10.8%), while the other leaders experienced more modest paces of growth.
In value terms, Germany ($1.5B) remains the key foreign market for video monitors exports from the Netherlands, comprising 32% of total exports. The second position in the ranking was held by France ($618M), with a 14% share of total exports. It was followed by the UK, with an 8.1% share.
From 2013 to 2023, the average annual growth rate of value to Germany totaled +6.7%. Exports to the other major destinations recorded the following average annual rates of exports growth: France (+8.5% per year) and the UK (+1.7% per year).
Export Prices by Country
In 2023, the video monitor price stood at $246 per unit (FOB, Netherlands), increasing by 7.5% against the previous year. Over the last decade, it increased at an average annual rate of +1.5%. The most prominent rate of growth was recorded in 2017 an increase of 13% against the previous year. Over the period under review, the average export prices attained the peak figure at $252 per unit in 2019; however, from 2020 to 2023, the export prices remained at a lower figure.
Prices varied noticeably by country of destination: amid the top suppliers, the country with the highest price was Russia ($379 per unit), while the average price for exports to Italy ($181 per unit) was amongst the lowest.
From 2013 to 2023, the most notable rate of growth in terms of prices was recorded for supplies to Russia (+6.8%), while the prices for the other major destinations experienced more modest paces of growth.
This report provides an in-depth analysis of the video monitor market in the Netherlands. Within it, you will discover the latest data on market trends and opportunities by country, consumption, production and price developments, as well as the global trade (imports and exports). The forecast exhibits the market prospects through 2030.
Product coverage:
- Prodcom 26403420 - Video projectors
- Prodcom 26403440 - Colour video monitors with cathode-ray tube
- Prodcom 26403460 - Flat panel video monitor, LCD or plasma, etc., without tuner (colour video monitors) (excluding with cathode-ray tube)
- Prodcom 26403480 - Black and white or other monochrome video monitors
- Prodcom 26403400 -
- Prodcom 26201700 - Monitors and projectors, principally used in an automatic data processing system
Country coverage:
- Netherlands
Data coverage:
- Market volume and value
- Per Capita consumption
- Forecast of the market dynamics in the medium term
- Trade (exports and imports) in the Netherlands
- Export and import prices
- Market trends, drivers and restraints
- Key market players and their profiles
Reasons to buy this report:
- Take advantage of the latest data
- Find deeper insights into current market developments
- Discover vital success factors affecting the market
This report is designed for manufacturers, distributors, importers, and wholesalers, as well as for investors, consultants and advisors.
In this report, you can find information that helps you to make informed decisions on the following issues:
- How to diversify your business and benefit from new market opportunities
- How to load your idle production capacity
- How to boost your sales on overseas markets
- How to increase your profit margins
- How to make your supply chain more sustainable
- How to reduce your production and supply chain costs
- How to outsource production to other countries
- How to prepare your business for global expansion
While doing this research, we combine the accumulated expertise of our analysts and the capabilities of artificial intelligence. The AI-based platform, developed by our data scientists, constitutes the key working tool for business analysts, empowering them to discover deep insights and ideas from the marketing data.
-
1. INTRODUCTION
Making Data-Driven Decisions to Grow Your Business
- REPORT DESCRIPTION
- RESEARCH METHODOLOGY AND AI PLATFORM
- DATA-DRIVEN DECISIONS FOR YOUR BUSINESS
- GLOSSARY AND SPECIFIC TERMS
-
2. EXECUTIVE SUMMARY
A Quick Overview of Market Performance
- KEY FINDINGS
- MARKET TRENDS This Chapter is Available Only for the Professional Edition PRO
-
3. MARKET OVERVIEW
Understanding the Current State of The Market and Its Prospects
- MARKET SIZE
- MARKET STRUCTURE
- TRADE BALANCE
- PER CAPITA CONSUMPTION
- MARKET FORECAST TO 2030
-
4. MOST PROMISING PRODUCT
Finding New Products to Diversify Your Business
This Chapter is Available Only for the Professional Edition PRO- TOP PRODUCTS TO DIVERSIFY YOUR BUSINESS
- BEST-SELLING PRODUCTS
- MOST CONSUMED PRODUCT
- MOST TRADED PRODUCT
- MOST PROFITABLE PRODUCT FOR EXPORT
-
5. MOST PROMISING SUPPLYING COUNTRIES
Choosing the Best Countries to Establish Your Sustainable Supply Chain
This Chapter is Available Only for the Professional Edition PRO- TOP COUNTRIES TO SOURCE YOUR PRODUCT
- TOP PRODUCING COUNTRIES
- TOP EXPORTING COUNTRIES
- LOW-COST EXPORTING COUNTRIES
-
6. MOST PROMISING OVERSEAS MARKETS
Choosing the Best Countries to Boost Your Exports
This Chapter is Available Only for the Professional Edition PRO- TOP OVERSEAS MARKETS FOR EXPORTING YOUR PRODUCT
- TOP CONSUMING MARKETS
- UNSATURATED MARKETS
- TOP IMPORTING MARKETS
- MOST PROFITABLE MARKETS
7. PRODUCTION
The Latest Trends and Insights into The Industry
- PRODUCTION VOLUME AND VALUE
8. IMPORTS
The Largest Import Supplying Countries
- IMPORTS FROM 2012–2023
- IMPORTS BY COUNTRY
- IMPORT PRICES BY COUNTRY
9. EXPORTS
The Largest Destinations for Exports
- EXPORTS FROM 2012–2023
- EXPORTS BY COUNTRY
- EXPORT PRICES BY COUNTRY
-
10. PROFILES OF MAJOR PRODUCERS
The Largest Producers on The Market and Their Profiles
This Chapter is Available Only for the Professional Edition PRO -
LIST OF TABLES
- Key Findings In 2023
- Market Volume, In Physical Terms, 2012–2023
- Market Value, 2012–2023
- Per Capita Consumption In 2012-2023
- Imports, In Physical Terms, By Country, 2012–2023
- Imports, In Value Terms, By Country, 2012–2023
- Import Prices, By Country Of Origin, 2012–2023
- Exports, In Physical Terms, By Country, 2012–2023
- Exports, In Value Terms, By Country, 2012–2023
- Export Prices, By Country Of Destination, 2012–2023
-
LIST OF FIGURES
- Market Volume, In Physical Terms, 2012–2023
- Market Value, 2012–2023
- Market Structure – Domestic Supply vs. Imports, In Physical Terms, 2012-2023
- Market Structure – Domestic Supply vs. Imports, In Value Terms, 2012-2023
- Trade Balance, In Physical Terms, 2012-2023
- Trade Balance, In Value Terms, 2012-2023
- Per Capita Consumption, 2012-2023
- Market Volume Forecast to 2030
- Market Value Forecast to 2030
- Products: Market Size And Growth, By Type
- Products: Average Per Capita Consumption, By Type
- Products: Exports And Growth, By Type
- Products: Export Prices And Growth, By Type
- Production Volume And Growth
- Exports And Growth
- Export Prices And Growth
- Market Size And Growth
- Per Capita Consumption
- Imports And Growth
- Import Prices
- Production, In Physical Terms, 2012–2023
- Production, In Value Terms, 2012–2023
- Imports, In Physical Terms, 2012–2023
- Imports, In Value Terms, 2012–2023
- Imports, In Physical Terms, By Country, 2023
- Imports, In Physical Terms, By Country, 2012–2023
- Imports, In Value Terms, By Country, 2012–2023
- Import Prices, By Country Of Origin, 2012–2023
- Exports, In Physical Terms, 2012–2023
- Exports, In Value Terms, 2012–2023
- Exports, In Physical Terms, By Country, 2023
- Exports, In Physical Terms, By Country, 2012–2023
- Exports, In Value Terms, By Country, 2012–2023
- Export Prices, By Country Of Destination, 2012–2023


